

Abstract

Protein dynamics and interactions in myoglobin (Mb) were characterized via two vibrational dynamics labels (VDLs): a genetically incorporated site-specific azide (Az) bearing unnatural amino acid (AzPhe43) and an active site CO ligand. The Az-labeled protein was studied using ultrafast two-dimensional infrared (2D IR) vibrational echo spectroscopy. CO bound at the active site of the heme serves as a second VDL located nearby. Therefore, it was possible to use Fourier transform infrared (FT-IR) and 2D IR spectroscopic experiments on the Az in unligated Mb and in Mb bound to CO (MbAzCO) and on the CO in MbCO and MbAzCO to investigate the environment and motions of different states of one protein from the perspective of two spectrally resolved VDLs. A very broad bandwidth 2D IR spectrum, encompassing both the Az and CO spectral regions, found no evidence of direct coupling between the two VDLs. In MbAzCO, both VDLs reported similar time scale motions: very fast homogeneous dynamics, fast, ~1 ps dynamics, and dynamics on a much slower time scale. Therefore, each VDL reports independently on the protein dynamics and interactions, and the measured dynamics are reflective of the protein motions rather than intrinsic to the chemical nature of the VDL. The AzPhe VDL also permitted study of oxidized Mb dynamics, which could not be accessed previously with 2D IR spectroscopy. The experiments demonstrate that the combined application of 2D IR spectroscopy and site-specific incorporation of VDLs can provide information on dynamics, structure, and interactions at virtually any site throughout any protein.
I. INTRODUCTION
As our understanding of protein structure has matured, it is becoming increasingly appreciated that structural dynamics over a wide range of time scales are required for biological function. Infrared (IR) spectroscopy provides a direct bond-specific approach to the study of molecules. Under the appropriate circumstances, IR methods are well suited for characterizing proteins from the perspective of a specific environment. When incorporated into a protein, the vibration(s) of an IR label provide a sensitive reporter of its environment; the center frequency is indicative of the average local electric field as well as possible direct interactions, such as hydrogen bonding. The inhomogeneous line width reflects the distribution of frequencies, which are a result of the distribution of environments experienced by the label. In addition, by measuring time-dependent evolution of the vibrational frequency, the structural changes causing the spectral changes can be detected and characterized. Ultrafast IR techniques can operate on a sufficiently short time scale to resolve fast dynamics that can be important to protein function.
Although fruitful investigations have been directed at the amide backbone vibrations of proteins,1–4 the large number of highly overlapped bands in protein IR spectra and the delocalized nature of their vibrations complicate interpretation and hinder their use as specific, localized IR probes of protein dynamics. C13 and O18 labeling have enabled the study of specific sites in a few peptides and very small proteins, but are not applicable to larger proteins.5–11 In many cases, small molecule ligands provide spectrally resolved probes of binding site environments,12–20 but obviously are only applicable to the subset of proteins that bind the ligands. Because of the limitations of these IR labels, there have been efforts to introduce into proteins unnatural amino acids bearing labels whose vibrations are discernible within their complex IR spectra.21–28 In principle, introduction of an unnatural amino acid containing a vibrational chromophore enables access to any specific site throughout a protein for characterization with IR spectroscopy.
Previously, unnatural amino acids bearing azide (Az),24–27 cyano,21–23 and carbon-deuterium28,29 labels have been incorporated into peptides and proteins, because their unique absorptions in an otherwise transparent region of the protein’s IR spectrum makes them experimentally tractable probes. Of these, the Az group has the largest transition dipole, which is expected to facilitate its use, especially for nonlinear spectroscopic methods, such as two-dimensional infrared (2D IR) vibrational echo spectroscopy, where the signals are dependent on the fourth power of the transition dipole moment. The utility of Az as an IR probe has been investigated in a number of time-independent studies. In addition to examples where a protein is ligated by an Az ion,12,14,19,20,30–33 several Fourier transform infrared (FT-IR) studies have employed Az probes incorporated by attachment to an amino acid. For example, peptide synthesis was using to incorporate azidoalanine (Ala-Az) for experimental studies of amyloid peptide aggregation.34,35 Azidohomoalanine has been employed to characterize the protein structure and folding of a small ribosomal protein using a genetic procedure that is residue-specific but not site-specific.36
Although Az-labeled analogues of alanine (Ala), methionine (Met), and phenylalanine (Phe) may be residue-specifically incorporated into proteins,25 an alternative strategy provides site-specific labeling of proteins using orthogonal transfer RNA (tRNA)/aminoacyl-tRNA synthetase pairs evolved in the laboratory to insert unnatural amino acids in response to a unique codon (nonsense or frameshift codon). This method has been applied previously to genetically encode AzPhe, as well as a large array of other unnatural amino acids, in both prokaryotic and eukaryotic organisms.37 Because the unique codon may be inserted anywhere within the coding sequence, any single, specific site in a protein may be labeled and studied. For example, AzPhe has been used to investigate the activation of rhodopsin using FT-IR spectroscopy.38,39
Az provides an intense absorption for the study of protein environments, but its FT-IR spectrum can be difficult to interpret. Multiple environments often manifest as multiple bands in an IR probe’s FT-IR spectrum. Because Az is thought to participate in Fermi resonances, multiple components in time-independent spectra are difficult if not impossible to interpret in terms of protein conformational states. Furthermore, Az absorption bands typically have Voigt line shapes, so the distribution of Az frequencies, or the distribution of the probe’s environments, cannot be determined from the FT-IR spectrum alone. The measurement of time-dependent frequency fluctuations and even the extent to which a spectroscopic line is inhomogeneously broadened requires time-dependent IR spectroscopy. Ultrafast 2D IR vibrational echo spectroscopy can be used to identify the origin of multiple IR absorption bands, extract the homogeneous and inhomogeneous contributions to the linear line width, and determine the time scales and amplitudes of frequency fluctuations arising from protein structural motions.
2D IR vibrational echo spectroscopy has been applied to the study of protein dynamics, including their role in ligand binding,12,40–42 folding,5,43–46 and other biological processes.47–51 Like FT-IR spectroscopy, 2D IR spectroscopy has been employed in numerous studies directed toward characterizing endogenous amide bands1–3 and exogenous ligands.12,15,16,19 CO bound at the active site of heme proteins has been successfully utilized as an IR active ligand.40,43,45,48–51 The CO provides a single vibrational label with a strong IR transition located in specific, well-defined position. Similarly, studies have employed Az ion-ligands as IR probes, for example, bound to carbonic anhydrase,14 hemoglobin,14,19 and formate dehydrogenase.12
Here we report the genetic site-specific incorporation of AzPhe into myoglobin (Mb) at position Phe43 (MbAz) as a vibrational dynamics label (VDL) for investigating structural dynamics using 2D IR spectroscopy, and to demonstrate the general applicability of this approach for dynamical studies of proteins. The Az was placed at a site proximal to the heme moiety where the dynamics determined from this new VDL could be compared to those measured with the well-studied heme-bound CO VDL. Phe43 is oriented into the heme pocket, and thus MbAz is expected to position the Az proximal to any bound heme ligands (Figure 1). The FT-IR and 2D IR spectra of MbAzCO and MbCO were compared using CO as the VDL to investigate the effect of the Az substitution on Mb structure and dynamics through its influence on the time-dependent and time-independent spectroscopy of CO. The application of the Az VDL also enabled the first use of 2D IR spectroscopy to investigate oxidized MbAz (with the heme-Fe3+ ligated by water52) and to compare its dynamics to the reduced MbAzCO (CO bound at the active site). The incorporation of AzPhe not only enabled the 2D IR spectroscopic study of dynamics of the oxidized protein, but also provided an unprecedented view of the heme pocket from the perspective of two different VDLs. This report of the use of a genetically encoded, site-specific unnatural amino acid VDL in a 2D IR spectroscopic study demonstrates the utility of the approach, which can be extended in further studies to investigate dynamics and interactions using a VDL at virtually any specific site in a protein.
Figure 1.

Structure of MbCO (PDB ID 1BZR) showing the local environment of CO and the Az VDL of AzPhe43.
II. EXPERIMENTAL PROCEDURES
A. Sample Preparation
Sperm whale Mb with a N-terminal His6 tag and a tobacco etch virus (TEV) cleavage site was cloned into the pBad vector (Invitrogen) behind the arabinose promoter. To incorporate an unnatural amino acid, position 43 was mutagenized from TTC (Phe) to the amber stop codon, TAG. pBad-Mb-43TAG was cotransformed with pEVOL-pAzF, which contains the orthogonal AzPhe p-azidophenylalanine synthetase and the corresponding amber suppressor tRNA pair.53 Cells were inoculated at an optical density at 600 nm (OD600) of 0.2 from a saturated culture and grown at 37 °C and 250 rpm. At OD600 0.8, the culture was induced with 0.02% arabinose, 1 mM AzPhe, and 0.5 mM aminolevulinic acid and grown at 30 °C overnight in the dark. Cells were collected the next day, lysed by flash freezing and sonication, and purified by nickel nitrilotriacetic acid (Ni-NTA) resin. The protein was buffer exchanged and concentrated at 4 °C in 50% glycerol and 50% phosphate-buffered saline (PBS). The protein was characterized by sodium dodecyl sulfate polyacrylamide gel electrophoresis (SDS-PAGE) and mass spectrometry (see Supporting Information). The presence of incorporated AzPhe was confirmed by mass spectrometry and the ability to undergo click chemistry with a dye. Protein was stored at 4 °C in the dark. For experiments with unlabeled protein, Mb was produced in an equivalent fashion by expression from the non-mutagenized plasmid.
For the IR experiments, the samples were clarified through 0.45 μm filters and concentrated to ~7 mM. The CO complexes were prepared by reducing Mb with sodium dithionite, followed by treatment with a gentle stream of CO gas for several minutes. The protein was then placed between two CaF2 windows with a 50 μm Teflon spacer. The linear IR spectra of samples analyzed with 2D IR spectroscopy showed CO bands of 30–50 mOD on a ~0.4 OD background and Az bands of 10–20 mOD on a ~0.6 OD background.
B. Vibrational Spectroscopy
Linear FT-IR spectra were acquired at 1 cm−1 resolution on a Bruker Vertex 70 spectrophotometer. The 2D IR experiments of the individual VDLs were performed as previously described54,55 with ~120 fs duration pulses with ~0.8 μJ in each of the excitation pulses generated using an mid-IR laser system consisting of a Ti:Sapphire oscillator/regenerative amplifier pumped optical parametric amplifier. The frequencies of the IR pulses were set to the center frequency of the VDL under study, i.e., 1950 cm−1 for the CO and 2120 cm−1 for the Az. To obtain a 2D IR spectrum encompassing both the CO and Az spectral regions, experiments were performed on an ultrafast mid-IR laser system that produced shorter, 60 fs pulses, with a broader 220 cm−1 bandwidth capable of simultaneously exciting both the CO and Az VDLs.
The 2D IR echo experiments involved application of three separately delayed, mid-IR pulses focused to a ~400 μm spot size (99% diameter) in the sample. The times between the first and second pulses and the second and third pulses are referred to as τ and Tw, respectively.55 At a time ≤ τ after the third pulse, a vibrational echo is emitted by the sample in a unique direction. The vibrational echo pulse was overlapped with another IR pulse, called the local oscillator, which provided a phase reference for the vibrational echo signal. The combined vibrational echo/local oscillator pulse was passed through a monochromator onto an IR array detector, which records a spectrum that yielded the ωm frequency axis (vertical axis), the axis of vibrational echo emission. For a fixed Tw, τ was scanned to produce an interferogram at each ωm. These interferograms were Fourier transformed to produce the second, ωτ axis (horizontal axis), of the 2D IR spectrum. The experiment was then repeated to produce 2D IR spectra over a range of Tw times. The changes in the spectra with Tw provide dynamical information about the system.
Pump–probe experiments were also performed to determine the vibrational lifetimes and for use in processing the 2D IR data. A ~3.5 μJ pump pulse was followed by a variably delayed, ~0.4 μJ probe pulse. The pump-induced changes in the probe beam spectrum at each time delay were measured by dispersing the transmitted probe beam through the monochromator onto an array detector.
C. Data Analysis
The linear FT-IR spectra were background-corrected by subtracting the appropriate background FT-IR spectra (the protein spectra without the VDL of interest), followed by fitting and subtracting a polynomial function to the spectral regions away from the CO and Az bands. This function was used to make small residual baseline corrections. The resulting CO spectra were fit to a sum of Gaussian functions to determine the center frequencies and line widths of the composite bands. Because the major bands of the Az spectra showed neither pure Lorentzian nor Gaussian line shapes, they were fit to Voigt functions. Due to the presence of a second, smaller low frequency band, the low frequency side of the major Az band was excluded from the Voigt fit. The resulting Voigt functions were then subtracted from the baseline-corrected spectra, resulting in residual spectra showing at least one additional band. Due to the noise of the residual spectra, the second low frequency bands were then simply fit to Gaussian functions.
Time-resolved pump–probe spectra were used to determine the vibrational lifetimes of the Az and CO groups. At each frequency of the spectra, the pump-induced difference in the probe beam intensity as a function of the probe delay time was fit to an exponential decay. Due to the large nonresonant signal present at very short delay times and the very small signal of the Az, only data beyond a delay time of 0.75 ps was used to determine the lifetime of the Az VDL.
The theory, analysis, and interpretation of 2D IR vibrational echo spectroscopy used here have been presented in full detail previously.50,56,57 As the time Tw is increased, the proteins have more time to sample different structural configurations. As a protein’s structure evolves, the frequency of the Az or CO stretch changes within the distribution of frequencies reflected by the inhomogeneously broadened (Gaussian) component of the absorption spectrum. This frequency evolution is called spectral diffusion, and it is directly related to the conformational fluctuations of the protein. Simulations of MbCO have shown that the inhomogeneous broadening of the linear absorption bands and the spectral diffusion that leads to sampling of this inhomogeneous distribution are well described by the Stark effect.58,59 Structural fluctuations of the protein and the solvent produce a time-dependent electric field at the VDL. The time evolution of the electric field induced by the protein structural dynamics produces spectral diffusion.
The time dependence of the spectral diffusion was extracted from the 2D IR spectra using the center line slope (CLS) formalism.56,57 The CLS method quantifies the time-dependent changes in 2D line shapes, and is used to obtain the frequency–frequency correlation function (FFCF). The CLS is a normalized function that is closely related to the FFCF. Its decay times are the same as those of in the FFCF. The difference between 1 and the value of the CLS at Tw = 0 is related to the homogeneous component of the linear spectral line (see below). Combining the CLS with the linear absorption spectrum yields the full FFCF. The FFCF is the direct connection between the experimental observables and the details of the dynamics and structure of the system. The FFCF for proteins have been calculated and related to experiments using molecular dynamics (MD) simulations.54,60
The multiexponential form of the FFCF, C(t), was used to model the FFCF.50,56,57
| (1) |
For the ith dynamical process, Δi is the range of Az or CO frequencies sampled due to protein structural fluctuations, and τi is the time constant of these fluctuations. This form of the FFCF has been widely used and found applicable in studies of the structural dynamics of proteins.41,45,48,50,51,54,58,61,62 The experimental time window is limited by the vibrational lifetime (T1) decay to several times T1, which reduces the signal to zero. Occurrence of very slow structural fluctuations on time scales longer than the experimental time window will appear as a term with τi = ∞ in the FFCF. This term is referred to as the “static” component. The corresponding Δi is the amplitude of the static component, that is, the amplitude of the component of the fluctuations that are on a time scale that is long compared to the experimental time window.
If Δiτi < 1, the dynamics are motionally narrowed and contribute to the homogeneous line width. The motionally narrowed dynamics are characterized by , where is the pure dephasing time. The total homogeneous dephasing time, T2, is determined by . The pure dephasing line width is . Overall, the Tw-dependent CLS and the difference of the CLS from 1 at Tw = 0, combined with the linear absorption spectrum, yield the full FFCF describing the dynamics of the system.56,57
III. RESULTS AND DISCUSSION
A. Time-Independent Spectroscopy
The FT-IR spectra of the CO stretching mode of MbCO and MbAzCO are shown in Figure 2A,B, respectively. The spectra were fit to a sum of Gaussian functions, which were used to determine the center frequency and line width of the composite bands. In the absence of the Az (Figure 2A), two intense bands appear: a larger band at 1945 cm−1 and a smaller band at 1934 cm−1 of approximately half the integrated area. These bands are the well-known A1 and A3 states, respectively, which have be assigned to different orientations of the His64 side chain within the distal heme pocket.54,58,60,63 The MbCO spectrum is nearly identical to that observed for this protein previously, with the exception of the appearance of a very weak (~2% of total integrated area) band at 1962 cm−1. A similar high frequency band, which has been assigned to a state referred to as A0, is found in some Mb variants and in acidic conditions where His64 is protonated and the imidazole side group is directed out of the heme pocket.64–66 The presence of the band here is likely due to the protein’s His tag, as is discussed in a separate publication.67
Figure 2.

FT-IR spectra of CO in (A) MbCO and (B) MbAzCO and of Az in (C) MbAz and (D) MbAzCO. Experimental data are shown in black. For A and B, the individual Gaussian fits are shown in blue, and their sum is shown in red. In C and D, the Voigt and Gaussian fits to the data are shown in red and blue, respectively. The residual spectra from subtraction of the Voigt fits of the main bands from the experimental spectra are shown in green.
Comparison of the spectra of MbCO and MbAzCO (Figure 2A,B) shows that incorporation of AzPhe43 does lead to perturbation of the local environment of the CO. Unlike the spectrum of MbCO, the MbAzCO spectrum was best fit by a sum of four rather than three Gaussian functions. These bands have center frequencies of 1930, 1944, 1952, and 1962 cm−1. It seems reasonable that the band at 1962 cm−1 still reflects the A0 state. The major band of MbAzCO is shifted to higher frequency by 7 cm−1 than the A1 state of MbCO, and the line width is slightly reduced to 8.9 cm−1 from 10.6 cm−1. Assuming the major band still reflects the A1 state of Mb, the blue shift is consistent with the introduction of negative potential near the CO due to Az incorporation.12–20 The additional band in the FT-IR spectra of MbAzCO also indicates that the Az incorporation leads to the population of at least one additional substate. Considering the small integrated areas of the two bands at 1930 cm−1 and 1944 cm−1, it is possible that they reflect the A3 substate of MbCO becoming two substates in MbAzCO. Overall, the FT-IR spectra suggest that the most highly populated substate in MbAzCO is electrostatically perturbed from that in MbCO, but the similar line widths of the corresponding bands indicate that the distribution of states sampled within the substate are similar.
The incorporation of AzPhe43 was modeled by manually introducing the Az group into the crystal structure of MbCO.68 Shown in Figure 1, the CO is sandwiched between the Az and the side chain of residue His64. The different conformations of His64 are thought to alter the orientation of its electronic orbitals relative to CO and lead to the multiple IR bands observed for MbCO by modulating the extent of back bonding from the heme Fe d orbital to the CO π* antibonding orbital.18 AzPhe43 may introduce additional negative potential next to the CO from the Az electron orbitals, leading to decreased back bonding and the observed blue-shift of the band corresponding to the most highly populated substate. The Az group also has a relatively strong dipole, which likely impacts the electric field at the CO, shifting its vibrational frequency via a Stark effect. Thus, it is not surprising that the FT-IR spectrum of the CO changes because of the introduction of Az. However, the perturbation due to the Az VDL is minor compared to the spectral changes caused by mutation of Phe43 to other residues. Replacement of Phe43 with tryptophan (Trp) leads to a spectrum consisting of largely a single band at 1960 cm−1.69 The spectrum of Phe43Leu MbCO shows a major band at 1954 cm−1, only 2 cm−1 shifted from the proposed A1 band observed in MbAzCO, but a second band of about half the intensity is found at 1967 cm−1, reflective of the A0 rather than the A3 state.69 Despite these spectral changes, only a 5–6 fold decrease in both CO and O2 binding affinities and almost no change in the relative CO/O2 binding affinity are observed in the mutants Phe43Trp and Phe43Val, in comparison to the orders of magnitude changes observed for His64 mutants,70 suggesting Mb should be relatively permissive of modification at Phe43. Unlike both mutant MbCO spectra, bands at lower frequency, similar to the A3 band, are still present in the spectra of MbAzCO, suggesting that the perturbation to the environment due to Az incorporation is less than the impact from residue substitution.
The FT-IR spectra of the Az asymmetric stretching region without and with bound CO (Figure 2C,D, respectively) show a major band centered at 2120 cm−1. Because this band appears to be neither purely Gaussian nor Lorentzian in line shape, it was fit to a Voigt profile (red curve). For MbAz, this resulted in a band with a full width at half-maximum (fwhm) of 30 cm−1 and more Lorentzian (24 cm−1) than Gaussian (13 cm−1) character. Upon binding CO, the Az band narrows to a fwhm of 24 cm−1 and the line width has a reduced Lorentzian (19 cm−1) relative to Gaussian (11 cm−1) contribution. The residual spectra (green curves, Figure 2C,D) that result from subtraction of the fitted Voigt functions show the presence of at least one additional band. Due to the noise in the residual spectra, they were fit to Gaussian functions (blue curves, Figure 2C,D). The residual spectrum of MbAz was well fit by a single band centered at 2075 cm−1. The residual spectrum of MbAzCO was fit to a single band at 2085 cm−1; however, the residuals (Figure 2D, green curve) show an oscillatory feature that could be removed by including an additional band in the fit (see Supporting Information). Fitting the residual spectrum of MbAzCO with two Gaussian functions yields a band at 2096 cm−1 and another at 2078 cm−1, similar in frequency to the 2075 cm−1 band observed for MbAz. Thus, the binding of the CO either shifts the low frequency band to higher frequency, or leads to the appearance of a second band. In the latter case, the CO and Az spectra would be analogous. Both the CO and Az spectra of MbAzCO would contain a major band and two smaller bands at lower frequencies. The relative areas of these bands do not correspond, however, so either the transition dipoles of the different CO or Az states vary, or the sets of Az and CO bands do not correspond to the same substates.
The multiple bands in the FT-IR spectra of Az in MbAz and MbAzCO could arise from either two distinct environments or splitting from a Fermi resonance.69,71 The possible appearance of three bands in the MbAzCO spectra and the fact that only one of the two bands shifts in frequency upon CO binding suggests that the origin of the bands is not a Fermi resonance. This conclusion is supported by the 2D IR spectra, which show no evidence of a cross peak between the two absorption bands (see below). Thus, the multiple bands likely reflect different environments in Mb. It is noteworthy that AzPhe in 50% glycerol/PBS solution also shows a FT-IR spectrum containing multiple bands (see Supporting Information), but shifted in frequency. This suggests that the Az frequency is highly sensitive to either multiple conformations of the side chain or differences in the local solvent structure around the Az.
Upon reduction and CO binding, two major changes occur in the Az spectrum, as shown in Figure 2C,D. With CO bound, the lower frequency band shifts to higher frequency (or a second band of intermediate frequency appears), while the frequency of the main band remains constant. In addition, the width of the main band decreases. As shown below with the 2D IR spectroscopy, there is no direct coupling between the CO and the Az. Therefore, addition of the CO will not directly affect the modes of Az. However, the MbAzCO protein will have a different structure than MbAz. In MbAz, the iron is Fe3+, water is bound, and the heme is domed.52 In MbAzCO, the iron is Fe2+, the heme is planar, and, of course, CO is bound at the active site. It is reasonable to postulate that these changes in the protein structure alter the AzPh43 environment and produce the change in the low frequency band and the reduction in the main band’s line width. A study employing both ab initio calculations and classical and quantum mechanical/molecular dynamics simulations found that interaction between hydrogen-bond donors and the σ and π orbitals of Az in Ala-Az lead to a shift of the probe absorption to higher and lower frequency, respectively.35 The red-shifted Az absorption observed in Mb compared to AzPhe in the 50% glycerol/PBS solvent (2120 cm−1 vs 2124 cm−1, respectively, see Supporting Information) is consistent with the loss of H-bonding interactions between the σ orbitals of Az and water. The water molecule bound at the heme in MbAz could possibly participate in an H-bonding interaction with AzPhe43. If this interaction involved π Az orbitals, the loss of the interaction by the replacement of the bound water with CO in MbAzCO would lead to the observed blue shift in the low frequency band. The introduction of negative potential near AzPhe43, from either the CO, heme π system, or other protein residues in MbAzCO, may also have the opposite impact on the Az frequency as the electron withdrawing effect of a H-bond donor, shifting the absorption to higher frequency via interaction with the Az π orbitals.
B. Time-Dependent Spectroscopy
The time-resolved pump–probe experiments of the CO vibration in MbCO and MbAzCO yielded first excited state vibrational lifetimes (T1) of 20 ps at the A1 center frequency for both proteins, similar to previous experiments on MbCO.72,73 In comparison, the T1 times of the Az vibration in MbAz and MbAzCO were dramatically shorter, somewhat shorter than a picosecond (see Table 1). Within experimental uncertainty, the Az lifetimes for MbAz and MbAzCO are the same. Thus, the lifetimes of each type of VDL is not influenced by the presence of the other. The short lifetimes measured for Az are on the low edge of the 0.8–2.7 ps times measured for the Az ion in different solvents.74–76 Here, the Az is not an ion but is covalently bonded to the phenylalanine and conjugated to the phenylalanine π system. The covalent bond and the conjugation can provide coupling into the modes of the phenylalanine, providing efficient pathways for vibrational relaxation.77 Unfortunately, the short Az lifetimes significantly limit the temporal dynamic range of 2D IR experiments.
Table 1.
FFCF Parameters for the CO Label
| MbCO | MbAzCO | ||
|---|---|---|---|
| T1 (ps) | 19.6 ± 0.5 | 20.0 ± 0.5 | |
| T2 (ps) | 5.3 ± 1 | 5.5 ± 1 | |
|
|
7.3 ± 1 | 7.6 ± 1 | |
| Δ1 (cm −1) | 0.9 ± 0.1 | ||
| τ1 (ps) | 1.0 ± 0.5 | ||
| Δ2 (cm −1) | 2.7 ± 0.2 | 2.4 ± 0.1 | |
| τ2 (ps) | 21 ± 3 | 49 ± 6 | |
| Δ3 (cm −1) | 3.0 ± 0.1 | 2.0 ± 0.1 | |
| τ3 (ps) | ∞ | ∞ |
Figure 3 shows 2D IR spectra of CO in MbCO (top panels) and MbAzCO (bottom panels) at a short and a relatively long Tw. Note that the frequency scales on the horizontal axes are not the same for the two sets of panels. Positive bands associated with the 0–1 transition appear along the diagonal. As observed in the linear FT-IR spectrum for MbCO, a large positive band occurs at 1945 cm−1, and a smaller band occurs at 1934 cm−1. For MbAzCO, there is also one large positive band on the diagonal arising from the 0–1 transition of the main peak in the FT-IR spectrum at 1952 cm−1. Negative bands occur at ωm of the 1–2 transition frequencies. These bands are shifted along ωm by the vibrational anharmonicity (25 cm−1).50 The negative bands are not shown in the figure, although a small portion of them can be seen near the bottom of the upper panels. Only the main positive 0–1 bands were analyzed to extract the Mb dynamics. As Tw increases, the changes in the shape of the bands caused by spectral diffusion are evident in the figures.
Figure 3.

2D IR spectra of CO in MbCO (top panels) and MbAzCO (bottom panels) at two Tw’s.
Figure 4 displays the 2D IR spectra of the Az antisymmetric stretch of MbAz (top panels) and MbAzCO (bottom panels) at Tw’s of 500 fs and 2 ps. Both show positive bands associated with the 0–1 transitions along the diagonal at 2120 cm−1. Again, at the bottom of the panel appear portions of the negative bands corresponding to the 1–2 transition below the positive diagonal bands, shifted along ωm to ~2100 by the anharmonicity (~20 cm−1). A 2D IR spectrum of MbAz displaying the entire frequency axis can be found in the Supporting Information. Lower frequency (2075–2085 cm−1) bands observed in the FT-IR spectra are not apparent in the 2D IR spectra because they are weak and overlap with the large, negative 1–2 bands of the main peak. There is also no evidence for a cross band at ωτ of 2075/2085 cm−1 andωm of 2120 cm−1, which would be expected if the lower frequency Az bands were due to Fermi resonances. The line widths of the Az bands (24–30 cm−1) are greater than the anharmonicity, and so the 1–0 and 1–2 bands in the 2D IR spectra overlap somewhat. As has been shown in the theoretical development of the CLS method,56,57 the overlap does not interfere with the data analysis, and only the 0–1 bands were analyzed. Compared to the 2D bands of CO at 500 fs, the Az bands are less elongated along the diagonal, and show a somewhat diamond shape that is characteristic of significant homogeneous broadening.78
Figure 4.

2D IR spectra of Az in MbAz (top panels) and MbAzCO (bottom panels) at two Tw’s.
Using broad band IR pulses, a 2D IR spectrum encompassing both the CO and Az spectral regions was obtained (Figure 5). The diagonal bands associated with the CO at ~1950 cm−1 and the Az at ~2120 cm−1 are clearly visible. Because the transition dipole of the CO stretch is much greater than the Az stretch, resulting in a much stronger signal from the CO than from Az, the region around the CO bands has been divided by 25 so that the CO and Az bands can have approximately the same amplitude as in the figure. If the Az and CO vibrational modes are directly coupled, off-diagonal bands would appear in the spectrum at the positions shown by the red circles in Figure 5. The amplitudes of the diagonal bands are proportional to and , where μ is the magnitude of the transition dipole moment. For coupled modes, the magnitude of the off-diagonal bands would be proportional to , which would increase the amplitude of off-diagonal peaks relative to the Az diagonal band.79 However, there are more quantum pathways that contribute to the diagonal peaks and there is an unknown orientational factor.80 Complete analysis of the magnitude of possible off-diagonal bands shows that they could range from approximately equal to the Az diagonal band to approximately a factor of 2 greater than the Az diagonal band. Thus, if the off-diagonal bands existed, they would be clearly visible. Therefore, there is no direct coupling between the two VDLs, and the Az and the CO act as independent VDLs in MbAzCO.
Figure 5.
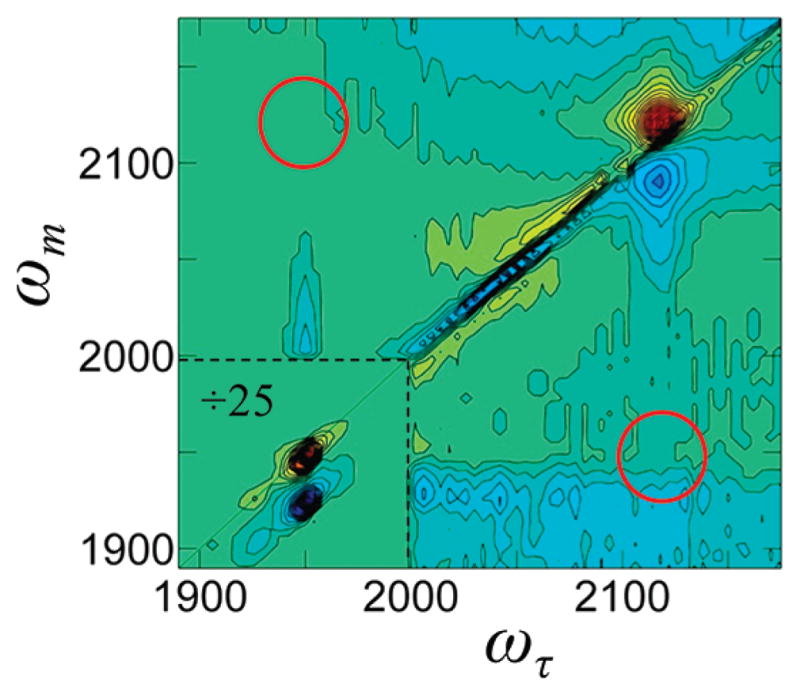
2D IR spectra of MbAzCO at Tw of 300 fs encompassing both Az and CO spectral regions. The region around the CO peaks (lower left corner) has been divided by 25 so that the CO bands will have approximately the same amplitude as the Az bands. The red circles show the locations where off-diagonal peaks should be plainly visible if the CO and Az vibrations were directly coupled.
The changes in the 2D line shapes with increasing Tw reflect changes in the IR frequencies of the VDLs with time (spectral diffusion). Because the frequencies of the VDLs are sensitive to their environments, changes in frequencies reflect structural evolution of the proteins. At short Tw’s, bands that have substantial inhomogeneous broadening appear highly elongated along the diagonal in 2D IR spectra. The width perpendicular to the diagonal at very short time is caused by the homogeneous (motionally narrowed) contribution to the spectra. As Tw is increased, the protein has additional time to sample its range of structures before the arrival of the third pulse. As an increasing number of the VDLs no longer have the same initial (ωτ) and final (ωm) frequencies because of fluctuations in the protein structure during the time period Tw, the bands in the 2D spectra become more circular. This change in line shape is evident from comparing the 2D IR spectra of CO in MbCO and MbAzCO at short and long Tw’s (Figure 3). For Az in MbAz and MbAzCO, changes are also observed in the line shape with Tw, although the extent of elongation at early Tw’s is much less than that found for the CO VDL (Figure 4).
The Tw dependence of the 2D line shapes can be related to the underlying dynamics using the CLS method.56,57 Figure 6 shows the CLS decays for CO (upper panel) in MbCO (red) and MbAzCO (blue) and for Az (lower panel) in MbAz (red) and MbAzCO (blue), as well as multiexponential fits to the decays. The difference between the CLS value and 1 at Tw = 0 reflects the homogeneous contribution to the dynamics, which results from both pure dephasing and the vibrational lifetime. The Tw dependence of the CLS reflects the dynamic sampling of the inhomogeneous distribution of frequencies found in the linear spectra, i.e., the slower motions that lead to spectral diffusion. As discussed above, the CLS decays were analyzed in conjunction with the linear FT-IR spectra and vibrational lifetimes to obtain the FFCFs, which quantify the dynamics associated with the fluctuating VDL frequency. The parameters describing the FFCFs for the CO and Az VDLs are listed in Tables 1 and 2, respectively.
Figure 6.

Upper panel: CLS decays (symbols) and exponential fits (lines) for CO in MbCO (red) and MbAzCO (blue). Lower panel: CLS decays (symbols) and exponential fits (lines) for Az in MbAz (red) and MbAzCO (blue).
Table 2.
FFCF Parameters for the Az Label
| MbAz | MbAzCO | ||
|---|---|---|---|
| T1 (ps) | 0.9 ± 0.3 | 0.7 ± 0.2 | |
| T2 (ps) | 0.5 ± 0.1 | 0.5 ± 0.1 | |
|
|
0.8 ± 0.2 | 0.7 ± 0.2 | |
| Δ1 (cm−1) | 5.3 ± 0.8 | 4.1 ± 0.8 | |
| τ1 (ps) | 1.5 ± 0.6 | 1.3 ± 0.7 | |
| Δ2 (cm−1) | 5.4 ± 0.5 | 3.2 ± 0.6 |
The FFCFs for the CO show that the FT-IR line widths are dominated by inhomogeneous broadening, as observed previously.40,43,45,48–51 For both MbCO and MbAzCO, the contribution to the CO line width from vibrational lifetime is very minor (only 0.3 cm−1 of the ~10 cm−1 line width). Any differences in the homogeneous contribution of MbCO and MbAzCO due to introduction of the Az are within experimental error ( , Table 1). MD simulations of MbCO81 show that the fluctuations that produce the motionally narrowed pure dephasing contribution to the linear and 2D spectra occur on a time scale of less than 100 fs. Such fast motions of the protein will involve small groups of atoms rather than large structural changes. Therefore, fast motions involving the Az itself or changes to the fast motions of nearby residues as a result of substitution of AzPhe43 for Phe43, if they occur, do not have a substantial impact on the CO pure dephasing, .
In the absence of Az, the dynamics of MbCO occur on three time scales: very fast fluctuations that lead to the homogeneous component, dynamics on a 21 ps time scale, and dynamics slower than the experimental time scale (τ = ∞). Inspection of the top panel of Figure 6 shows that the MbAzCO curve (blue curve) has a fast component not present in the MbCO data (red curve). Likewise, the FFCF determined for MbAzCO shows an additional fast component with a 1 ps time constant. It is possible that the motion of AzPhe43 induces the fast ~1 ps motion in the protein. However, it is also possible that this motion is present in the MbCO, but the structural fluctuations responsible for it do not produce a fluctuating electric field of sufficient amplitude to be reported by the CO VDL. If the motion involves Phe43 and/or nearby groups, then introducing the Az as AzPhe43 may produce a larger amplitude fluctuating electric field at the CO, one that is sufficiently large for the CO to report it in the time evolution of the 2D spectra. It is important to recall that both the MbCO and the MbAzCO used in this study have the same His tag. Although we have characterized Mb dynamics via VDLs within the same protein background in order to permit robust comparisons, it is noteworthy that the FFCF of MbCO without the His tag has a 1.4 ps component.67 It appears that the His tag suppresses this fast component in MbCO, but the presence of Az resurrects it.
Differences are also observed in the slower components of the FFCFs of MbCO and MbAzCO. As a result of incorporation of AzPhe43, the 21 ps time constant is increased to 49 ps. Previous experimental and MD simulation studies of L29I MbCO have associated dynamics on a similar time scale with the tilting motion of helix E and its consequent effect on the motion of His64.49,54 The added bulkiness of the introduced Az may restrict Phe43 or other residues’ movement within the heme pocket, slowing motion on this intermediate time scale. It is important to note, however, that the dynamics determined by 2D IR spectroscopy are impacted by the summed electric field fluctuations at the oscillator due to the entire protein and solvent environment,54,60,81,82 and so the assignment of the observed dynamics to a specific structural change in a protein should be done with caution. In addition to differences in the dynamic time scales, the amplitudes of frequency fluctuations associated with the slower motions are reduced in the presence of the Az VDL. The values of Δ2 are similar (2.7 vs 2.4 cm−1), but the value of Δ3 is significantly smaller in the presence of the Az VDL (3.0 vs 2.0 cm−1 for MbCO and MbAzCO, respectively). From inspection of the amplitudes in Table 2, frequency fluctuation amplitude associated with very slow dynamics in MbCO appears to transfer to the fast, 1 ps component in MbAzCO. Thus, part of the distribution of environments that are sampled on very slow time scales in MbCO are accessed on much faster time scales in MbAzCO.
The site-specific incorporation of the Az VDL permits the characterization of Mb dynamics from a second perspective: that of a side chain of the protein itself. Unfortunately, the short lifetime of Az (<1 ps) greatly hampers the experiments. The CO stretches of MbCO and MbAzCO have very strong IR transitions, and the lifetimes are 20 ps. Therefore, it was possible to collect good data to 80 ps, when the signal is less than 2% of its initial value. The Az stretch is a weaker transition, and four Az lifetimes is <4 ps. Therefore, the quality and the time span of the Az data are severely reduced compared to the CO data.
In addition to the homogeneous component, the CLS decays for the Az are fit to a single decay plus a constant, where the constant reflects the dynamics that are too slow to be observed within the experimental time window. MbAz and MbAzCO show decay constants of 1.5 and 1.3 ps, respectively, the same within experimental error (Table 1). These values are also within experimental error of the 1 ps decay component observed for CO in MbAzCO. The next slowest component of 49 ps in the CLS of CO in MbAzCO would be too slow to be observed in the Az CLS decay and instead would contribute to the constant component. That the same time constants were obtained with the two different VDLs indicates that the characterization of the time scales of protein dynamics by 2D IR spectroscopy does not depend on the chemical nature of the particular VDL employed. These results, although of limited time range, show that the dynamics being measured are reflective of those of the protein environment and are not intrinsic to the VDL utilized.
The FFCF parameters determined from fitting both the CLS decays and linear FT-IR spectra of Az show that the linear absorption line widths are substantially homogeneously broadened (see Table 3). As discussed above, unlike CO, the short lifetime of Az contributes significantly to the absorption line width (6–8 cm−1). Table 3 compares the homogeneous (Lorentzian) and inhomogeneous (Gaussian) contributions to the linear IR absorption bands determined by 2D IR spectroscopy to those determined from Voigt fits of the FT-IR spectra (listed in parentheses). The results demonstrate that fitting the linear spectra gives reasonable values but overestimates the homogeneous component and underestimates the inhomogeneous component, particularly for MbAz. From the linear spectra alone one would underestimate the distribution of environments sampled by the AzPhe43 and attribute the greater line width of the linear spectrum of MbAz to homogeneous rather than inhomogeneous broadening. The 2D IR experiments reveal that the greater line width of the linear spectrum of AzPhe43 in MbAz arises from the existence of a greater distribution of environments. The errors in obtaining the homogeneous and inhomogeneous components from the linear spectra are not surprising. If the system is dominated by either the homogeneous or inhomogeneous component, no information can be extracted about the other component from the linear line shape. When the two components are approximately equal, the determination of their contributions rests mainly on the fit to the wings of the line shape where the amplitude is small. For protein samples, it is necessary to subtract a large background absorption, mainly due to water, to obtain the spectral line shapes, and small errors in background subtraction particularly affect the wings of the line. Although there is significant uncertainty in the fit parameters of the Az CLS data, all of the fits result in the same curves through the data, which makes the error in the Tw = 0 value very small. It is this value, in addition to the linear line shape, that determines the homogeneous component in the determination of the FFCF.
Table 3.
Contributions to Az Line Width
| MbAz (cm−1) | MbAzCO (cm−1) | |
|---|---|---|
| total fwhm | 30 | 24 |
| Γ | 19 (24) | 18 (19) |
| Γ* | 13 | 10 |
| Γ(T1) | 6 | 8 |
| inhomogeneous width (fwhm) | 18 (13) | 12 (11) |
| Δ1 | 5.3 | 4.1 |
| Δ2 | 5.4 | 3.2 |
In addition to determining the homogeneous component, analysis of the time-dependent 2D spectra provides information on the time evolution of the protein structures that give rise to the inhomogeneous portions of the linear spectra. The amplitudes of the frequency fluctuations associated with the different time scales were determined for the FFCF of Az in MbAz and MbAzCO (Table 1). The value of Δ1, the standard deviation of the frequency fluctuations for motions on the ~1 ps time scale, determined for MbAz is somewhat greater than that obtained for MbAzCO (5.3 cm−1 vs 4.1 cm−1), but the error bars overlap to some extent. A greater difference is observed in the values of Δ2 (5.4 cm−1 vs 3.2 cm−1), which is associated with motions longer than the experimental time window. These results indicate that the greater distribution of environments in MbAz is mostly due to a larger range of structures that interconvert on a relatively slow time scale. Very little difference is apparent from comparison of high-resolution crystal structures of oxidized and CO-bound Mb,52 with only 0.21 Å root-mean-square-displacement found between the two structures. However, the incorporation of AzPhe43 places the Az directly within the heme pocket adjacent to the heme bound ligand. Motions of the AzPhe43 side chain itself, the water molecule, and CO bound to the heme in MbAz and MbAzCO, respectively, as well as motions of the neighboring heme pocket residues, are expected to directly impact the Az vibration. The slow time scale associated with the disparate dynamics indicate that they involve motions of multiple atoms. Motions throughout the entire protein lead to fluctuations in the frequency of VDLs, such as that observed in previous MD simulations of MbCO.54,60,81,82 Larger scale protein motions can either directly impact the Az vibrational frequency through their summed electric field, or indirectly by influencing the motions of residues more proximal to the Az. For instance, changes in the motions of helix E should influence the hydrogen bonds that occur between the His64 and both the water and the CO ligands of heme, which in turn can differentially impact the dynamics reported by the adjacent Az group.
IV. CONCLUDING REMARKS
Here we have described the first use of a genetically encoded, site-specifically incorporated unnatural amino acid VDL for the investigation of the dynamics of a protein using 2D IR spectroscopy. The addition of the Az group into the heme pocket of Mb made it possible to study Mb dynamics from the perspective of two different VDLs. The results demonstrate that the combined application of 2D IR spectroscopy and site-specific incorporation of VDLs should enable the characterization of protein dynamics using a VDL at virtually any site throughout a protein. The genetically incorporated unnatural amino acid is akin to isotopic labels in NMR and spin labels in ESR in that it enables characterization of specific sites throughout a protein, but permits the resolution of dynamics on much faster time scales. Fast protein dynamics are important for small molecule diffusion through proteins,83,84 and are thought to be an important contributor to the conformational entropy changes in protein–ligand binding.85 Even large-scale motions that occur on much longer time scales are composed of smaller, faster time scale motions, and thus characterizing these motions is important for a complete understanding of protein function.
The use of the unnatural amino acid AzPhe as a VDL permitted study of dynamics in oxidized Mb, which was previously not accessible with 2D IR spectroscopy. Reduction of the heme Fe3+ to Fe2+ and binding CO to the reduced iron changes the spectrum and dynamics reported by the Az. By employing 2D IR spectroscopy, the inhomogeneous line widths could be reliably extracted from the linear absorption line shape. The data show that AzPhe43 in MbAz experiences a greater distribution in local environments than in MbAzCO. Further, this greater distribution is mostly sampled on a relatively slow time scale.
In this study we were able to investigate the motions in one protein from the perspective of two spectrally resolved VDLs: Az and CO. The use of two independent probes permitted the assessment of the influence of the each VDL on the other. In MbAzCO, both probes reported similar fast, ~1 ps dynamics, as well as very fast homogeneous dynamics, and dynamics on a much slower time scale. Experiments with very broad bandwidth pulses that encompassed the transition frequencies of both the Az and CO showed that the vibrations are not directly coupled. Thus, the two VDLs independently probe the motions of Mb, and the time scales of the dynamics reported by the VDL do not depend on its chemical nature but rather report on the motions of the protein environment.
Although some perturbation in the heme pocket environment due to incorporation of the Az was observed, the impact was relatively minor due to the small size of the Az group and the fact that the VDL is a small substituent on what would otherwise be phenylalanine – especially compared to, for example, a fluorescent chromophore. While this current study was limited by the short lifetime of the Az, the incorporation of other VDLs as unnatural amino acids should enable 2D IR experiments access to longer time scales. For example, cyano groups have previously been incorporated into proteins with the method used here and other methods21–23 and have been investigated by 2D IR spectroscopy in small molecule and peptide systems.44,86 Specific labeling with carbon deuterium bonds,28,29 while currently prohibitively weak probes for 2D IR spectroscopy, with future technical improvements could provide a completely nonperturbative VDL. The combined application of site-specific, genetically encoded VDLs and 2D IR spectroscopy promises to be a general technique for the study of dynamics, structure, and interactions at specific sites anywhere in any protein.
Supplementary Material
Acknowledgments
We thank the National Institutes of Health (2-R01-GM061137-09) for support of this research. M.C.T. also thanks the National Institutes of Health for a post doctoral fellowship (F32-GM090549). P.G.S. acknowledges the National Institute of Health (R0162159).
Footnotes
ASSOCIATED CONTENT
Supporting Information. Alternate Gaussian fit to the Az region of the MbAzCO FT-IR spectrum, FT-IR spectrum of AzPhe, full 2D IR spectrum of MbAz, and SDS-PAGE and mass spectroscopic characterization of MbAz. This material is available free of charge via the Internet at http://pubs.acs.org.
References
- 1.Hamm P, Lim M, Hochstrasser RM. J Phys Chem B. 1998;102:6123–6138. [Google Scholar]
- 2.Hamm P, Lim M, DeGrado WF, Hochstrasser RM. Proc Natl Acad Sci USA. 1999;96:2036–2041. doi: 10.1073/pnas.96.5.2036. [DOI] [PMC free article] [PubMed] [Google Scholar]
- 3.Zanni MT, Hochstrasser RM. Curr Opin Struct Biol. 2001;11:516–522. doi: 10.1016/s0959-440x(00)00243-8. [DOI] [PubMed] [Google Scholar]
- 4.Barth A, Zscherp C. Q Rev Biophys. 2002;35:369–430. doi: 10.1017/s0033583502003815. [DOI] [PubMed] [Google Scholar]
- 5.Backus EHG, Bloem R, Donaldson PM, Ihalainen JA, Pfister R, Paoli B, Caflisch A, Hamm P. J Phys Chem B. 2010;114:3735–3740. doi: 10.1021/jp911849n. [DOI] [PubMed] [Google Scholar]
- 6.Shim SH, Gupta R, Ling YL, Strasfeld DB, Raleigh DP, Zanni MT. Proc Natl Acad Sci USA. 2009;106:6614–6619. doi: 10.1073/pnas.0805957106. [DOI] [PMC free article] [PubMed] [Google Scholar]
- 7.Lin YS, Shorb JM, Mukherjee P, Zanni MT, Skinner JL. J Phys Chem B. 2009;113:592–602. doi: 10.1021/jp807528q. [DOI] [PMC free article] [PubMed] [Google Scholar]
- 8.Brewer SH, Song BB, Raleigh DP, Dyer RB. Biochemistry. 2007;46:3279–3285. doi: 10.1021/bi602372y. [DOI] [PubMed] [Google Scholar]
- 9.Fang C, Hochstrasser RM. J Phys Chem B. 2005;109:18652–18663. doi: 10.1021/jp052525p. [DOI] [PubMed] [Google Scholar]
- 10.Mukherjee P, Krummel AT, Fulmer EC, Kass I, Arkin IT, Zanni MT. J Chem Phys. 2004;120:10215–10224. doi: 10.1063/1.1718332. [DOI] [PubMed] [Google Scholar]
- 11.Torres J, Briggs JAG, Arkin IT. J Mol Biol. 2002;316:365–374. doi: 10.1006/jmbi.2001.5267. [DOI] [PubMed] [Google Scholar]
- 12.Bandaria JN, Dutta S, Nydegger MW, Rock W, Kohen A, Cheatum CM. Proc Natl Acad Sci USA. 2010;107:17974–17979. doi: 10.1073/pnas.0912190107. [DOI] [PMC free article] [PubMed] [Google Scholar]
- 13.Dutta S, Cook RJ, Houtman JCD, Kohen A, Cheatum CM. Anal Biochem. 2010;407:241–246. doi: 10.1016/j.ab.2010.08.008. [DOI] [PMC free article] [PubMed] [Google Scholar]
- 14.Hill SE, Bandaria JN, Fox M, Vanderah E, Kohen A, Cheatum CM. J Phys Chem B. 2009;113:11505–11510. doi: 10.1021/jp901321m. [DOI] [PMC free article] [PubMed] [Google Scholar]
- 15.Fayer MD. Annu Rev Phys Chem. 2009;60:21–38. doi: 10.1146/annurev-physchem-073108-112712. [DOI] [PubMed] [Google Scholar]
- 16.Fang C, Bauman JD, Das K, Remorino A, Arnold E, Hochstrasser RM. Proc Natl Acad Sci USA. 2008;105:1472–1477. doi: 10.1073/pnas.0709320104. [DOI] [PMC free article] [PubMed] [Google Scholar]
- 17.Webb LJ, Boxer SG. Biochemistry. 2008;47:1588–1598. doi: 10.1021/bi701708u. [DOI] [PubMed] [Google Scholar]
- 18.Spiro TG, Wasbotten IH. J Inorg Biochem. 2005;99:34–44. doi: 10.1016/j.jinorgbio.2004.09.026. [DOI] [PubMed] [Google Scholar]
- 19.Lim M, Hamm P, Hochstrasser RM. Proc Natl Acad Sci USA. 1998;95:15315–15320. doi: 10.1073/pnas.95.26.15315. [DOI] [PMC free article] [PubMed] [Google Scholar]
- 20.Mccoy S, Caughey WS. Biochemistry. 1970;9:2387–2392. doi: 10.1021/bi00814a001. [DOI] [PubMed] [Google Scholar]
- 21.Fafarman AT, Webb LJ, Chuang JI, Boxer SG. J Am Chem Soc. 2006;128:13356–13357. doi: 10.1021/ja0650403. [DOI] [PMC free article] [PubMed] [Google Scholar]
- 22.Schultz KC, Supekova L, Ryu YH, Xie JM, Perera R, Schultz PG. J Am Chem Soc. 2006;128:13984–13985. doi: 10.1021/ja0636690. [DOI] [PubMed] [Google Scholar]
- 23.Getahun Z, Huang CY, Wang T, De Leon B, DeGrado WF, Gai F. J Am Chem Soc. 2003;125:405–411. doi: 10.1021/ja0285262. [DOI] [PubMed] [Google Scholar]
- 24.Deiters A, Cropp TA, Mukherji M, Chin JW, Anderson JC, Schultz PG. J Am Chem Soc. 2003;125:11782–11783. doi: 10.1021/ja0370037. [DOI] [PubMed] [Google Scholar]
- 25.Kirshenbaum K, Carrico IS, Tirrell DA. ChemBioChem. 2002;3:235–237. doi: 10.1002/1439-7633(20020301)3:2/3<235::AID-CBIC235>3.0.CO;2-7. [DOI] [PubMed] [Google Scholar]
- 26.Kiick KL, Saxon E, Tirrell DA, Bertozzi CR. Proc Natl Acad Sci USA. 2002;99:19–24. doi: 10.1073/pnas.012583299. [DOI] [PMC free article] [PubMed] [Google Scholar]
- 27.Chin JW, Santoro SW, Martin AB, King DS, Wang L, Schultz PG. J Am Chem Soc. 2002;124:9026–9027. doi: 10.1021/ja027007w. [DOI] [PubMed] [Google Scholar]
- 28.Chin JK, Jimenez R, Romesberg FE. J Am Chem Soc. 2001;123:2426–2427. doi: 10.1021/ja0033741. [DOI] [PubMed] [Google Scholar]
- 29.Sagle LB, Zimmermann J, Dawson PE, Romesberg FE. J Am Chem Soc. 2004;126:3384–3385. doi: 10.1021/ja049890z. [DOI] [PubMed] [Google Scholar]
- 30.Vamvouka M, Muller W, Ludwig B, Varotsis C. J Phys Chem B. 1999;103:3030–3034. [Google Scholar]
- 31.Leone M, Cupane A, Militello V, Stroppolo ME, Desideri A. Biochemistry. 1998;37:4459–4464. doi: 10.1021/bi971878e. [DOI] [PubMed] [Google Scholar]
- 32.Yoshikawa S, Caughey WS. J Biol Chem. 1992;267:9757–9766. [PubMed] [Google Scholar]
- 33.Alben JO, Fager LY. Biochemistry. 1972;11:842–847. doi: 10.1021/bi00755a025. [DOI] [PubMed] [Google Scholar]
- 34.Oh KI, Lee JH, Joo C, Han H, Cho M. J Phys Chem B. 2008;112:10352–10357. doi: 10.1021/jp801558k. [DOI] [PubMed] [Google Scholar]
- 35.Choi JH, Oh KI, Cho MH. J Chem Phys. 2008;129:174512. doi: 10.1063/1.3001915. [DOI] [PubMed] [Google Scholar]
- 36.Taskent-Sezgin H, Chung JA, Banerjee PS, Nagarajan S, Dyer RB, Carrico I, Raleigh DP. Angew Chem, Int Ed. 2010;49:7473–7475. doi: 10.1002/anie.201003325. [DOI] [PMC free article] [PubMed] [Google Scholar]
- 37.Wang L, Xie J, Schultz PG. Annu Rev Biophys Biomol Struct. 2006;35:225–249. doi: 10.1146/annurev.biophys.35.101105.121507. [DOI] [PubMed] [Google Scholar]
- 38.Ye SX, Zaitseva E, Caltabiano G, Schertler GFX, Sakmar TP, Deupi X, Vogel R. Nature. 2010;464:1386–U1314. doi: 10.1038/nature08948. [DOI] [PubMed] [Google Scholar]
- 39.Ye SX, Huber T, Vogel R, Sakmar TP. Nat Chem Biol. 2009;5:397–399. doi: 10.1038/nchembio.167. [DOI] [PMC free article] [PubMed] [Google Scholar]
- 40.Thielges MC, Chung JK, Fayer MD. J Am Chem Soc. 2010;133:3995–4004. doi: 10.1021/ja109168h. [DOI] [PMC free article] [PubMed] [Google Scholar]
- 41.Finkelstein IJ, Ishikawa H, Kim S, Massari AM, Fayer MD. Proc Natl Acad Sci USA. 2007;104:2637–2642. doi: 10.1073/pnas.0610027104. [DOI] [PMC free article] [PubMed] [Google Scholar]
- 42.Bredenbeck J, Helbing J, Nienhaus K, Nienhaus GU, Hamm P. Proc Natl Acad Sci USA. 2007;104:14243–14248. doi: 10.1073/pnas.0607758104. [DOI] [PMC free article] [PubMed] [Google Scholar]
- 43.Chung JK, Thielges MC, Bowman SEJ, Bren KL, Fayer MD. J Am Chem Soc. 2011;133:6681–6691. doi: 10.1021/ja111009s. [DOI] [PMC free article] [PubMed] [Google Scholar]
- 44.Chung JK, Thielges MC, Fayer MD. Proc Natl Acad Sci USA. 2011;108:3578–3583. doi: 10.1073/pnas.1100587108. [DOI] [PMC free article] [PubMed] [Google Scholar]
- 45.Kim S, Chung JK, Kwak K, Bowman SE, Bren KL, Bagchi B, Fayer MD. J Phys Chem B. 2008;112:10054–10063. doi: 10.1021/jp802246h. [DOI] [PMC free article] [PubMed] [Google Scholar]
- 46.Chung HS, Khalil M, Tokmakoff A. J Phys Chem B. 2004;108:15332–15342. [Google Scholar]
- 47.Kolano C, Helbing J, Kozinski M, Sander W, Hamm P. Nature. 2006;444:469–472. doi: 10.1038/nature05352. [DOI] [PubMed] [Google Scholar]
- 48.Ishikawa H, Finkelstein IJ, Kim S, Kwak K, Chung JK, Wakasugi K, Massari AM, Fayer MD. Proc Natl Acad Sci USA. 2007;104:16116–16121. doi: 10.1073/pnas.0707718104. [DOI] [PMC free article] [PubMed] [Google Scholar]
- 49.Ishikawa H, Kwak K, Chung JK, Kim S, Fayer MD. Proc Natl Acad Sci USA. 2008;105:8619–8624. doi: 10.1073/pnas.0803764105. [DOI] [PMC free article] [PubMed] [Google Scholar]
- 50.Finkelstein IJ, Zheng J, Ishikawa H, Kim S, Kwak K, Fayer MD. Phys Chem Chem Phys. 2007;9:1533–1549. doi: 10.1039/b618158a. [DOI] [PubMed] [Google Scholar]
- 51.Finkelstein IJ, Goj A, McClain BL, Massari AM, Merchant KA, Loring RF, Fayer MD. J Phys Chem B. 2005;109:16959–16966. doi: 10.1021/jp0517201. [DOI] [PubMed] [Google Scholar]
- 52.Vojtechovsky J, Chu K, Berendzen J, Sweet RM, Schlichting I. Biophys J. 1999;77:2153–2174. doi: 10.1016/S0006-3495(99)77056-6. [DOI] [PMC free article] [PubMed] [Google Scholar]
- 53.Young TS, Ahmad I, Yin JA, Schultz PG. J Mol Biol. 2010;395:361–374. doi: 10.1016/j.jmb.2009.10.030. [DOI] [PubMed] [Google Scholar]
- 54.Merchant KA, Noid WG, Akiyama R, Finkelstein I, Goun A, McClain BL, Loring RF, Fayer MD. J Am Chem Soc. 2003;125:13804–13818. doi: 10.1021/ja035654x. [DOI] [PMC free article] [PubMed] [Google Scholar]
- 55.Park S, Kwak K, Fayer MD. Laser Phys Lett. 2007;4:704–718. [Google Scholar]
- 56.Kwak K, Park S, Finkelstein IJ, Fayer MD. J Chem Phys. 2007;127:124503. doi: 10.1063/1.2772269. [DOI] [PubMed] [Google Scholar]
- 57.Kwak K, Rosenfeld DE, Fayer MD. J Chem Phys. 2008;128:204505. doi: 10.1063/1.2927906. [DOI] [PubMed] [Google Scholar]
- 58.Merchant KA, Thompson DE, Xu QH, Williams RB, Loring RF, Fayer MD. Biophys J. 2002;82:3277–3288. doi: 10.1016/S0006-3495(02)75669-5. [DOI] [PMC free article] [PubMed] [Google Scholar]
- 59.Suydam IT, Boxer SG. Biochemistry. 2003;42:12050–12055. doi: 10.1021/bi0352926. [DOI] [PubMed] [Google Scholar]
- 60.Bagchi S, Nebgen BT, Loring RF, Fayer MD. J Am Chem Soc. 2010;132:18367–18376. doi: 10.1021/ja108491t. [DOI] [PMC free article] [PubMed] [Google Scholar]
- 61.Massari AM, Finkelstein IJ, Fayer MD. J Am Chem Soc. 2006;128:3990–3997. doi: 10.1021/ja058745y. [DOI] [PMC free article] [PubMed] [Google Scholar]
- 62.Ishikawa H, Kim S, Kwak K, Wakasugi K, Fayer MD. Proc Natl Acad Sci USA. 2007;104:19309–19314. doi: 10.1073/pnas.0709760104. [DOI] [PMC free article] [PubMed] [Google Scholar]
- 63.Frauenfelder H, Parak F, Young RD. Annu Rev Biophys Biophys Chem. 1988;17:451–479. doi: 10.1146/annurev.bb.17.060188.002315. [DOI] [PubMed] [Google Scholar]
- 64.Shimada H, Caughey WS. J Biol Chem. 1982;257:1893–1900. [PubMed] [Google Scholar]
- 65.Morikis D, Champion PM, Springer BA, Sligar SG. Biochemistry. 1989;28:4791–4800. doi: 10.1021/bi00437a041. [DOI] [PubMed] [Google Scholar]
- 66.Li TS, Quillin ML, Phillips GN, Jr, Olson JS. Biochemistry. 1994;33:1433–1446. doi: 10.1021/bi00172a021. [DOI] [PubMed] [Google Scholar]
- 67.Thielges MC, Chung JK, Axup JY, Fayer MD. Biochemistry. 2011;50:5799–5805. doi: 10.1021/bi2003923. [DOI] [PMC free article] [PubMed] [Google Scholar]
- 68.Kachalova GS, Popov AN, Bartunik HD. Science. 1999;284:473–476. doi: 10.1126/science.284.5413.473. [DOI] [PubMed] [Google Scholar]
- 69.Li T, Quillin ML, Phillips GN, Jr, Olson JS. Biochemistry. 1994;33:1433–1446. doi: 10.1021/bi00172a021. [DOI] [PubMed] [Google Scholar]
- 70.Springer BA, Sligar SG, Olson JS, Phillips GN. Chem Rev. 1994;94:699–714. [Google Scholar]
- 71.Lieber E, Rao CNR, Thomas AE, Oftedahl E, Minnis R, Nambury CVN. Spectrochim Acta. 1963;19:1135–1144. [Google Scholar]
- 72.Hill JR, Dlott DD, Rella CW, Smith TI, Schwettman HA, Peterson KA, Kwok A, Rector KD, Fayer MD. Biospectroscopy. 1996;2:277–299. [Google Scholar]
- 73.Hill JR, Rosenblatt MM, Ziegler CJ, Suslick KS, Dlott DD, Rella CW, Fayer MD. J Phys Chem. 1996;100:18023–18032. [Google Scholar]
- 74.Zhong Q, Baronavski AP, Owrutsky JC. J Chem Phys. 2003;118:7074–7080. [Google Scholar]
- 75.Li M, Owrutsky J, Sarisky M, Culver JP, Yodh A, Hochstrasser RM. J Chem Phys. 1993;98:5499–5507. [Google Scholar]
- 76.Owrutsky JC, Kim YR, Li M, Sarisky MJ, Hochstrasser RM. Chem Phys Lett. 1991;184:368–374. [Google Scholar]
- 77.Kenkre VM, Tokmakoff A, Fayer MD. J Chem Phys. 1994;101:10618–10629. [Google Scholar]
- 78.Tokmakoff A. J Phys Chem A. 2000;104:4247–4255. [Google Scholar]
- 79.Khalil M, Tokmakoff A. Chem Phys. 2001;266:213–230. [Google Scholar]
- 80.Golonzka O, Tokmakoff A. J Chem Phys. 2001;115:297–309. [Google Scholar]
- 81.Merchant KA, Noid WG, Thompson DE, Akiyama R, Loring RF, Fayer MD. J Phys Chem B. 2003;107:4–7. [Google Scholar]
- 82.Massari AM, Finkelstein IJ, McClain BL, Goj A, Wen X, Bren KL, Loring RF, Fayer MD. J Am Chem Soc. 2005;127:14279–14289. doi: 10.1021/ja053627w. [DOI] [PubMed] [Google Scholar]
- 83.Ruscio JZ, Kumar D, Shukla M, Prisant MG, Murali TM, Onufriev AV. Proc Natl Acad Sci USA. 2008;105:9204–9209. doi: 10.1073/pnas.0710825105. [DOI] [PMC free article] [PubMed] [Google Scholar]
- 84.Bourgeois D, Vallone B, Schotte F, Arcovito A, Miele AE, Sciara G, Wulff M, Anfinrud P, Brunori M. Proc Natl Acad Sci USA. 2003;100:8704–8709. doi: 10.1073/pnas.1430900100. [DOI] [PMC free article] [PubMed] [Google Scholar]
- 85.Frederick KK, Marlow MS, Valentine KG, Wand AJ. Nature. 2007;448:325–329. doi: 10.1038/nature05959. [DOI] [PMC free article] [PubMed] [Google Scholar]
- 86.Urbanek DC, Vorobyev DY, Serrano AL, Gai F, Hochstrasser RM. J Phys Chem Lett. 2010;1:3311–3315. doi: 10.1021/jz101367d. [DOI] [PMC free article] [PubMed] [Google Scholar]
Associated Data
This section collects any data citations, data availability statements, or supplementary materials included in this article.