Abstract
Background: Numerous man-made pollutants activate the aryl hydrocarbon receptor (AhR) and are risk factors for type 2 diabetes. AhR signaling also affects molecular clock genes to influence glucose metabolism.
Objective: We investigated mechanisms by which AhR activation affects glucose metabolism.
Methods: Glucose tolerance, insulin resistance, and expression of peroxisome proliferator–activated receptor-α (PPAR-α) and genes affecting glucose metabolism or fatty acid oxidation and clock gene rhythms were investigated in wild-type (WT) and AhR-deficient [knockout (KO)] mice. AhR agonists and small interfering RNA (siRNA) were used to examine the effect of AhR on PPAR-α expression and glycolysis in the liver cell line Hepa-1c1c7 (c7) and its c12 and c4 derivatives. Brain, muscle ARNT-like protein 1 (Bmal1) siRNA and Ahr or Bmal1 expression plasmids were used to analyze the effect of BMAL1 on PPAR-α expression in c7 cells.
Results: KO mice displayed enhanced insulin sensitivity and improved glucose tolerance, accompanied by decreased PPAR-α and key gluconeogenic and fatty acid oxidation enzymes. AhR agonists increased PPAR-α expression in c7 cells. Both Ahr and Bmal1 siRNA reduced PPAR-α and metabolism genes. Moreover, rhythms of BMAL1 and blood glucose were altered in KO mice.
Conclusions: These results indicate a link between AhR signaling, circadian rhythms, and glucose metabolism. Furthermore, hepatic activation of the PPAR-α pathway provides a mechanism underlying AhR-mediated insulin resistance.
Keywords: aryl hydrocarbon receptor, BMAL1, circadian rhythm, diabetes, dioxins, PPAR-α
The World Health Organization (WHO 2011) has estimated that > 300 million people worldwide suffer from type 2 diabetes; epidemiological studies identify exposure to environmental toxicants as an independent risk factor for its development (Fujiyoshi et al. 2006; Kanagawa et al. 2008). Many structurally diverse compounds function through activation of the aryl hydrocarbon receptor (AhR) to contribute to the development of diseases (Poland et al. 1985; Safe 1986; Safe et al. 1985; Sato et al. 2008; Schmidt and Bradfield 1996; Swanson 2002; Van den Berg et al. 2006). The mechanisms by which long-term AhR activation causes diabetes are currently unknown.
As a member of the PER-ARNT-SIM (PAS) domain family of transcriptional regulators, ligand-activated AhR translocates to the nucleus and heterodimerizes with AhR nuclear translocator (ARNT), leading to toxic responses (Bock 1994). This well-described signaling pathway does not account for all effects of environmental toxicants, however. Crosstalk between AhR/ARNT and other nuclear receptors also contributes to toxicant-induced diseases (Puga et al. 2009; Shimba and Watabe 2009).
AhR/ARNT and the clock proteins (circadian locomotor output cycles kaput; CLOCK) and BMAL1 [brain, muscle ARNT-like protein 1; also called Arntl (aryl hydrocarbon receptor nuclear translocator-like)] share structural similarities and exhibit diurnal changes in multiple tissues (Richardson et al. 1998). AhR activation alters circadian rhythmicity and clock gene expression (Garrett and Gasiewicz 2006). Specifically, AhR activation disrupts CLOCK/BMAL1 activity and suppresses Period1 (Per1; also called period homolog 1) expression through interactions with BMAL1 (Xu et al. 2010). Chronic AhR activation also inhibits the responsiveness of the circadian clock to changes in environmental lighting (Mukai et al. 2008). Conversely, disruption of Per1 and Per2 expression alters the AhR signaling pathway (Qu et al. 2007, 2010). Collectively, the data reveal a complex relationship between AhR signaling and clock genes.
The circadian clock is also linked to metabolism. Key metabolic proteins, such as peroxisome proliferator–activated receptor-α (PPAR-α), exhibit circadian variation. Disruption of CLOCK and BMAL1 alters glucose tolerance and regulation of key metabolism genes (Marcheva et al. 2010; Oishi et al. 2005; Turek et al. 2005). More important, circadian regulation of BMAL1 and PPAR-α is interdependent (Canaple et al. 2006). Thus, PPAR-α may represent a critical link between the circadian clock and metabolism. The effects of PPAR-α on glucose metabolism are, however, equivocal. The PPAR-α agonist fenofibrate increases insulin sensitivity and decreases glucose (Haluzik et al. 2006). In contrast, recent studies strongly associate PPAR-α signaling with insulin resistance (Bernal-Mizrachi et al. 2003; Finck and Kelly 2002).
The aggregate literature compellingly implicates PPAR-α signaling, AhR activation, and circadian clock dysfunction in the development of type 2 diabetes in humans after exposure to environmental toxicants. AhR activation affects circadian rhythmicity and expression of clock genes, which regulate PPAR-α. In the present study we investigated the involvement of BMAL1 and PPAR-α in glucose metabolism after manipulation of AhR signaling using small interfering RNA (siRNA) or AhR agonists, as well as in AhR-deficient [knockout (KO)] mice. KO mice display increased responsiveness to insulin, decreased PPAR-α expression, and altered circadian rhythm of liver genes controlling glucose and fatty acid metabolism. The growing pandemic of type 2 diabetes, in part due to exposure to environmental toxicants, remains a major challenge in human health. This study provides important insight into mechanisms by which toxicants, acting through AhR, produce type 2 diabetes.
Materials and Methods
Animals. Animals were treated humanely, with minimal suffering; animal protocols were approved by the institutional animal care committee of the Southern Illinois University School of Medicine. Male and female mice 4–24 weeks of age were used. Wild-type (WT; C57Bl/6J) and KO (Bradfield strain; Schmidt et al. 1996) littermates, obtained originally from R. Petersen (University of Wisconsin, Madison, WI, USA), were bred in our colony. Animals entrained to 12/12-hr light/dark cycles were decapitated, and livers were collected at 4-hr intervals starting at zeitgeber time (ZT) 0, the time of lights on, or ZT12, the time of lights off. Tissues were snap-frozen in liquid nitrogen and stored at –80°C until use.
Cell culture and siRNA treatment. The mouse Hepa-1c1c7 (c7), c12, and c4 liver cell lines (ATCC, Manassas, VA, USA) were cultured in DMEM (Dulbecco’s modified Eagle’s medium) Reduced Serum (HyClone, Logan, UT, USA) with 7.5% bovine growth serum (HyClone) and penicillin/streptomycin/amphotericin (MP Biomedicals, Solon, OH, USA) at 37°C in a humidified, 5% CO2 atmosphere. All culture experiments were repeated at least three times, with doses of drugs as indicated in the figures. Cultures were treated with β-napthoflavone (BNF; Sigma Chemical Co., St. Louis, MO, USA), 2,3,7,8-tetrachlorodibenzo-p-dioxin (TCDD) (L. Hansen, University of Illinois at Urbana-Champaign, Urbana, IL, USA), GW6471 (Sigma), and/or α-napthoflavone (ANF; Sigma). DMSO was the vehicle for all controls. Negative, Ahr, and Bmal1 siRNAs [50 nM; Invitrogen, Carlsbad, CA, USA; for sequences, see Supplemental Material, Table, (http://dx.doi.org/10.1289/ehp.1103593)] were delivered into cells (4.0 × 10⁴) using Lipofectamine 2000 (Invitrogen) as described previously (Wang et al. 2009).
Plasmid transfection. Mouse Bmal1 cloned into pCS2+MTK vector (from P. Sassone-Corsi, University of California–Irvine, Irvine, CA, USA) and human Ahr cloned in pcDNA3 vector (from G. Perdew, Pennsylvania State University, University Park, PA, USA) were transfected with or without siRNA into c7 cells using Lipofectamine 2000 and cultured for 48 hr.
RNA extraction and analysis. Total RNA was extracted from liver using TRI-Reagent (Sigma) according to the manufacturer’s protocol. After cDNA synthesis using Oligo(dT)15 Primer (Promega protocol; Promega, Madison, WI, USA), 5 μL cDNA (1:5 or no dilution for Ppara in cell experiments) was used for quantitative polymerase chain reaction (qPCR) using SYBR green (Quanta Biosciences, Gaithersburg, MD, USA) in a Smart Cycler rapid thermal cycler (Cepheid, Sunnyvale, CA, USA). Each assay included a no-reverse-transcriptase negative control. Primer sequences are given in the Supplemental Material, Table (http://dx.doi.org/10.1289/ehp.1103593). Relative standard curves were created for each gene primer as previously described (Xu et al. 2010); β-actin was used for normalization.
Protein extraction and analysis. Cell lines and liver tissue were harvested and homogenized in lysis buffer; total protein (80–100 μg) was separated using SDS-PAGE. Membranes were immunoblotted with antibodies to PPAR-α (1:1,000; Sigma) and AhR (1:1,000; Enzo Life Sciences, Farmingdale, NY, USA).
Glucose tolerance test (GTT) and insulin tolerance test (ITT). Studies were performed as described previously (Finck et al. 2005). The GTT and ITT were separated by at least 1 week. For the GTT, mice were injected with a 10% solution of d-glucose (1 g/kg body weight) after an overnight fast. For the ITT, mice received an intraperitoneal injection of porcine insulin (0.75 U/kg; Sigma) after a 6-hr fast. Tail blood was assayed using a TRUEtrack blood glucose meter (Nipro Diagnostics Inc., Fort Lauderdale, FL, USA).
Lactate concentration measurements. Cell medium and cell lysate were collected; lactate concentrations were measured using the L-Lactate Assay Kit for a 96-well plate (Eton Bioscience Inc., San Diego, CA, USA) according to the manufacturer’s instructions.
Statistics. We used Student’s t-test and analysis of variance for statistical analysis; p < 0.05 was considered statistically significant. All data represent mean ± SE.
Results
Insulin sensitivity in Ahr-null mice. We recorded weights of WT and KO mice monthly and found no effect of genotype on weight [see Supplemental Material, Figure 1 (http://dx.doi.org/10.1289/ehp.1103593)]. Fasting glucose levels were the same in WT and KO mice (Figure 1A). However, during GTT, glucose levels remained lower in KO mice for up to 180 min (Figure 1A). Serum insulin levels showed no significant difference between WT and KO mice at 20 min after glucose challenge (Figure 1B), suggesting that insulin release is similar in the two mouse strains. However, KO mice exhibited a larger reduction in glucose than did WT mice for up to 120 min after insulin challenge (Figure 1C), indicating enhanced insulin sensitivity in the KO mice.
Figure 1.
Glucose tolerance and insulin sensitivity in WT and KO mice. (A) GTT results for WT (n = 7) and KO (n = 4) mice. (B) Insulin levels in serum of WT (n = 4) and KO (n = 4) mice. (C) ITT results for WT (n = 8) and KO (n = 5) mice. Data are mean ± SE. *p < 0.05 compared with WT mice.
Expression of key metabolic genes in KO and WT mice. Ahr mRNA was essentially undetectable in KO mice (Figure 2A). Ppara mRNA and PPAR-α protein, which regulates fatty acid and glucose metabolism, were reduced in KO mouse liver (Figure 2B). Transcripts of the PPAR-α target genes acyl-CoA oxidase (Aco) and carnitine palmitoyl transferase 1b (Cpt1b) were decreased by 50% and 70%, respectively, in KO mice (Figure 2C). Transcripts for phosphoenolpyruvate carboxykinase (Pepck) and glucose 6-phosphatase (G6pase), which encode gluconeogenic enzymes, were also significantly reduced in the liver of KO mice (Figure 2C). In contrast, pyruvate dehydrogenase kinase, isozyme 4 (Pdk4) transcript, which encodes an inhibitor of glucose oxidation, did not change (Figure 2C).
Figure 2.
Expression of Ahr, Ppara, and metabolism genes in WT and KO mice. (A) qPCR analysis of Ahr mRNA. (B) PPAR-α protein (top; representative immunoblot from three WT and two KO animals) and Ppara mRNA (bottom) in WT and KO mice. (C) qPCR analysis of hepatic β-oxidation and gluconeogenic genes. All samples are from liver of WT (n = 8) and KO (n = 10) mice, collected at ZT8. Data are mean ± SE. *p < 0.05, **p < 0.01, and #p < 0.001 compared with WT mice.
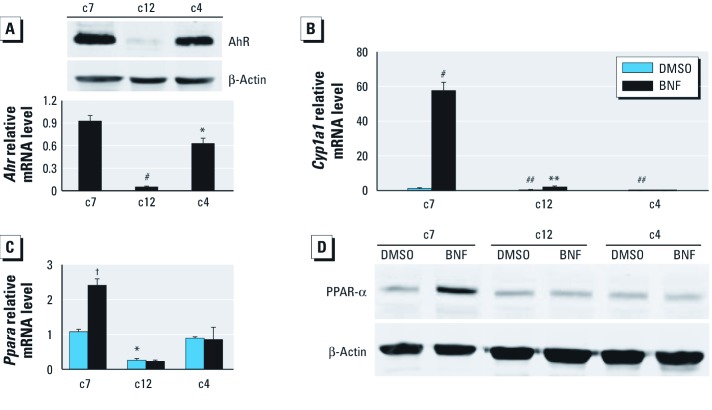
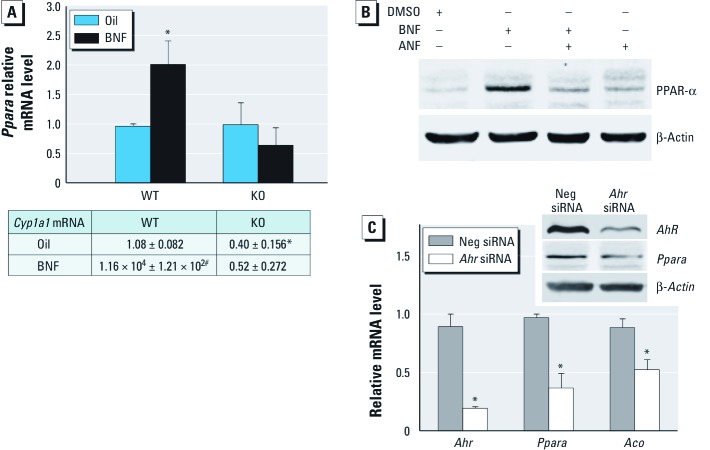
AhR/ARNT signal-pathway–dependent induction of PPAR-α. Knockout of Ppara prevents insulin resistance in mice (Guerre-Millo et al. 2001; Tordjman et al. 2001; Xu et al. 2004). We determined the role of PPAR-α in AhR-mediated changes in glucose metabolism using cell lines (c7, c12, and c4), which have been extensively used to explore AhR/ARNT signaling. c12 cells are c7 derivatives that express extremely low levels of AhR (Figure 3A) (Zhang et al. 1996). The c4 cells are c7 derivatives that lack functional ARNT (Numayama-Tsuruta et al. 1997). As expected, the AhR target gene Cyp1a1 (cytochrome P450, family 1, subfamily a, polypeptide 1) was significantly reduced in c12 and c4 cells compared with c7 cells after treatment with the AhR agonist BNF (Figure 3B). BNF induced Ppara mRNA (Figure 3C) and PPAR-α protein expression (Figure 3D) only in c7 cells (Figure 3C,D). BNF also increased Ppara mRNA levels in WT but not in KO mice (Figure 4A). Similar to results in KO mice, basal Ppara transcripts were significantly lower in c12 cells than in c7 cells (Figure 3C), and the AhR antagonist ANF blocked BNF-induced PPAR-α expression (Figure 4B). AhR silencing in c7 cells significantly decreased Ppara and Aco transcription (Figure 4C).
Figure 3.
Role of PPAR‑α in Ahr-mediated changes in c7, c12, and c4 cells treated with DMSO or 10 µM BNF. (A) AhR protein (top) and AhrmRNA (bottom). (B and C) qPCR analysis of Cyp1a1 (B) and Ppara (C). (D) Immunoblot analysis of PPAR-α protein. n = 3 for each cell type and treatment. *p < 0.05 compared with c7 cells. **p < 0.01 compared with DMSO. #p < 0.001 compared with c7 cells. ##p < 0.01 compared with c7 cells. †p < 0.05 compared with DMSO.
Figure 4.
Effect of AhR signaling on PPAR-α expression. (A) qPCR analysis of Ppara (top) and Cyp1a1 (bottom) in WT and KO mice (n = 4 each) after treatment with oil vehicle or BNF for 24 hr at ZT0. (B) Immunoblot showing PPAR-α protein in c7 cells treated with or without DMSO alone or with 10 μM BNF and/or 500 nM ANF. (C) qPCR analysis of Ahr, Ppara, and Aco in Ahr-silenced c7 cells (n = 3 each) and immunoblot of Ppara and AhR. n = 3 for each cell type and treatment. Data are mean ± SE. Neg, negative. *p < 0.05 compared with WT oil. #p < 0.001 compared with WT oil. †p < 0.05 compared with Neg siRNA.
Another AhR ligand, TCDD, also increased Ppara mRNA in c7 cells, which returned to baseline by 24 hr [see Supplemental Material, Figure 2a (http://dx.doi.org/10.1289/ehp.1103593)]. In contrast, BNF caused a sustained increase in Ppara mRNA (see Supplemental Material, Figure 2a). AhR degradation, which was significantly greater after TCDD treatment (see Supplemental Material, Figure 2b), may explain the difference between agonists. However, both TCDD and BNF induced Cyp1a1 for the full 24-hr period (see Supplemental Material, Figure 2c). Thus, AhR/ARNT signaling regulates PPAR-α expression.
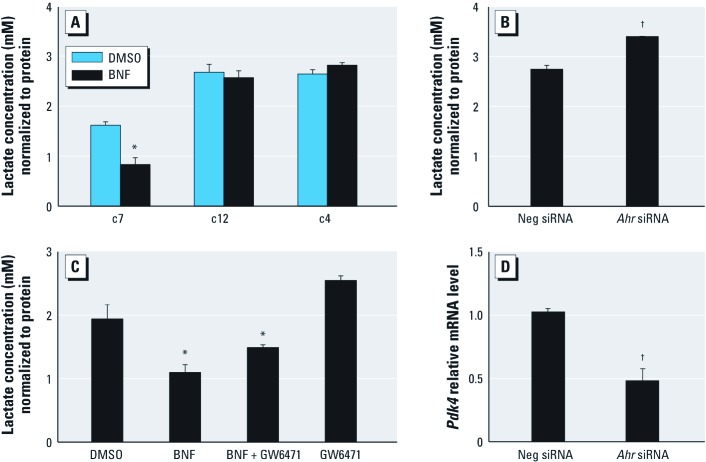
PPAR-α–dependent regulation of AhR in glucose metabolism. Increased PPAR-α in adipocytes increases fatty acid uptake and oxidation and suppresses glucose use (Finck et al. 2005; Ribet et al. 2010). Because PPAR-α levels are regulated by AhR, we examined the effect of AhR activation on glycolysis. BNF (10 μM, 48 hr) reduced intracellular lactate concentration in c7 cells but not in c12 or c4 cells (Figure 5A). Ahr silencing significantly increased lactate concentrations in c7 cells, confirming that AhR regulates glycolysis (Figure 5B). To verify the importance of PPAR-α in glycolysis, we used GW6471, a PPAR-α antagonist (Xu et al. 2002). GW6471 did not significantly alter basal levels of intracellular lactate (p = 0.0624) but attenuated the BNF-induced decrease in intracellular lactate concentration (Figure 5C). Pdk4 transcripts were decreased in Ahr-silenced c7 cells (Figure 5D).
Figure 5.
Effect of AhR activation on glycolysis. (A) Intracellular lactate concentrations in c7, c12, and c4 cells after treatment with DMSO or 10 μM BNF. (B) Lactate levels in Ahr-silenced c7 cells. (C) Lactate in c7 cells after treatment with DMSO, 10 μM BNF, 10 μM GW6471, or BNF + GW6471. (D) qPCR analysis of Pdk4 mRNA in Ahr-silenced c7 cells. Data are mean ± SE; n = 3 for each cell type and treatment. Neg, negative. *p < 0.05 compared with DMSO. †p < 0.05 compared with Neg siRNA.
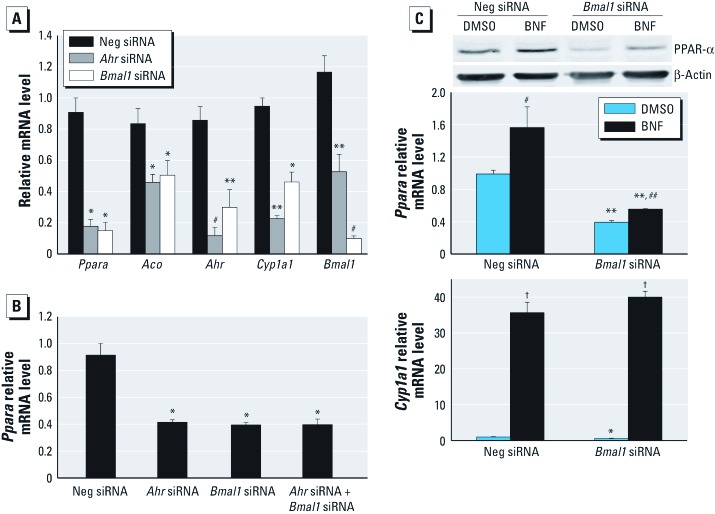
Involvement of BMAL1 in the regulation of AhR effects on PPAR-α. CLOCK/BMAL1 regulates PPAR-α expression (Oishi et al. 2005). To confirm that BMAL1 regulates PPAR-α, we silenced Bmal1 with siRNA. As expected, reduction of BMAL1 decreased PPAR-α and its target gene Aco (Figure 6A). Because BMAL1 associates with AhR (Xu et al. 2010), we examined how silencing of each affects PPAR-α expression. Interestingly, Bmal1 silencing significantly reduced Ahr mRNA and suppressed Cyp1a1 (Figure 6A). Ahr silencing also inhibited Bmal1 mRNA (Figure 6A). Simultaneous silencing of Bmal1 and Ahr was not additive (Figure 6B). Furthermore, Bmal1 silencing partially blocked PPAR-α induction by BNF (Figure 6C) but did not affect Cyp1a1 (Figure 6D), showing that BMAL1 is needed for AhR-mediated PPAR-α expression.
Figure 6.
Effect of BMAL1 on AhR-mediated Ppara expression. (A) qPCR analysis of Ppara, Aco, Ahr, Cyp1a1, and Bmal1 in Ahr- or Bmal1-silenced c7 cells (n = 4 each). (B) qPCR analysis of Ppara in c7 cells transfected with Neg, Ahr, and/or Bmal1 siRNA (n = 3 each). (C, D) qPCR analysis and immunoblot of PPAR-α (C) and CYP1A1 (D) in Bmal1-silenced and/or BNF-treated c7 cells (n = 5 each). Data are mean ± SE. Neg, negative. *p < 0.05, **p < 0.01, and #p < 0.001 compared with Neg siRNA. ##p < 0.05, †p < 0.01, compared with DMSO.
Because BMAL1 and AhR both up-regulate PPAR-α, we cotransfected Ahr siRNA and Bmal1 plasmid or Bmal1 siRNA and Ahr plasmid and measured Ppara mRNA levels. Overexpression of AhR increased Cyp1a1 mRNA levels, and Bmal1 transfection increased Bmal1 mRNA levels [see Supplemental Material, Figure 3b,c (http://dx.doi.org/10.1289/ehp.1103593)]. However, transfection of Ahr and Bmal1 plasmids did not rescue Ppara mRNA down-regulation induced by silencing either Bmal1 or Ahr (see Supplemental Material, Figure 3a).
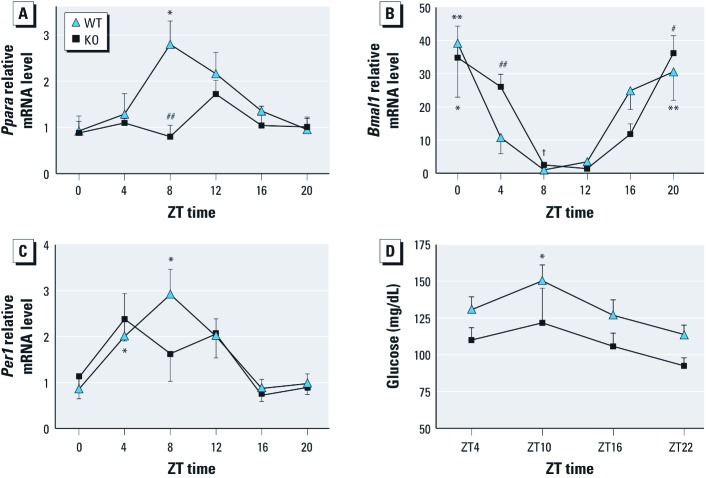
Altered circadian rhythm in KO mice. To link AhR to clock and glucose metabolism, we examined rhythms in clock and metabolic genes and blood glucose in KO mice. Ppara transcript rhythmicity in WT mice was consistent with results of a previous study (Oishi et al. 2005) but was altered in KO mice (Figure 7A); the amplitude of the Ppara rhythm was significantly blunted in KO mice. Rhythms of Bmal1 and Per1 mRNA were also slightly altered in KO mice (Figure 7B,C) specifically at ZT4 and ZT8. The rhythm of blood glucose was also attenuated (Figure 7D); glucose in KO mice was almost significantly lower than WT mice at ZT22 (p = 0.052).
Figure 7.
Effect of AhR on (A–C) circadian rhythm of Ppara (A), Bmal1 (B), and Per1 (C) expression and on (D) rhythm of blood glucose in KO and WT mice. Data are mean ± SE. For A–C, n = 5 KO mice and 4 WT mice; for D, n = 6 for each. *p < 0.05, **p < 0.01, and #p < 0.001 for peak compared with trough. ##p < 0.05 compared with WT. †p < 0.01 compared with WT.
Discussion
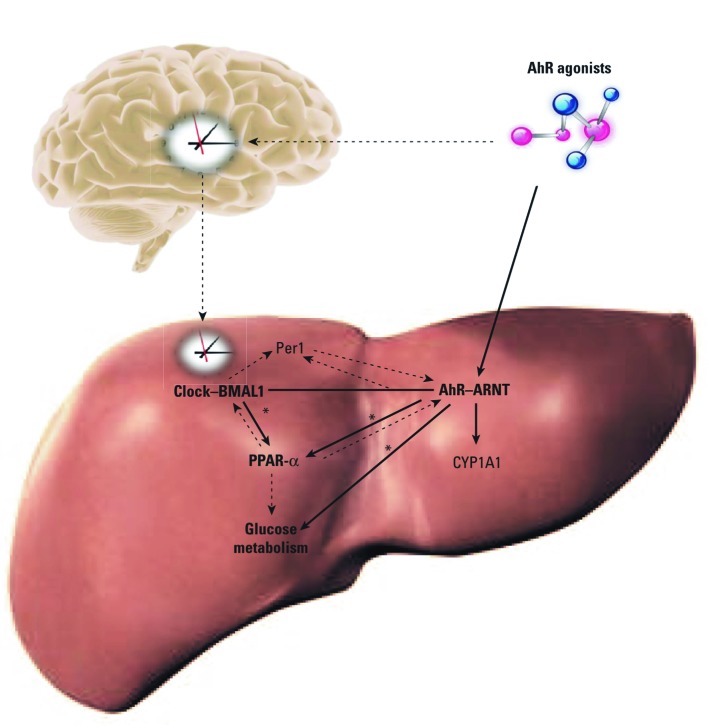
We examined the interactions of AhR with PPAR-α, glucose metabolism, and circadian rhythm in liver (Figure 8). Liver PPAR-α expression and rhythms are altered after AhR deletion, demonstrating that AhR may be an integral regulator of PPAR-α and may influence liver circadian rhythms (Figure 8, solid arrows). PPAR-α influences both BMAL1 and AhR (Canaple et al. 2006; Villard et al. 2007; see also Figure 6). PPAR-α has been associated with development of insulin resistance (Finck et al. 2005; Koo et al. 2004).
Figure 8.
Model of crosstalk among AhR, PPAR-α, and circadian pathways. AhR acts on the liver to regulate PPAR-α and affect circadian rhythms. In turn, PPAR-α influences AhR and BMAL1 levels. PPAR-α levels alter glucose metabolism and insulin sensitivity. *Results from this study.
KO mice have enhanced insulin sensitivity and improved glucose tolerance (Figure 1), accompanied by decreased expression of Ppara and metabolism genes Aco, Cpt1b, G6pase, and Pepck (Figures 2 and 4B). Long-term activation of AhR results in increased peripheral fat mobilization and decreased body fat (Lee et al. 2010). ACO and CPT1b are key enzymes regulating fatty acid β-oxidation. PPAR-α activation increases PEPCK and G6Pase expression, which causes hyperglycemia and insulin resistance (Bernal-Mizrachi et al. 2003). Collectively, these results suggest that KO mice are protected against insulin resistance. Reduced PPAR-α provides a possible mechanism for this protection.
AhR activation up-regulates Ppara when AhR signaling is intact (Figure 3C,D). BNF also stimulates Ppara expression in WT but not in KO mice (Figure 4A). Moreover, the AhR antagonist ANF blocks the BNF induction of PPAR-α (Figure 4B). Thus, PPAR-α is regulated by AhR/ARNT. Similarly, the AhR ligand 3-methylcholanthrene increases PPAR-α expression in C57Bl/6J mice (Kawano et al. 2010). In contrast, the AhR ligand Sudan III inhibits PPAR-α expression in rats and HepG2 hepatocellular liver carcinoma cells (Shaban et al. 2004). Results of those studies do not necessarily refute our findings because some AhR ligands can activate other signaling pathways (Terzuoli et al. 2010) Transgenic mice with constitutively active AhR have decreased PPAR-α levels (Lee et al. 2010). The constitutively active AhR is missing the minimal ligand-binding domain and binds only to prototypical dioxin response elements. Although AhR binding to alternative promoter elements remains underinvestigated, AhR can interfere with the BMAL1/CLOCK binding to an E-box (Xu et al. 2010). BMAL1/CLOCK also regulates PPAR-α expression through E-box elements (Oishi et al. 2005). Thus, constitutively active AhR may differ from native AhR activation.
TCDD induced Ppara mRNA in c7 cells, but Ppara returned to basal levels after 24 hr, possibly due to degradation of AhR protein after TCDD treatment [see Supplemental Material, Figure 2a,b (http://dx.doi.org/10.1289/ehp.1103593)]. However, Cyp1a1 continually increased after BNF or TCDD treatment (see Supplemental Material, Figure 2c), suggesting that mechanisms regulating Ppara and Cyp1a1 after AhR activation are different. PPAR-α activation inhibits glycolysis (Ribet et al. 2010); Ppara-null mice exhibit higher rates of glucose metabolism (Knauf et al. 2006; Walker et al. 2007). BNF inhibited glycolysis in c7 cells (Figure 5A); furthermore, the PPAR-α antagonist GW6471 blocked this inhibition (Figure 5C). AhR knockdown elevated lactate concentrations (Figure 5B) and inhibited Pdk4 mRNA levels (Figure 5D). In contrast Pdk4 mRNA levels did not change in KO mice (Figure 2C), perhaps because of compensatory mechanisms.
This study confirms that BMAL1 regulates PPAR-α. Bmal1 silencing decreases c7 Ppara and Aco (Figure 6A). Surprisingly, Ahr mRNA is also decreased after Bmal1 silencing (Figure 6A). Cyp1a1 is suppressed, indicating that BMAL1 depletion inhibits AhR (Figure 6A). Conversely, Bmal1 mRNA significantly decreases in Ahr-silenced cells (Figure 6A). Simultaneous silencing of Ahr and Bmal1 does not enhance the inhibitory effect on PPAR-α caused by AhR or BMAL1 knockdown alone (Figure 6B). In Bmal1-silenced c7 cells, the induction of PPAR-α by BNF is partially blocked (Figure 6C). Cotransfection of Ahr siRNA and Bmal1 plasmid or Bmal1 siRNA and Ahr plasmid does not rescue Ppara down-regulation induced by silencing of Ahr or Bmal1 [see Supplemental Material, Figure 3 (http://dx.doi.org/10.1289/ehp.1103593)]. Collectively, these results provide a possible mechanism for AhR and BMAL1 to regulate PPAR-α. Because PPAR-α regulates BMAL1, AhR, and CYP1A1 (Canaple et al. 2006; Seree et al. 2004; Villard et al. 2007), we speculate that the inhibitory effect of Bmal1 silencing on AhR and CYP1A1 may be mediated by PPAR-α. Similarly, the reduction in BMAL1 caused by Ahr silencing may depend on PPAR-α. AhR and PPAR-α may provide positive feedback to the liver circadian clock.
AhR and ARNT exhibit strong rhythmicity in liver (Mukai et al. 2008), but the underlying mechanism remains unclear. Disruption of Per1 and Per2 alters AhR (Qu et al. 2007). AhR activation changes the expression of liver Per1 and BMAL1. Although in KO mice Bmal1 and Per1 rhythms are only modestly altered, the diurnal variations in blood glucose and Ppara are significantly changed (Figure 7). Although fasting glucose levels did not change, KO mice showed an enhanced glucose and insulin sensitivity compared with WT mice (Figure 1A,C). Thus, AhR may regulate circadian clock output in peripheral clock systems such as the liver.
Conclusions
Glucose metabolism in KO mice is reminiscent of that in PPAR-α–deficient mice; AhR clearly regulates PPAR-α. Future studies will explore how AhR and BMAL1 regulate PPAR-α expression in other peripheral tissues, such as pancreas, muscle, and adipose. It will also be important to develop in vivo toxicant exposure models to mimic development of diabetes caused by chronic environmental pollutant exposure in humans.
The epidemic of obesity and diabetes is widely recognized as an emerging public health problem of enormous magnitude. AhR activation, although much less widely acknowledged, is also epidemiologically associated with diabetes (Bock 1994). These pollutants are ubiquitous in modern life, and their effects profoundly influence human health. Understanding the mechanisms involved in AhR-induced diabetes has the potential to revolutionize our understanding of type 2 diabetes.
Supplemental Material
Footnotes
This work was supported by National Institutes of Health grant ES017774 to S.A.T.
The authors declare they have no actual or potential competing financial interests.
References
- Bernal-Mizrachi C, Weng S, Feng C, Finck BN, Knutsen RH, Leone TC, et al. Dexamethasone induction of hypertension and diabetes is PPAR-α dependent in LDL receptor-null mice. Nat Med. 2003;9(8):1069–1075. doi: 10.1038/nm898. [DOI] [PubMed] [Google Scholar]
- Bock KW. Aryl hydrocarbon or dioxin receptor: biologic and toxic responses. Rev Physiol Biochem Pharmacol. 1994;125:1–42. doi: 10.1007/BFb0030908. [DOI] [PubMed] [Google Scholar]
- Canaple L, Rambaud J, Dkhissi-Benyahya O, Rayet B, Tan NS, Michalik L, et al. Reciprocal regulation of brain and muscle Arnt-like protein 1 and peroxisome proliferator-activated receptor α defines a novel positive feedback loop in the rodent liver circadian clock. Mol Endocrinol. 2006;20(8):1715–1727. doi: 10.1210/me.2006-0052. [DOI] [PubMed] [Google Scholar]
- Finck BN, Bernal-Mizrachi C, Han DH, Coleman T, Sambandam N, LaRiviere LL, et al. A potential link between muscle peroxisome proliferator-activated receptor-α signaling and obesity-related diabetes. Cell Metab. 2005;1(2):133–144. doi: 10.1016/j.cmet.2005.01.006. [DOI] [PubMed] [Google Scholar]
- Finck BN, Kelly DP. Peroxisome proliferator-activated receptor alpha (PPARalpha) signaling in the gene regulatory control of energy metabolism in the normal and diseased heart. J Mol Cell Cardiol. 2002;34(10):1249–1257. doi: 10.1006/jmcc.2002.2061. [DOI] [PubMed] [Google Scholar]
- Fujiyoshi PT, Michalek JE, Matsumura F. Molecular epidemiologic evidence for diabetogenic effects of dioxin exposure in U.S. Air Force veterans of the Vietnam war. Environ Health Perspect. 2006;114:1677–1683. doi: 10.1289/ehp.9262. [DOI] [PMC free article] [PubMed] [Google Scholar]
- Garrett RW, Gasiewicz TA. The aryl hydrocarbon receptor agonist 2,3,7,8-tetrachlorodibenzo-p-dioxin alters the circadian rhythms, quiescence, and expression of clock genes in murine hematopoietic stem and progenitor cells. Mol Pharmacol. 2006;69(6):2076–2083. doi: 10.1124/mol.105.021006. [DOI] [PubMed] [Google Scholar]
- Guerre-Millo M, Rouault C, Poulain P, André J, Poitout V, Peters JM, et al. PPAR-α null mice are protected from high-fat diet-induced insulin resistance. Diabetes. 2001;50(12):2809–2814. doi: 10.2337/diabetes.50.12.2809. [DOI] [PubMed] [Google Scholar]
- Haluzik MM, Lacinova Z, Dolinkova M, Haluzikova D, Housa D, Horinek A, et al. Improvement of insulin sensitivity after peroxisome proliferator-activated receptro-alpha agonist treatment is accompanied by paradoxical increase of circulating resistin levels. Endocrinology. 2006;147(9):4517–4524. doi: 10.1210/en.2005-1624. [DOI] [PubMed] [Google Scholar]
- Kanagawa Y, Matsumoto S, Koike S, Tajima B, Fukiwake N, Shibata S, et al. 2008Association of clinical findings in Yusho patients with serum concentrations of polychlorinated biphenyls, polychlorinated quarterphenyls and 2,3,4,7,8-pentachlorodibenzofuran more than 30 years after the poisoning event. Environ Health 747; doi: 10.1186/1476-069X-7-47[Online 2 October 2008] [DOI] [PMC free article] [PubMed] [Google Scholar]
- Kawano Y, Nishiumi S, Tanaka S, Nobutani K, Miki A, Yano Y, et al. Activation of the aryl hydrocarbon receptor induces hepatic steatosis via the upregulation of fatty acid transport. Arch Biochem Biophys. 2010;504(2):221–227. doi: 10.1016/j.abb.2010.09.001. [DOI] [PubMed] [Google Scholar]
- Knauf C, Rieusset J, Foretz M, Cani PD, Uldry M, Hosokawa M, et al. Peroxisome proliferator-activated receptor-alpha-null mice have increased white adipose tissue glucose utilization, GLUT4, and fat mass: role in liver and brain. Endocrinology. 2006;147(9):4067–4078. doi: 10.1210/en.2005-1536. [DOI] [PubMed] [Google Scholar]
- Koo SH, Satoh H, Herzig S, Lee CH, Hedrick S, Kulkarni R, et al. PGC-1 promotes insulin resistance in liver through PPAR-α-dependent induction of TRB-3. Nat Med. 2004;10(5):530–534. doi: 10.1038/nm1044. [DOI] [PubMed] [Google Scholar]
- Lee JH, Wada T, Febbraio M, He J, Matsubara T, Lee MJ, et al. A novel role for the dioxin receptor in fatty acid metabolism and hepatic steatosis. Gastroenterology. 2010;139(2):653–663. doi: 10.1053/j.gastro.2010.03.033. [DOI] [PMC free article] [PubMed] [Google Scholar]
- Marcheva B, Ramsey KM, Buhr ED, Kobayashi Y, Su H, Ko CH, et al. Disruption of the clock components CLOCK and BMAL1 leads to hypoinsulinaemia and diabetes. Nature. 2010;466(7306):627–631. doi: 10.1038/nature09253. [DOI] [PMC free article] [PubMed] [Google Scholar]
- Mukai M, Lin TM, Peterson RE, Cooke PS, Tischkau SA. Behavioral rhythmicity of mice lacking AhR and attenuation of light-induced phase shift by 2,3,7,8-tetrachlorodibenzo-p-dioxin. J Biol Rhythms. 2008;23(3):200–210. doi: 10.1177/0748730408316022. [DOI] [PMC free article] [PubMed] [Google Scholar]
- Numayama-Tsuruta K, Kobayashi A, Sogawa K, Fujii-Kuriyama Y. A point mutation responsible for defective function of the aryl-hydrocarbon-receptor nuclear translocator in mutant Hepa-1c1c7 cells. Eur J Biochem. 1997;246(2):486–495. doi: 10.1111/j.1432-1033.1997.00486.x. [DOI] [PubMed] [Google Scholar]
- Oishi K, Shirai H, Ishida N. CLOCK is involved in the circadian transactivation of peroxisome proliferator-activated receptor α (PPARα) in mice. Biochem J. 2005;386(pt 3):575–581. doi: 10.1042/BJ20041150. [DOI] [PMC free article] [PubMed] [Google Scholar]
- Poland A, Knutson J, Glover E. Studies on the mechanism of action of halogenated aromatic hydrocarbons. Clin Physiol Biochem. 1985;3(2–3):147–154. [PubMed] [Google Scholar]
- Puga A, Ma C, Marlowe JL. The aryl hydrocarbon receptor cross-talks with multiple signal transduction pathways. Biochem Pharmacol. 2009;77(4):713–722. doi: 10.1016/j.bcp.2008.08.031. [DOI] [PMC free article] [PubMed] [Google Scholar]
- Qu X, Metz RP, Porter WW, Cassone VM, Earnest DJ. Disruption of clock gene expression alters responses of the aryl hydrocarbon receptor signaling pathway in the mouse mammary gland. Mol Pharmacol. 2007;72(5):1349–1358. doi: 10.1124/mol.107.039305. [DOI] [PubMed] [Google Scholar]
- Qu X, Metz RP, Porter WW, Neuendorff N, Earnest BJ, Earnest DJ. The clock genes period 1 and period 2 mediate diurnal rhythms in dioxin-induced Cyp1A1 expression in the mouse mammary gland and liver. Toxicol Lett. 2010;196(1):28–32. doi: 10.1016/j.toxlet.2010.03.020. [DOI] [PMC free article] [PubMed] [Google Scholar]
- Ribet C, Montastier E, Valle C, Bezaire V, Mazzucotelli A, Mairal A, et al. Peroxisome proliferator-activated receptor-alpha control of lipid and glucose metabolism in human white adipocytes. Endocrinology. 2010;151(1):123–133. doi: 10.1210/en.2009-0726. [DOI] [PubMed] [Google Scholar]
- Richardson VM, Santostefano MJ, Birnbaum LS. Daily cycle of bHLH-PAS proteins, Ah receptor and Arnt, in multiple tissues of female Sprague-Dawley rats. Biochem Biophys Res Commun. 1998;252(1):225–231. doi: 10.1006/bbrc.1998.9634. [DOI] [PubMed] [Google Scholar]
- Safe SH. Comparative toxicology and mechanism of action of polychlorinated dibenzo-p-dioxins and dibenzofurans. Annu Rev Pharmacol Toxicol. 1986;26:371–399. doi: 10.1146/annurev.pa.26.040186.002103. [DOI] [PubMed] [Google Scholar]
- Safe S, Bandiera S, Sawyer T, Robertson L, Safe L, Parkinson A, et al. PCBs: structure-function relationships and mechanism of action. Environ Health Perspect. 1985;60:47–56. doi: 10.1289/ehp.856047. [DOI] [PMC free article] [PubMed] [Google Scholar]
- Sato S, Shirakawa H, Tomita S, Ohsaki Y, Haketa K, Tooi O, et al. Low-dose dioxins alter gene expression related to cholesterol biosynthesis, lipogenesis, and glucose metabolism through the aryl hydrocarbon receptor-mediated pathway in mouse liver. Toxicol Appl Pharmacol. 2008;229(1):10–19. doi: 10.1016/j.taap.2007.12.029. [DOI] [PubMed] [Google Scholar]
- Schmidt JV, Bradfield CA. Ah receptor signaling pathways. Annu Rev Cell Dev Biol. 1996;12:55–89. doi: 10.1146/annurev.cellbio.12.1.55. [DOI] [PubMed] [Google Scholar]
- Schmidt JV, Su GH, Reddy JK, Simon MC, Bradfield CA. Characterization of a murine AhR null allele: involvement of the AhR receptor in hepatic growth and development. Proc Natl Acad Sci USA. 1996;93(13):6731–6736. doi: 10.1073/pnas.93.13.6731. [DOI] [PMC free article] [PubMed] [Google Scholar]
- Seree E, Villard PH, Pascussi JM, Pineau T, Maurel P, Nguyen QB, et al. Evidence for a new human CYP1A1 regulation pathway involving PPAR-alpha and 2 PPRE sites. Gastroenterology. 2004;127(5):1436–1445. doi: 10.1053/j.gastro.2004.08.023. [DOI] [PubMed] [Google Scholar]
- Shaban Z, El-Shazly S, Abdelhady S, Fattouh I, Muzandu K, Ishizuka M, et al. Down regulation of hepatic PPAR α function by AhR ligand. J Vet Med Sci. 2004;66(11):1377–1386. doi: 10.1292/jvms.66.1377. [DOI] [PubMed] [Google Scholar]
- Shimba S, Watabe Y. Crosstalk between the AHR signaling pathway and circadian rhythm. Biochem Pharmacol. 2009;77(4):560–565. doi: 10.1016/j.bcp.2008.09.040. [DOI] [PubMed] [Google Scholar]
- Swanson HI. DNA binding and protein interactions of the AHR/ARNT heterodimer that facilitate gene activation. Chem Biol Interact. 2002;141(1–2):63–76. doi: 10.1016/s0009-2797(02)00066-2. [DOI] [PubMed] [Google Scholar]
- Terzuoli E, Puppo M, Rapisarda A, Uranchimeg B, Cao L, Burger AM, et al. Aminoflavone, a ligand of the aryl hydrocarbon receptor, inhibits HIF-1alpha expression in an AhR-independent fashion. Cancer Res. 2010;70(17):6837–6848. doi: 10.1158/0008-5472.CAN-10-1075. [DOI] [PMC free article] [PubMed] [Google Scholar]
- Tordjman K, Bernal-Mizrachi C, Zemany L, Weng S, Feng C, Zhang F, et al. PPARα deficiency reduces insulin resistance and atherosclerosis in apoE-null mice. J Clin Invest. 2001;107(8):1025–1034. doi: 10.1172/JCI11497. [DOI] [PMC free article] [PubMed] [Google Scholar]
- Turek FW, Joshu C, Kohsaka A, Lin E, Ivanova G, McDearmon E, et al. Obesity and metabolic syndrome in circadian Clock mutant mice. Science. 2005;308(5724):1043–1045. doi: 10.1126/science.1108750. [DOI] [PMC free article] [PubMed] [Google Scholar]
- Van den Berg M, Birnbaum LS, Denison M, De Vito M, Farland W, Feeley M, et al. The 2005 World Health Organization reevaluation of human and mammalian toxic equivalency factors for dioxins and dioxin-like compounds. Toxicol Sci. 2006;93(2):223–241. doi: 10.1093/toxsci/kfl055. [DOI] [PMC free article] [PubMed] [Google Scholar]
- Villard PH, Caverni S, Baanannou A, Khalil A, Martin PG, Penel C, et al. PPARα transcriptionally induces AhR expression in Caco-2, but represses AhR pro-inflammatory effects. Biochem Biophys Res Commun. 2007;364(4):896–901. doi: 10.1016/j.bbrc.2007.10.084. [DOI] [PubMed] [Google Scholar]
- Walker CG, Sugden MC, Gibbons GF, Holness MJ. Peroxisome proliferator-activated receptor alpha deficiency modifies glucose handling by isolated mouse adipocytes. J Endocrinol. 2007;193(1):39–43. doi: 10.1677/JOE-06-0205. [DOI] [PubMed] [Google Scholar]
- Wang C, Yan R, Luo D, Watabe K, Liao DF, Cao D. Aldo-keto reductase family 1 member B10 promotes cell survival by regulating lipid synthesis and eliminating carbonyls. J Biol Chem. 2009;284(39):26742–26748. doi: 10.1074/jbc.M109.022897. [DOI] [PMC free article] [PubMed] [Google Scholar]
- WHO (World Health Organization) Diabetes. Fact Sheet No. 312. 2011. Available: http://www.who.int/mediacentre/factsheets/fs312/en/ [accessed 3 November 2011]
- Xu CX, Krager SL, Liao DF, Tischkau SA. Disruption of CLOCK-BMAL1 transcriptional activity is responsible for aryl hydrocarbon receptor-mediated regulation of Period1 gene. Toxicol Sci. 2010;115(1):98–108. doi: 10.1093/toxsci/kfq022. [DOI] [PMC free article] [PubMed] [Google Scholar]
- Xu HE, Stanley TB, Montana VG, Lambert MH, Shearer BG, Cobb JE, et al. Structural basis for antagonist-mediated recruitment of nuclear co-repressors by PPARalpha. Nature. 2002;415(6873):813–817. doi: 10.1038/415813a. [DOI] [PubMed] [Google Scholar]
- Xu J, Chang V, Joseph SB, Trujillo C, Bassilian S, Saad MF, et al. Peroxisomal proliferator-activated receptor alpha deficiency diminishes insulin-responsiveness of gluconeogenic/glycolytic/pentose gene expression and substrate cycle flux. Endocrinology. 2004;145(3):1087–1095. doi: 10.1210/en.2003-1173. [DOI] [PubMed] [Google Scholar]
- Zhang J, Watson AJ, Probst MR, Minehart E, Hankinson O. Basis for the loss of aryl hydrocarbon receptor gene expression in clones of a mouse hepatoma cell line. Mol Pharmacol. 1996;50(6):1454–1462. [PubMed] [Google Scholar]
Associated Data
This section collects any data citations, data availability statements, or supplementary materials included in this article.


