Abstract
There is interest to expand the reach of literature mining to include the analysis of biomedical images, which often contain a paper’s key findings. Examples include recent studies that use Optical Character Recognition (OCR) to extract image text, which is used to boost biomedical image retrieval and classification. Such studies rely on the robust identification of text elements in biomedical images, which is a non-trivial task. In this work, we introduce a new text detection algorithm for biomedical images based on iterative projection histograms. We study the effectiveness of our algorithm by evaluating the performance on a set of manually labeled random biomedical images, and compare the performance against other state-of-the-art text detection algorithms. In this paper, we demonstrate that a projection histogram-based text detection approach is well suited for text detection in biomedical images, with a performance of F score of .60. The approach performs better than comparable approaches for text detection. Further, we show that the iterative application of the algorithm is boosting overall detection performance. A C++ implementation of our algorithm is freely available through email request for academic use.
Keywords: Text detection, histogram analysis for text detection, pivoting and iterative text region detection, biomedical image mining
1. Background
1.1. Introduction
Biomedical literature mining is concerned with transforming free text into a structured, machine-readable format, to improve tasks such as information retrieval and extraction. Recent work indicates that there is much interest to also consider image information when mining research articles, as images often depict the results of experiments, and sum up a paper’s key findings. There are several obstacles when mining image information. First, there are many different types of images, such as graphs, gel electrophoresis and microscopy images, diagrams or heat maps. There exists no image publication standard, neither with regard to image resolution, or image file format (images are stored at different resolutions, and in a variety of file formats, such as jpeg, tiff etc). Also, there are no explicit image design guidelines, even though authors seem to follow some universally accepted norms when creating figures such as box plots, heatmaps or gel electrophoresis images.
A unifying element across all biomedical images is image text, i.e. text characters that are embedded in images. Text in images serves several purposes, such as labeling a graph, representing genes in a heat map images, or proteins in a pathway diagram. We have previously shown that extracting image text, and making it available to image search, improves biomedical image retrieval [1]. In this work, we are concerned with optimizing the performance of a critical step in image text extraction — locating text regions in images, which is known as text detection in studies on image processing and Optical Character Recognition (OCR).
Generally speaking, text detection is a crucial step in processing textual information in biomedical images. For example, properly finding the text regions is the first stage of a standard OCR pipeline for extracting image text. Determining the location of text is also important for high-level image content understanding, as it is the text location that indicates the meaning of certain image text element, such as the label of the x-versus y-axis in a graph. Practical applications aside, in this paper, we are exclusively concerned with optimizing the performance of text detection, which is a fundamental research problem in image text processing.
In this paper, we introduce a new text detection algorithm suited for biomedical images. We also discuss the methodological details in creating a gold standard biomedical image text detection corpus, and the use of the corpus for evaluating the performance of our algorithm. During the development of the corpus, we laid down clear guidelines on what exactly constitutes an image text region (or element) and how to manually mark the image region linked to the string. We then compared our algorithm against three existing state-of-the-art text detection methods. The evaluation results suggest the advantages of our algorithm for detecting text regions in biomedical images.
1.2. Related Work
1.2.1. Image Text Detection Algorithms
First, we are going to briefly look at prior work on image processing algorithms for image text detection, which is concerned with separating image text elements from other elements in an image. [2] presented an algorithm for text detection from scene images. In their work, they first detect character components according to gray-level differences and then match the results to standard character patterns captured in a database. Their method is very robust to the font, size and intensity variation in the image texts, but is not able to deal with color and orientation changes. To address the text detection problem for color images, [3] introduced a connected component-based method for locating texts in a complex color image. Their method analyzes the color histogram of the RGB space to detect text regions. [4] introduced a neural network based approach for identifying text in color images. To attack the text detection problem for texts with different orientations and other distortions, [5] describe the use of low level image features such as density and contrast to detect image texts, with the ability to deal with skew in the image text. [6] also proposed a morphological approach for image text detection, which is robust to the presence of noise, text orientation, skew and curvature.
There is a body of work using advanced texture and graph segmentation methods to detect text in images. For example, [7] introduce a method for learning texture discrimination masks for image text detection. [8] used a learning based approach to detect image text through image texture analysis. [9] introduced a system for image text detection and recognition, which adopts a multi-scale texture segmentation scheme. In their method, a collection of second-order Gaussian derivatives are used to detect candidate text regions, followed by a K-means clustering process and a multi-resolutional stroke generation, filtering and aggregation process to further refine the detected text region. [10] proposed a graph-based image segmentation algorithm for efficiently separating textual elements from graphical elements in an image. Their algorithm can automatically adapt itself to the image structure variation. [11] proposed a novel method for text detection and segmentation through using stroke filters for text polarity assessment in analyzing features in local image regions.
There also exists a growing collection of work on text detection from videos or motion images, which are closely related to the image text detection problem studied in this paper. For example, [12] used a hybrid neural network and projection profile analysis based approach to detect and track text regions in a video. [13] applied a variety of text detection methods and then fused the individual text detection results together to achieve a robust text detection for videos. [14] introduced a support vector machine based approach for image text detection in videos. [15] proposed a coarse-to-fine localization scheme for detecting texts in multilingual videos. Recently, [16] proposed a discrete cosines transform coefficients based method for text detection in compressed videos. Despite the many commonalities between the video text and image text detection problems, one of the main differences between them is that frame images in a video demonstrate temporal coherence, which offer much useful information for text detection. Such clues are not present in still images, and hence make the image text detection problem more challenging than its counterpart in videos.
1.2.2. Biomedical Image Processing Algorithms and Systems
Our study is related to other projects in biomedical image processing. For example, [17] used image features for text categorization. [18] studied the use of natural language processing to index and retrieve molecular images. [19] described an algorithmic system for accessing fluorescence microscopy images via image classification and segmentation.
In our own prior work [1], we discussed a novel approach for biomedical image search based on OCR. We have shown that the approach offers additional advantages compared to searching over image captions alone, notably the retrieval of additional and relevant images. The current study is closely linked to that project, discussing the algorithmic details for detecting image text regions.
2. Approach
2.1. Overview
An overview of our method is shown in Figure 1. An input image (i.e. an image from a biomedical publication) undergoes detection of layout lines and panel boundaries, which are excluded from the image to increase text detection robustness. We implement the algorithm proposed by [20] for detecting these layout elements. The image is then converted to black and white, and subjected to an edge detection algorithm. The resulting edge image is then subjected to a pivoting text region detection (PTD) algorithm for extraction of text regions. PTD is repeated several times, in order to divide detected text regions into text subregions. If no more text regions are detected, the algorithm exits. Our algorithm is based on traditional histogram analysis-based text region detection, which takes edge images as input. We extend the traditional approach as follows: We perform a pivoting procedure while applying the histogram analysis, and repeat the procedure until no more text (sub)regions are detected.
Figure 1.
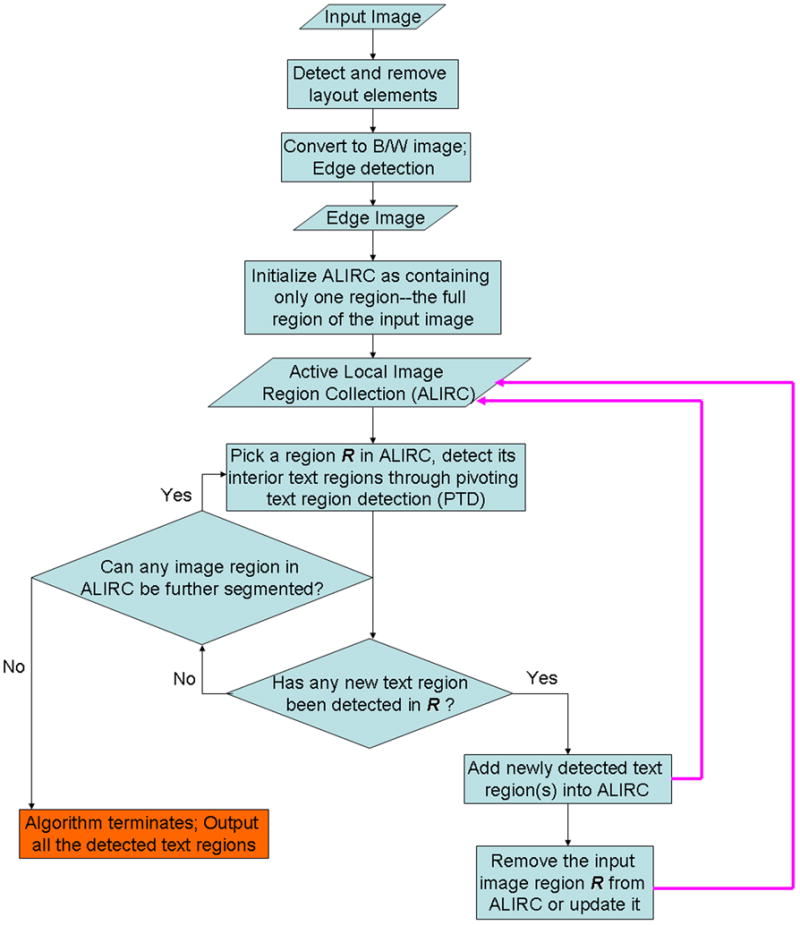
Diagram illustrating the overall procedure of our new text detection algorithm.
2.2. Traditional Histogram Analysis-based Text Region Detection
One of the most popular and well known text region detection methods is through analyzing the vertical and horizontal projection histograms of an image. More concretely, given an input image, we first detect the edge pixels in the image. Then a vertical and a horizontal projection histogram are derived. It is assumed that text regions generally exhibit higher density of edge pixels than non-text regions. The vertical and horizontal histograms will thus show the highest density of edge pixels in text areas. A density threshold defines the exact dimensions of the text area along the vertical and horizontal histogram. The elements of this basic procedure are discussed in more detail in the next section.
One distinct feature of many biomedical images is that they often employ a distributed and nested text layout. Figure 3.(a) and Figure 4.(a) show two typical examples, where text is distributed across many different image regions. Also, text regions often display some degree off nestedness. For example, the numbers along the x axis in Figure 4.(b) can be grouped in one large text area, or -more correctly-into separate (inner) text areas surrounding each individual number (Figure 4.(d)). The traditional histogram-based analysis technique does not cope well with distributed and nested text layout. To address this problem, we introduce a new iterative pivoting histogram analysis procedure for text region detection.
Figure 3.
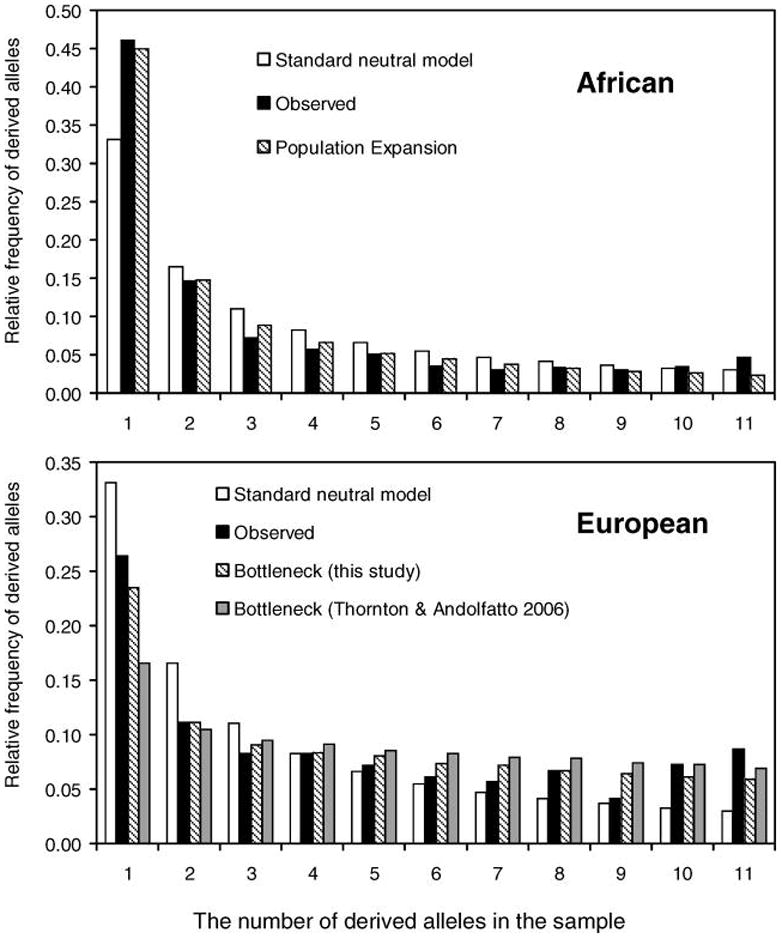
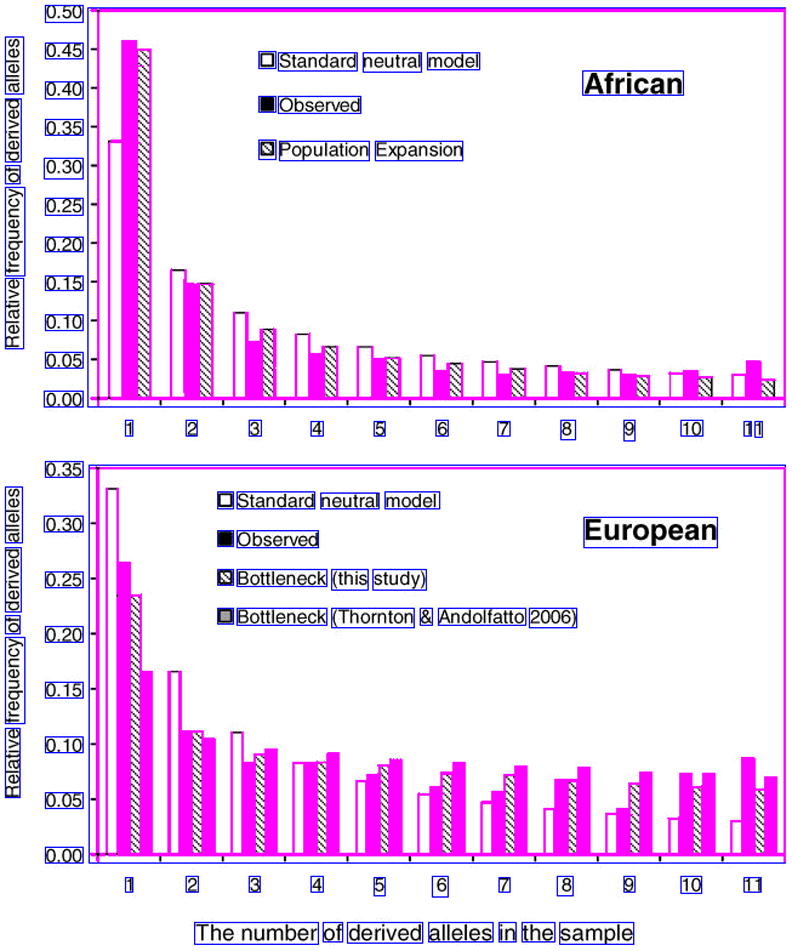
A text detection example produced by our algorithm along with the original image. Image from [26].
Figure 4.
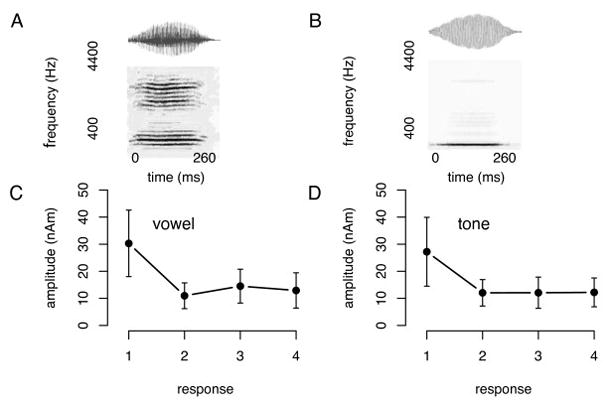
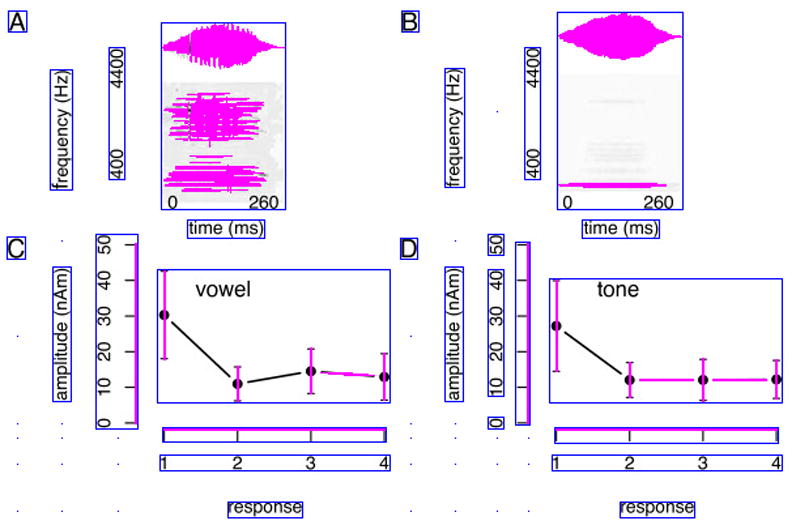
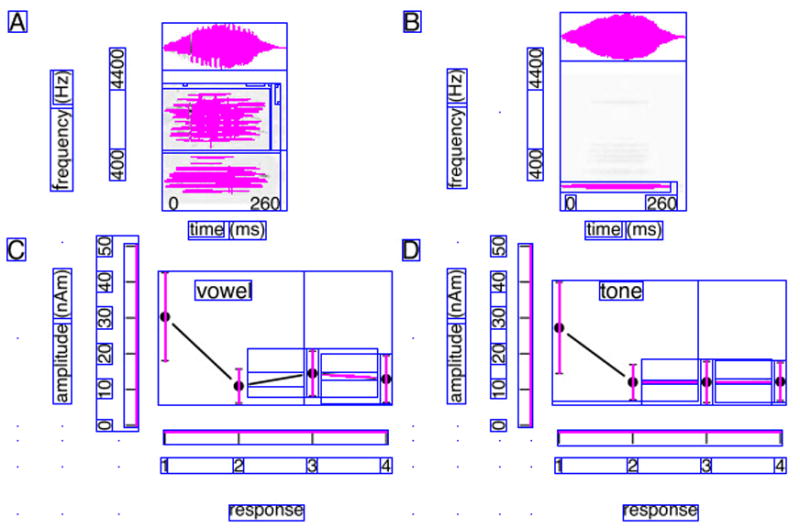
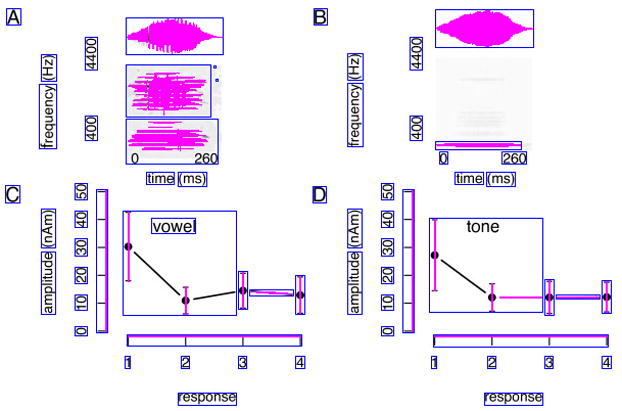
Text detection example with intermediate step-by-step text detection results. Image from [27].
2.3. Pivoting Text Region Detection (PTD)
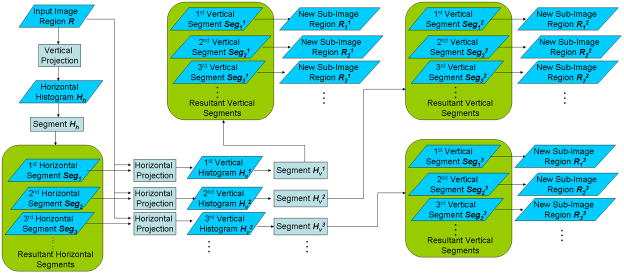
We introduce a pivoting step into the classical histogram-based text detection algorithm in order to account for the distributed nature of biomedical image text. The pivoting procedures subdivides image regions into its text subcomponents, instead of identifying large text blocks. Our procedure is realized through analyzing the histograms of the input image region following the vertical and horizontal directions alternatively, hence the name “pivoting”. Figure 2 illustrates the key steps, and Figure 1 in Appendix B (Supplementary Files) shows the working of the algorithm on a sample image. An input image is converted into black and white and subjected to edges detection (Figure 1.d, Appendix B). For a specified region
 (the whole image in the first iteration of the procedure), to detect text areas in
 , we first vertically project all the edge pixels to derive the image region’s horizontal histogram
 (Figure 1.e, Appendix B). We then segment the horizontal histogram into several segments, each corresponding to a horizontal region in the input image, denoted as Seg1, Seg2, ···. The segments are defined by a threshold on the histogram densities. We then derive for each horizontal segment a vertical histogram through horizontally projection of all the edge pixels in the region. (This step is different from the traditional approach, where the horizontal projection is performed on the whole image). The resultant vertical histogram corresponding to the horizontal segment Segi of the image is denoted as
(Figure 1.g, Appendix B). We then segment the vertical histogram
the vertical segments
, ··· using a threshold on the densities (Figure 1.g1–3, Appendix B). Each such segment corresponds to a vertical region in the input image. Through pairing of a vertical segment
with its corresponding horizontal segment Segi, we are able to specify a rectangular region (bounding box)
in
 (Figure 1.h1–3, Appendix B), corresponding to text regions.
Figure 2.
Diagram illustrating one step of the PTD algorithm (Sec. 2.3).
In Appendix A (Supplementary Files), we formally describe this procedure mathematically.
2.4. Iterative PTD Procedure
Our algorithm iteratively constructs vertical and horizontal histograms to find nested text regions. As can be seen in Figure 1.h2, Appendix B, the first round of the PTD algorithm could not resolve the true text areas of the image region. In the image, region 1 groups distinct image text elements, and we propose to repeat the PTD step for separating these elements.
More concretely, our algorithm maintains an active local image region collection (ALIRC) during its running time (Figure 1, main paper). Initially, the collection contains a single image region, which is the full image area of the input image. The algorithm then constructs pivoting vertical and horizontal histograms (see previous section) and detects text regions. Each detected text region is regarded as a new target region and added into ALIRC. The input image region is removed from ALIRC, with one exception: if, after subtracting the text regions from the input image, the input image is nonempty, we populate ALIRC with an updated version of the input image, with the text areas subtracted. We iteratively apply our histogram-based text region segmentation procedure on all the image regions in the ALIRC until no more finer separation between text and non-text regions can be achieved. We will then output all the image regions maintained in the ALIRC. A final heuristic removes regions that are maintained in ALIRC but do not correspond to text regions. The heuristic evaluates the overall edge density, removing regions that exhibit a density that is too low or too high.
2.5. Formal Description of the Iterative PTD Procedure
Assuming the height and width of the input image is h and w respectively, we apply our pivoting text detection algorithm introduced in Sec. 2.3 to detect all the text regions in the full area of the input image. That is, we apply the PTD procedure onto
 with the text detection scope being
 = (0, w, 0, h). We further assume the set of regions segmented from the input image are φ= {
 ,
,
 , ···,
 } where each
 specifies the scope of a rectangular image region resulting from the PTD process. We call φ the current active local image region collection.
-
For each image region
 in φ(i = 1, ···, n), we apply the PTD procedure onto
 to further separate the text and non-text areas inside the region on a finer granularity. Assume this new round of text region detection produces k sub image regions, which are denoted as
respectively. Given such text and non-text region segmentation result, we first remove from φ the input region
 . And then we add all the resultant sub image regions
into φ. Lastly, we also add into φ the smallest rectangular region that covers all the edge pixels belonging to the original input region
 but falling outside all the newly detected image regions
.
but falling outside all the newly detected image regions
.We repeat the above process to recursively refine every image region maintained in the current active local image region collection φ until φ can be no longer changed through additional calls of our PTD procedure. We then output all the image regions in the final stage of the image region collection φ which are determined as text regions by our PTD process. These image regions constitute our final text region detection result for the input image
 .
.
In Appendix B (Supplementary Files), we show a step-by-step example of text region detection using our iterative and pivoting text detection algorithm for a biomedical image.
Appendices C and D (Supplementary Files) contain further examples of text detection results after applying our iterative PTD algorithm on biomedical images.
3. Evaluation Method
In this section, we will first discuss the creation of a gold standard biomedical image text detection corpus. We will then discuss our evaluation strategy to measure the performance of our iterative PTD algorithm for detecting text regions in biomedical images.
3.1. Creation of a Gold Standard Biomedical Image Text Detection Corpus
To objectively evaluate the performance of our algorithm, and to quantitatively compare the performance of our method top other peer methods, we created a gold standard corpus of biomedical images with manual markup of text regions. In order to create this corpus, we selected a two step approach. The first step dealt with the identification of the text regions in the image. We set up guidelines for manual identification of text regions (image text) in biomedical images, which are listed in Table 1. The guidelines define the nature of an image text region in a biomedical image, what to do about Greek letters and other special characters, and strings in super or subscript. After selecting 161 random images from biomedical articles indexed in PubMed Central, we used the guidelines to identify the image text regions. In the second step, we identified a minimum rectangular region (bounding box) for each detected text region. Such a bounding box is defined as the smallest rectangular region covering all character pixels of the text region. These image bounding boxes represent the gold standard image text regions.
Table 1.
Guidelines for manual identification of image text regions.
|
3.2. Evaluation Strategy
To evaluate the performance of our PTD text detection algorithm, we can proceed as follows: We compare the predicted text region bounding boxes with the bounding boxes of the gold standard corpus. In our study, we employ two approaches for measuring the degree of overlap between the predicted and gold standard text regions, looking at both the pixel overlap and the percentage of shared region.
3.2.1. Measuring Recall, Precision and F-rate from Shared Pixels
One approach for measuring the overlap of two text detection results is to measure the recall, precision and F-rate as determined by shared pixels. More concretely, recall is defined as the fraction of pixels in the gold standard text area that are contained in the (algorithmically) detected text region. Precision is defined as the fraction of pixels in the detected text region that are also contained in the groundtruth text area. And F-rate is defined as the harmonic mean of precision and recall, i.e. F-rate = 2 Precision Recall=(Precision + Recall).
3.2.2. Measuring Modulated Overlapping Area
Another intuitive measure of overlap between two text detection results is to calculate the overlapping area modulated by the reciprocal of the area of the union of the two text detection results. Mathematically, this measurement can be formulated as:
| (1) |
In the above, Text Regiongroundtruth stands for text region in the gold standard corpus and Text Regionalgorithm stands for the algorithmically detected text region. The operator Area(X) computes the area of the region X in pixels. The range of the Modulated Overlapping Area (MOA) measurement as defined above is between 0 and 1. When Text Regiongroundtruth fully agrees with Text Regionalgorithm, MOA reaches the maximum value of 1. When Text Regiongroundtruth is entirely disjoint from Text Regionalgorithm, MOA reaches the minimum value of 0.
4. Results
4.1. Text Detection Performance in Biomedical Images
We start with a qualitative assessment on the performance of our text detection algorithm. To this end, we provide sample images along with automatically detected text regions (Figures 3 and 4). The blue boxes outline the detected text regions, while the purple lines and areas indicate non-textual elements. A qualitative assessment of our approach is helpful for identifying the strength and weaknesses of our algorithm. For example, we see satisfactory text detection performance in Figure 3.(b). However, two strings “the” and “number” in the bottom horizontal label of the image are mistakenly detected as one single text region “the number”. In Figure 4, we show the intermediate text detection results of two rounds of the PTD algorithm, from which we can see that our algorithm progressively refines its text detection results.
4.2. Quantitative Evaluation and Performance Comparison with Peer Text Detection Algorithms
To explore the effectiveness and advantages of our approach, we also compare the performance of our algorithm with a few state-of-the-art text detection algorithms. To this end, we identified recently published algorithms for text detection, including the DCT feature based text detection method proposed by [21], the text particle based multi-band fusion method for text detection as proposed by [22], the visual saliency based and biologically inspired text detection method proposed by [23], and the fast text detection method proposed by [24]. We also implemented two simplified version of our algorithm to study the different components of our procedure. To distinguish between these different versions of our algorithm, we call the iterative text detection method introduced in Sec. 2.4 the multistep method, which is denoted as “multiple steps”. We also study the performance of our method when the number of iterations is limited to one round. We call this modification of our algorithm the one step iteration version, denoted as “one step”. Finally, we also implemented the classical histogram-based analysis without pivoting where the vertical histogram is derived for the full image rather than for the segments from the horizontal histogram (see Sec. 2.2). We refer to this naive version as “naive”.
The results of these evaluations are shown in Table 2. We observe the following: The naive method outperforms the other peer methods in terms of F-rate and MAO. The pivoting procedure improves upon the naive version, with a performance increase of 0.045 F rate and .051 MAO. The iterative procedure further improves upon the pivoting result, both in terms of F-rate and MAO. There is no performance increase when conducting more than 2 iterations of our algorithm.
Table 2.
Performance comparison between different text detection methods
| (a) Performance of four existing text detection methods. | ||||
|---|---|---|---|---|
| Measurement | Existing Methods | |||
| [21] | [22] | [23] | [24] | |
| Precision | 0.291 | 0.110 | 0.116 | 0.457 |
| Recall | 0.980 | 0.464 | 0.528 | 0.210 |
| F-rate | 0.418 | 0.154 | 0.158 | 0.256 |
| MOA | 0.263 | 0.084 | 0.091 | 0.125 |
| (b) Performance of our new text detection method. | ||||
|---|---|---|---|---|
| Measurement | Our Method | |||
| Naive | One step | Two steps | Multiple steps | |
| Precision | 0.528 | 0.598 | 0.637 | 0.637 |
| Recall | 0.626 | 0.655 | 0.672 | 0.670 |
| F-rate | 0.519 | 0.564 | 0.600 | 0.600 |
| MOA | 0.332 | 0.383 | 0.430 | 0.429 |
5. Discussion
5.1. Iterative PTD Algorithm Performance
Our evaluation showed that the iterative PTD algorithm performs well on the gold standard text detection corpus (Table 2). The naive (classical) version is outperformed by the pivoting algorithm, which performs the vertical histogram on each image text segment as determined by the horizontal histogram (Section 2.3 and Figure 2). The pivoting algorithm subdivides image text regions into subcomponents, instead of identifying large text blocks as in the naive or classical approach. This subdivision into smaller units seems to cope better with the distributed nature of the biomedical image text. The iterative application of our algorithm results in further performance gains. As discussed, iteration ensures the detection of nested image regions. As can bee seen in Table 2, performance seems to stabilize after one iteration. This can be understood as follows: Biomedical images seem to contain (on average) one level of text nesting, which can be recovered by one iteration of our PTD algorithm.
5.2. Comparison with Prior Work in Text Detection in Images
We conducted an extensive comparison with existing text detection algorithms. None of the tested algorithms were able to outperform the histogram-based text detection approach. It should be noted that these algorithms are optimized for a particular text detection task, which might be different from the one encountered in biomedical images. Consequently, the performance of these algorithms as presented in the literature is higher than the numbers presented in Table 2. Our results indicate that we can not use these algorithms on biomedical images without major modifications.
For comparison, we quickly review the performance of the tested algorithms on other image sets. In [21], the author reports algorithm performance for two typical settings of his algorithm–a low frequency mode and a high frequency mode. The evaluation is performed on the ICDAR-set, which is from the TrialTrain data used in the ICDAR 2003 Robust Reading Competition, see [25]. For the low frequency mode, the average precision, recall and F-rate of his algorithm is 32.6%, 91.9%, and 43.4% respectively. For the high frequency mode, the average precision, recall and F-rate is 35.6%, 88.6%, and 45.1% respectively. It should be noted that the [21] algorithm performs well on our gold standard corpus in terms of recall. Precision is low, though, indicating many falls positive calls.
[22] evaluated their method on the Location Detection Database of IC-DAR 2003 Robust Reading Competition Dataset, see [25]. The precision, recall and F-rate on the dataset is 60%, 81%, 69% respectively. Finally, [24] reported the performance of their algorithm on an image set consisting of 308 images from the Web, recorded broadcast videos, and digital videos. The reported a recall and accuracy of 91.1% and 95.8% respectively.
6. Conclusions
Biomedical image search and mining is becoming an increasingly important topic in biomedical informatics. Accessing the biomedical literature via image content is complementary to text-based search and retrieval. A key element in unlocking biomedical image content is to detect and extract (via OCR) text from biomedical images, and making the text available for image search. In this paper, we are concerned with text detection, i.e. finding the precise areas of image text elements. We propose a new text detection algorithm which is ideally suited for this purpose. The key feature of our algorithm is that it searches for text regions in a pivoting and iterative fashion. The pivoting procedure allows for recovery of distributed image text, and the iterative procedure uncovers nested image information. We believe that these two algorithm features are crucial for detecting text in biomedical images.
Supplementary Material
Acknowledgments
Funding This research has been funded by NLM grant 5K22LM009255 and NLM grant 1R01LM009956.
Footnotes
Publisher's Disclaimer: This is a PDF file of an unedited manuscript that has been accepted for publication. As a service to our customers we are providing this early version of the manuscript. The manuscript will undergo copyediting, typesetting, and review of the resulting proof before it is published in its final citable form. Please note that during the production process errors may be discovered which could affect the content, and all legal disclaimers that apply to the journal pertain.
References
- 1.Xu S, McCusker J, Krauthammer M. Yale image finder (YIF): a new search engine for retrieving biomedical images. Bioinformatics. 2008;24(17):1968–1970. doi: 10.1093/bioinformatics/btn340. [DOI] [PMC free article] [PubMed] [Google Scholar]
- 2.Ohya J, Shio A, Akamatsu S. Recognizing characters in scene images. IEEE Transactions on Pattern Analysis and Machine Intelligence. 1994;16(2):214–220. doi: 10.1109/34.273729. [DOI] [Google Scholar]
- 3.Zhong Y, Karu K, Jain AK. Locating text in complex color images. Proceedings of the Third International Conference on Document Analysis and Recognition; 1995. pp. 146–149. [DOI] [Google Scholar]
- 4.Jung K. Neural network-based text location in color images. Pattern Recognition Letters. 2001;22(14):1503–1515. doi: http://dx.doi.org/10.1016/S0167-8655(01)00096-4.
- 5.Messelodi S, Modena C. Automatic identification and skew estimation of text lines in real scene images. Pattern Recognition. 1999;32(5):791–810. [Google Scholar]
- 6.Hasan Y, Karam L. Morphological text extraction from images. IEEE Transactions on Image Processing. 2000;9(11):1978–1983. doi: 10.1109/83.877220. [DOI] [PubMed] [Google Scholar]
- 7.Jain AK, Karu K. Learning texture discrimination masks. IEEE Transactions on Pattern Analysis and Machine Intelligence. 1996;18(2):195–205. doi: http://dx.doi.org/10.1109/34.481543.
- 8.Jain AK, Zhong Y. Page segmentation using texture analysis. Pattern Recognition. 1996;29(5):743–770. [Google Scholar]
- 9.Wu V, Manmatha R, Riseman EM. Textfinder: an automatic system to detect and recognize text in images. IEEE Transactions on Pattern Analysis and Machine Intelligence. 1999;21(11):1224–1229. doi: 10.1109/34.809116. [DOI] [Google Scholar]
- 10.Felzenszwalb PF, Huttenlocher DP. Efficient graph-based image segmentation. International Journal of Computer Vision. 2004;59(2):167–181. doi: http://dx.doi.org/10.1023/B:VISI.0000022288.19776.77.
- 11.Liu Q, Jung C, Kim S, Moon Y, yeun Kim J. Stroke filter for text localization in video images. Proceedings of IEEE International Conference on Image Processing; 2006. pp. 1473–1476. [DOI] [Google Scholar]
- 12.Li H, Doermann D, Kia O. Automatic text detection and tracking in digital video. IEEE Transactions on Image Processing. 2000;9(1):147–156. doi: 10.1109/83.817607. [DOI] [PubMed] [Google Scholar]
- 13.Antani S, Crandall D, Kasturi R. Robust extraction of text in video. Proceedings of the 15th Inter-national Conference on Pattern Recognition; 2000. pp. 831–834. [DOI] [Google Scholar]
- 14.Kim KI, Jung K, Park SH, Kim HJ. Support vector machine-based text detection in digital video. Pattern Recognition. 2001;34(2):527–529. [Google Scholar]
- 15.Lyu M, Song J, Cai M. A comprehensive method for multilingual video text detection, localization, and extraction. IEEE Transactions on Circuits and Systems for Video Technology. 2005;15(2):243–255. doi: 10.1109/TCSVT.2004.841653. [DOI] [Google Scholar]
- 16.Qian X, Liu G, Wang H, Su R. Text detection, localization, and tracking in compressed video. Image Communication. 2007;22(9):752–768. doi: http://dx.doi.org/10.1016/j.image.2007.06.005.
- 17.Shatkay H, Chen N, Blostein D. Integrating image data into biomedical text categorization. Bioinformatics. 2006;22(14):e446–e453. doi: 10.1093/bioinformatics/btl235. doi: http://dx.doi.org/10.1093/bioinformatics/btl235. [DOI] [PubMed]
- 18.Tulipano PK, Tao Y, Millar WS, Zanzonico P, Kolbert K, Xu H, Yu H, Chen L, Lussier YA, Friedman C. Natural language processing and visualization in the molecular imaging domain. Journal of Biomedical Informatics. 2007;40(3):270–281. doi: 10.1016/j.jbi.2006.08.002. doi: http://dx.doi.org/10.1016/j.jbi.2006.08.002. [DOI] [PubMed]
- 19.Qian Y, Murphy RF. Improved recognition of figures containing fluorescence microscope images in online journal articles using graphical models. Bioinformatics. 2008;24(4):569–576. doi: 10.1093/bioinformatics/btm561. doi: http://dx.doi.org/10.1093/bioinformatics/btm561. [DOI] [PMC free article] [PubMed]
- 20.Busch A, Boles WW, Sridharan S, Chandran V. Detection of unknown forms from document images. Proceedings of Workshop on Digital Image Computing; 2003. pp. 141–144. [Google Scholar]
- 21.Goto H. Redefining the dct-based feature for scene text detection–analysis and comparison of spatial frequency-based features. International Journal on Document Analysis and Recognition (IJDAR) 2008;11(1):1–8. [Google Scholar]
- 22.Xu P, Ji R, Yao H, Sun X, Liu T, Liu X. Text particles multi-band fusion for robust text detection. Lecture Notes in Computer Science: Image Analysis and Recognition. 2008;5112:587–596. [Google Scholar]
- 23.Fatma IK. Master’s thesis. Technical University Munich & California Institute of Technology; 2008. Visual saliency and biological inspired text detection. [Google Scholar]
- 24.Li X, Wang W, Jiang S, Huang Q, Gao W. Fast and effective text detection. 2008:969–972. [Google Scholar]
- 25.Lucas SM, Panaretos A, Sosa L, Tang A, Wong S, Young R. Icdar 2003 robust reading competitions. ICDAR ‘03: Proceedings of the Seventh International Conference on Document Analysis and Recognition; Washington, DC, USA: IEEE Computer Society; 2003. pp. 682–687. [Google Scholar]
- 26.Li H, Stephan W. Inferring the demographic history and rate of adaptive substitution in Drosophila; PLoS Genet; 2006. Oct 13, p. e166. Epub 2006 Aug 17. [DOI] [PMC free article] [PubMed] [Google Scholar]
- 27.Sörös P, Michael N, Tollkötter M, Pfleiderer B. The neurochemical basis of human cortical auditory processing: combining proton magnetic resonance spectroscopy and magnetoencephalography; BMC Biol; 2006. Aug 3, p. 25. [DOI] [PMC free article] [PubMed] [Google Scholar]
Associated Data
This section collects any data citations, data availability statements, or supplementary materials included in this article.


