Abstract
Previously, CD8+ T cells were found to be a sensitive target for suppression by Δ9-tetrahydrocannabinol (Δ9-THC) in a murine model of influenza infection. To study the effect of Δ9-THC on CD8+ cytotoxic T lymphocytes (CTL), an allogeneic model of MHC I mismatch was used to elicit CTL. In addition, to determine the requirement for the cannabinoid receptors 1 (CB1) and 2 (CB2) in Δ9-THC-mediated CTL response modulation, mice null for both receptors were used (CB1 −/−CB2 −/−). Δ9-THC suppressed CTL function independent of CB1 and CB2 as evidenced by reduction of 51Cr release by CTL generated from CB1 −/−CB2 −/− mice. Furthermore, viability in CD4+ and CD8+ cells was reduced in a concentration-dependent manner with Δ9-THC, independent of CB1 and CB2, but no effect of Δ9-THC on proliferation was observed, suggesting that Δ9-THC decreases the number of T cells initially activated. Δ9-THC increased expression of the activation markers, CD69 in CD8+ cells and CD25 in CD4+ cells in a concentration-dependent manner in cells derived from WT and CB1 −/−CB2 −/− mice. Furthermore, Δ9-THC synergized with the calcium ionophore, ionomycin, to increase CD69 expression on both CD4+ and CD8+ cells. In addition, without stimulation, Δ9-THC increased CD69 expression in CD8+ cells from CB1 −/−CB2 −/− and WT mice. Overall, these results suggest that CB1 and CB2 are dispensable for Δ9-THC-mediated suppression and that perturbation of Ca2+ signals during Tcell activation plays an important role in the mechanism by which Δ9-THC suppresses CTL function.
Keywords: Δ9-tetrahydrocannabinol, Cannabinoid receptors, Cytotoxic T lymphocytes, Immune modulation, Ca2+, T cell activation
Introduction
Several cannabinoid compounds including Δ9-THC have been implicated in the modulation of immune responses (Howlett et al. 2002; Klein et al. 2003). Cannabinoid compounds exert their activity, in part, by ligation of two identified targets, CB1 and CB2 (Maresz et al. 2007). However, studies using antagonists to these receptors, low affinity cannabinoid agonists, and mice lacking CB1 and/or CB2, have demonstrated that not all aspects of immune modulation by cannabinoid compounds can be attributed to CB1 and/or CB2 (Kaplan et al. 2003; Buchweitz et al. 2008; Springs et al. 2008; De Petrocellis and Di Marzo 2010). Thus, despite the ability to bind CB1 and CB2, the mechanism and cellular target(s) for Δ9-THC within the immune system remain elusive. In particular, recent studies revealed that in T cells, the effect of Δ9-THC on immune competence was found to occur independent of CB1 and CB2 (Kaplan et al. 2003; Rao and Kaminski 2006), an observation concordant with CB1 and CB2 expression, which is much lower on T cells compared to other leukocyte subpopulations (Galiegue et al. 1995). To further investigate the effects of Δ9-THC on Tcell responses, an in vivo influenza challenge model was used and showed that the CD8+ T cell population exhibited marked sensitivity to modulation by Δ9-THC (Buchweitz et al. 2007). These results suggested that CD8+ T cells might be a particularly sensitive T cell subset to cannabinoid-mediated immune modulation and might also represent a useful cellular target to gain novel insights into the molecular mechanisms of cannabinoid action.
The CD8+ surface marker distinguishes a lineage of T cells that are capable of interaction with major histocompatibility complex I (MHC I). To become fully functional, naïve CD8+ T cells must be activated, proliferate, and differentiate into CTL effectors. CTL are important in antiviral and antitumor immune responses. In addition to releasing cytokines pleiotropically involved in immune defense, CTL release cytotoxic granules or interact by cell contact with target cells to induce apoptosis in order to rid tissues of virus-infected or neoplastic cells (Boissonnas et al. 2007; Stinchcombe and Griffiths 2007). Lysis of target cells and the production of IFNγ are most often used as indicators of CTL function (Slifka et al. 1999; Sun et al. 2003). To experimentally elicit CTL from naïve CD8+ T cells, several models have been developed, among them is an allogeneic model using P815 (DBA2-derived) tumor cells to activate lymphocytes from a haplotype mismatched donor, such as C57Bl/6 mice. Using this model, CTL are generated in response to a T cell receptor-MHC mismatch and upon subsequent encounter, their effector function can be assayed (Engers et al. 1975). The objective of this study was to determine the effect of Δ9-THC and the involvement of CB1 and CB2 on CTL elicitation and function.
Methods
Animals
C57Bl/6 mice were ordered from the National Cancer Institute (NCI) and CB1 −/−CB2 −/− mice on C57Bl/6 background were bred in-house. CB1 −/−CB2 −/− mice were a kind gift of Dr. Andreas Zimmer at the Universität of Bonn, Germany. Mice were housed at Michigan State University in a pathogen free animal research housing facility at 21 to 24°C and 40 to 60% relative humidity with a 12-h light/dark cycle. Water and food (Purina Lab Chow) were available ad libitum. All protocols and procedures were performed in accordance with guidelines set forth by the Institutional Animal Care and Use Committee at Michigan State University. CB1 −/−CB2 −/− mice were routinely genotyped to validate absence of CBs using commercial primers for cnr1 and custom primers for cnr2 from Applied Biosystems (Kaplan et al. 2010).
Chemicals and reagents
Δ9-THC was obtained from the National Institute on Drug Abuse (Bethesda, MD). Ethanol was purchased from Decon Labs (King of Prussia, PA). Ionomycin (Io) and dimethylsulfoxide (DMSO) were purchased from Sigma Chemical Co. (St. Louis, MO). RPMI media was obtained from Gibco Invitrogen (Carlsbad, CA), and 51Cr as sodium chromate was obtained from Perkin Elmer (Waltham, MA).
T cell elicitation for generation of functional CTL
C57Bl/6 (WT) and CB1 −/−CB2 −/− mice were euthanized, the spleens isolated in a sterile environment, and splenocytes enumerated using a Coulter Counter (Beckman Coulter, Brea, CA). P815 cells were irradiated with 3000 rads to prevent proliferation, washed 3 times with RPMI and counted using a hemacytometer. Splenocytes and irradiated P815 cells were combined at 1×10⁶ and 1×10⁵ cells, respectively, in RPMI 1640 supplemented with 5% bovine calf serum (BCS) in a total volume of 200 μL in a round bottom 96 well plate. The plates were incubated in a humidified incubator with 5% CO2 at 37°C for the indicated amounts of time.
Drug treatment
At the time of co-culture of splenocytes and irradiated P815, Δ9-THC (1, 5, 10 μM), vehicle (VH, 0.1% ethanol) or RPMI (NA) was added. All Δ9-THC treatments had the same ethanol content (0.1%) as vehicle control.
51Cr release assay
After elicitation, cells were harvested and washed twice with RPMI 1640 media without serum. P815 cells were washed once and 1×10⁶ cells were incubated in the presence of Na2 51CrO4 for 1 h in 10% fetal bovine serum (FBS) supplemented RPMI 1640 media in a volume of less than 50 μL. After incubation P815 cells were washed 3 times using RPMI 1640 media without serum. 51Cr-labeled P815 cells were adjusted to 1×10⁵ cells/mL in 2% FBS RPMI media. Elicited CTL were adjusted in 2% FCS complete RPMI media to ratios ranging from 50 (5×10⁵) to 1 (1×10⁴ cells) : 1 (1×10⁴) P815 cells, depending on the experimental design, in a volume of 200 μL. After co-culture, elicited CTL and P815 were added to a 96 well round bottom plate and centrifuged at 200 g for 1 min to force cellular interactions. Control wells for spontaneous release (200 μL of P815 only) and total release (1% Triton-X 100 in 200 μL of P815 cells in RPMI) were used to determine the range of experimental release. After 5 h of co-culture in a humidified incubator with 5% CO2 at 37°C, cell lysis was assessed by aliquoting 100 μL of supernatant from each well, which represents the experimental release. The cytolytic activity was calculated as follows: % Release = (experimental release − spontaneous release)/(experimental release − total release)× 100.
IFNγ T cell functional analysis
CTL were elicited as described above for generation of CTL. After 5 days, cells were harvested and co-cultured with P815 at a ratio of 10:1 (see above) for 12 h in the presence of brefeldin A to prevent IFNγ release and allow for detection by fluorescently labeled antibody. After co-culture, cells were prepared for fluorescent antibody staining (described below).
Proliferation assay
Prior to elicitation, splenocytes were incubated with Cell Trace carboxyfluorescein succinimidyl ester (CFSE) dye (Invitrogen, Carlsbad, CA) according to manufacturer’s instructions. CTL were elicited as described above for generation of CTL. Dilution of dye staining is indicative of proliferation and staining profiles fromelicited samples were compared to a 24 h SPLC only control, incubated without P815.
T cell activation assays
CTL were elicited as described for generation of CTL; however, RPMI supplemented with 2% FCS was used instead of 5%. For direct stimulation, 0.5 μM Io dissolved in 0.01% DMSO in RPMI was used as the Ca2+ ionophore to induce intracellular Ca2+ levels, thereby increasing CD69 expression. After 6 h, CD69 surface staining was performed using antibodies specific for CD69 and after 24 h for CD25 (staining described in detail below).
Procedure for immunofluorescent staining for flow cytometry
CTL were elicited as described above. Cells were washed in 96 well round bottom plates with HBSS once and incubated with Near IR LIVE/DEAD (Invitrogen) dye to assess viability according to manufacturer’s instructions. This dye stains cells that have lost membrane integrity. Cells were washed twice with FACS buffer (1X HBSS, 1% bovine serum albumin (BSA), 0.1% sodium azide). Subsequently, Fc receptors were blocked using Purified Rat Anti-Mouse CD16/CD32 (BD Pharmingen, San Diego, CA). To stain surface proteins, cells were incubated for 20 min with 0.25–0.5 μg of CD4 (clone RM4-5, Biolegend, San Diego, CA) and CD8 (53–6.7, Biolegend). For the T cell activation experiments, cells were additionally stained with CD69 (H1.2 F3, Biolegend) and CD25 (PC61, Biolegend). Cells were then washed twice and fixed with Cytofix (BD, Franklin Lakes, NJ). After re-stimulation (described above), on the day of flow cytometric analysis, cells were washed once, then permeabilized with Perm/Wash Buffer (BD, Franklin Lakes, NJ) by incubation for 20 min and stained with IFNγ (XMG1.2, Biolegend) for 30 min. All experiments included single stain controls to compensate for fluorescence overlap between detectors. Samples were individually analyzed for percent positive staining as defined by a gate to perform statistical analysis and concatenated by treatment group for graphing using FlowJo v.8.8.6. for Macintosh.
Statistical analysis
Samples were analyzed using ANOVA or non-parametric equivalent Kruskal-Wallis. A p-value of 0.05 or less was deemed statistically significant between experimental and relative control. Regression analysis was performed treating values of each independent variable as a single datum point. All Δ9-THC treated samples were compared to vehicle (VH, 0.1% ethanol) control and comparisons between WT and CB1 −/−CB2 −/− were performed in naïve (NA) groups. Stimulation effect was determined between resting (NA–0 h) and NA at the indicated time point of sample collection. Statistical analyses were performed using Graph Pad Prism v4.03.
Results
Kinetics of CTL response
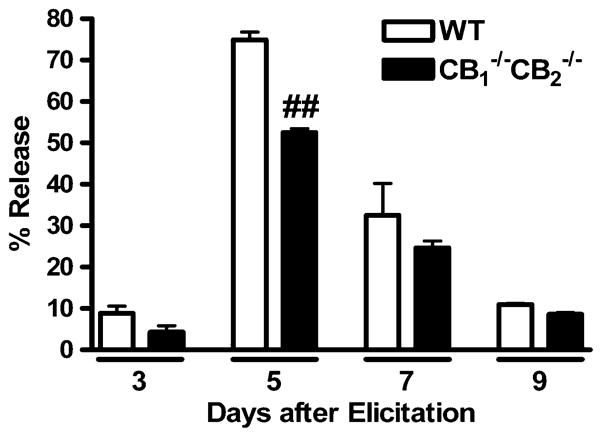
In order to determine the kinetics of the P815-induced CTL response, CTL were elicited for 3, 5, 7, and 9 days after co-culture with irradiated P815 cells. Splenocytes from WTand CB1 −/−CB2 −/− mice were used as the source of naïve CD8+ T cells. Elicited CTL were assayed for CTL activity by 51Cr release assay using 51Cr-labelled P815 target cells. A ratio of 50:1 CTL:P815 cells was used to maximize release, thereby increasing sensitivity on non-peak days. 51Cr release is a result of CTL-dependent lysis of P815 cells and the peak day of CTL activity occurred at day 5 post elicitation (Fig. 1). At the peak day of CTL elicitation, CB1 −/−CB2 −/− splenocytes had a statistically significant reduction in CTL activity, when compared to WT (p≤0.01). The same trend was observed for non-peak days, although it was not deemed statistically significant. Subsequent experiments determining CTL effector activity under various conditions were performed at day 5 post elicitation.
Fig. 1.
CTL activity peaks at day 5 after elicitation. To determine the peak day of CTL activity, splenocytes from WT and CB1 −/−CB2 −/− mice were co-cultured with irradiated P815 cells to elicit an allogeneic CTL response. On various days after elicitation, CTL were harvested and assayed for target (P815) lysing activity by reincubation at a ratio of 50:1 (Effector CTL : P815 Targets) with 51Cr labeled P815 cells. Percent release was calculated as described in Methods (n=4). The experiment was performed once, while more replicate experiments were performed for WTonly. ## p≤0.01 indicates difference between WT and CB1 −/−CB2 −/−
Δ9-THC suppressed CTL responses during elicitation but not during the effector response
To determine the sensitivity of CTL function to Δ9-THC treatment in the P815 allogeneic model, Δ9-THC and/or vehicle (0.1% ethanol) were added directly to culture during either the elicitation or effector phase of the CTL response. A concentration of 10 μM Δ9-THC was used to determine sensitivity of CTL to immune modulation, a concentration that historically impaired T cell immune responses in the absence of direct cytotoxicity (Springs et al. 2008). Δ9-THC suppressed CTL activity only when added prior to, but not after, the elicitation phase (Fig. 2). Likewise, repeated addition of Δ9-THC during elicitation and effector phases did not further reduce CTL activity below single addition of the drug during the elicitation phase (Fig. 2).
Fig. 2.
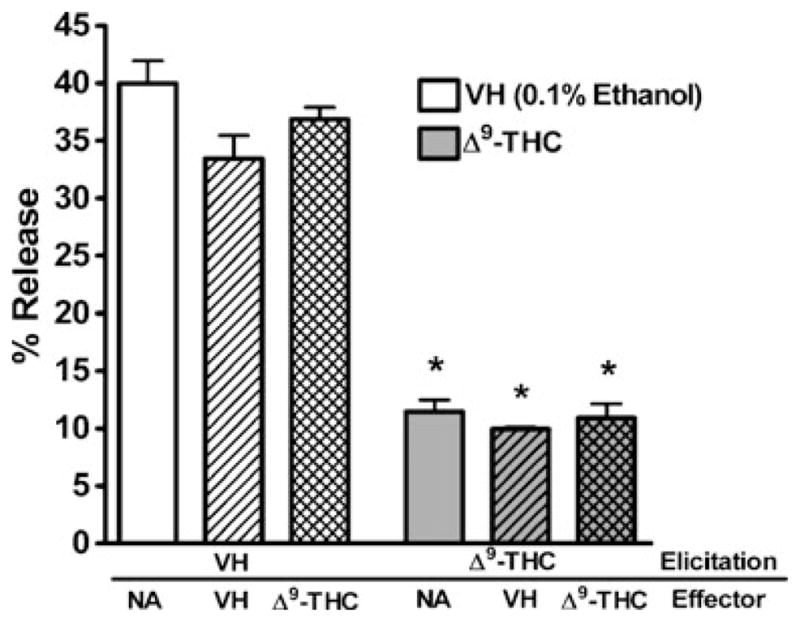
Δ9-THC suppresses CTL activity during elicitation but not effector phase. Splenocytes were treated with Δ9-THC and/or VH (0.1% ethanol) and stimulated with irradiated P815 cells for 5 days. After harvest, CTL were reincubated at a 10:1 ratio with 51Cr labeled P815 cells in the presence of Δ9-THC and appropriate controls (NA–naïve: no treatment; VH–0.1% ethanol) (n=4). Data shown are representative of two repeat experiments. * p≤0.05 indicates difference as compared to VH
Concentration-dependent suppression of CTL effector function
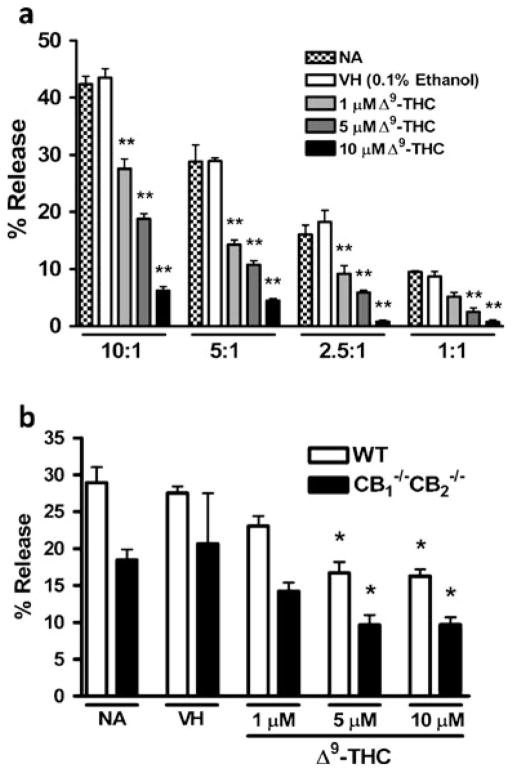
Next, we assessed whether CTL responses were suppressed by Δ9-THC in a concentration-dependent manner. At E:T ratios ranging from 10:1 to 1:1, Δ9-THC suppressed CTL responses in a concentration-dependent manner with statistically significant suppression at concentrations as low as 1 μM (Fig. 3a). Also, lower E:T ratios resulted in lower CTL activity, demonstrating that the elicited cell populations are responsible for the cytolytic activity and that Δ9-THC suppressed CTL activity independent of the E:T ratio (Fig. 3a). Regression analysis was performed on CTL activity results and a statistically significant difference was observed from zero regression values for E:T ratios 10:1 (r2= 0.8650, p<0.0001), 5:1 (r2=0.7246, p=0.0004), 2.5:1 (r2= 0.7461, p=0.0003), and 1:1 (r2=0.7692, p=0.0002). Next, we assessed whether the effect by Δ9-THC was dependent on the presence of CB1 and/or CB2. Δ9-THC suppressed CTL activity in a concentration-dependent manner in CTL elicited from CB1 −/−CB2 −/− splenocytes with significantly reduced CTL activity at concentrations of 5 μM or more as in WT (Fig. 3b). Regression analysis revealed a statistically significant difference from zero regression of E:T ratio of 10:1 in WT (r2=0.6893, p=0.0008) and showed the same trendinCB1 −/−CB2 −/− albeit not significant (r2=0.2905, p=0.0706). Consistent with previous observations, CTL activity of CB1 −/−CB2 −/− splenocytes was lower in magnitude compared to WT, although differences in genotypes were not deemed statistically significant.
Fig. 3.
Δ9-THC suppresses CTL activity in a concentration-dependent manner. Splenocytes from WT mice were treated with 1, 5 and 10 μM of Δ9-THC and/or VH (control) and co-cultured for 5 days with irradiated P815 cells. After harvest, CTL were reincubated with 51Cr labeled P815 cells at indicated ratios of 10:1 to 1:1 (a) (n=4). In a second experiment splenocytes from WTand CB1 −/−CB2 −/− mice were elicited and restimulated with 51Cr labeled P815 cells at a ratio of 10:1 (b) (n=4). Data shown are representative of two repeat experiments. * p≤0.05, ** p≤0.01 indicate differences as compared to VH
Δ9-THC-mediated suppression of CTL generation
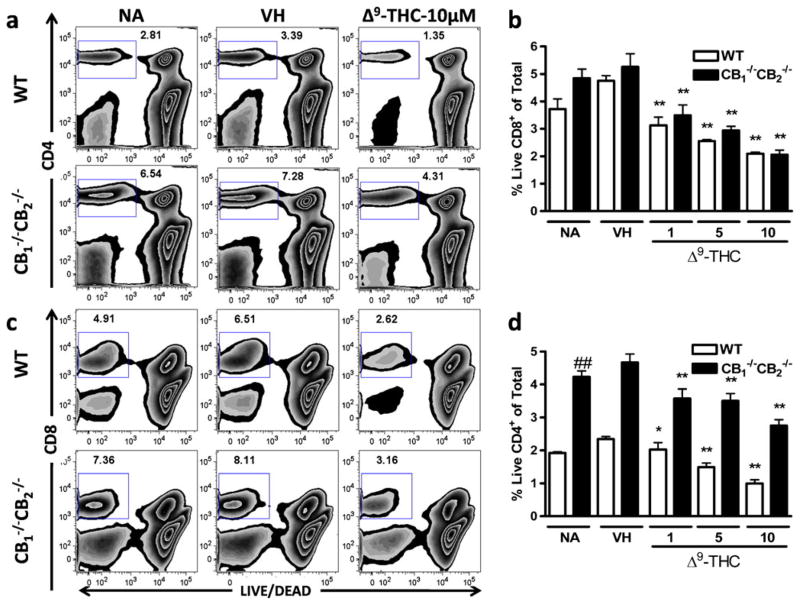
Although MHC I mismatch is a strong stimulus for driving the expansion of differentiated CD8+ T cell effectors, the overall number of viable Tcells within control cultures (NA or VH treatment groups) on day 5 of co-culture with P815 allogenic target cells was modest. This demonstrated that T cell proliferation and clonal expansion in response to MHC I-restricted alloantigens in this assay system induced a relatively small number of Tcells from the spleen. To assess the effects of Δ9-THC on its ability to impair alloantigen-induced expansion of T cell effectors, the number of viable CD4+ and CD8+ T cells was enumerated on Day 5 of the elicitation phase of the CTL response. Viability was determined using LIVE/DEAD dye (Invitrogen), which permeates dead cells and thus low staining is observed in viable cell populations. The percentage of viable CD4+ (Fig. 4a and b) and CD8+ Tcells (Fig. 4c and d) was markedly reduced by Δ9-THC treatment 5 days after elicitation with concentrations as low as 1 μM in both WTand CB1 −/−CB2 −/− samples. No significant differences were found in the percent of viable CD8+ cells between CB1 −/−CB2 −/− and WT splenocytes (Fig. 4c and d); however, a greater number of viable CD4+ T cells was observed in CB1 −/−CB2 −/− compared to WT splenocytes (Fig. 4a and b).
Fig. 4.
Lower viability of CD4+ and CD8+ cells following Δ9-THC treatment. CTL were elicited from splenocytes of WTand CB1 −/−CB2 −/− mice in the presence or absence of VH (0.1% ethanol) or Δ9-THC (1, 5, and 10 μM). After 5 days in culture, CD4 and CD8 surface staining was performed and viability was assessed using LIVE/DEAD staining. Viability was determined within CD4+ (a, b) and CD8+ (c, d) cells after singlet and lymphocyte size gating (n=4). Data shown are representative of four repeat experiments. * p≤0.05, ** p≤0.01 indicate differences as compared to VH, ## p≤0.01 as compared to WT
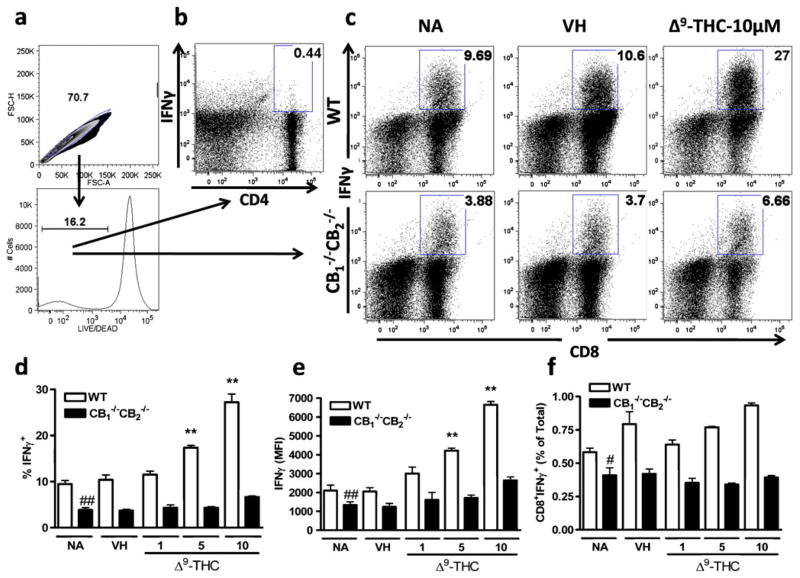
IFNγ production by CD8+ T cells is often used as a surrogate for CTL activity. After gating for single live cells (Fig. 5a), CD4+ cells did not produce significant amounts of IFNγ as P815 cells are MHC I-mismatched to C57Bl/6 cells (Fig. 5b). However, significant IFNγ production was detected by CD8+ cells, which was enhanced in CTL elicited from WTcompared to CB1 −/−CB2 −/− (Fig. 5c, d and e). In the presence of Δ9-THC, enhanced IFNγ production was observed in CD8+ T cells derived from WT and the same trend was observed at higher Δ9-THC concentrations in CB1 −/−CB2 −/− mice, although not deemed statistically significant (Fig. 5c, d and e). Also, IFNγ production was reduced in samples from CB1 −/−CB2 −/− compared to WT mice as previously observed in 51Cr release assays (Fig. 5c, d and e). Analysis of CD8+ IFNγ-secreting cells, as a percentage of viable cells, takes into account the reduced viability as a result of Δ9-THC addition (see Fig. 4). However, while there was an enhancement of IFNγ-secreting cells with Δ9-THC treatment, there were also fewer viable cells after Δ9-THC treatment, thus overall the percentage of CD8+ cells secreting IFNγ within the total population did not change (Fig. 5f).
Fig. 5.
Increased IFNγ production in live but not total cells after Δ9-THC treatment. CTL of WTand CB1 −/−CB2 −/− were elicited as before with and without VH (0.1% ethanol) or Δ9-THC (1, 5, 10 μM) treatment for 5 days. Cells were restimulated for 12 h in the presence of Brefeldin A and stained for CD4+, CD8+, LIVE/DEAD and IFNγ. Gating scheme is shown (a) for populations of CD4+ (b) and CD8+ (c) cells and dot plots indicate concatenated samples (n=4). Bar graph for CD8+ cells are shown within live populations % (d), MFI (e), and in % of total populations (f) (n=4). Data shown are representative of three repeat experiments. ** p≤0.01 indicate differences as compared to VH, ## p≤0.01 as compared to WT
Δ9-THC does not affect CD8+ T cell proliferation induced by P815 co-culture
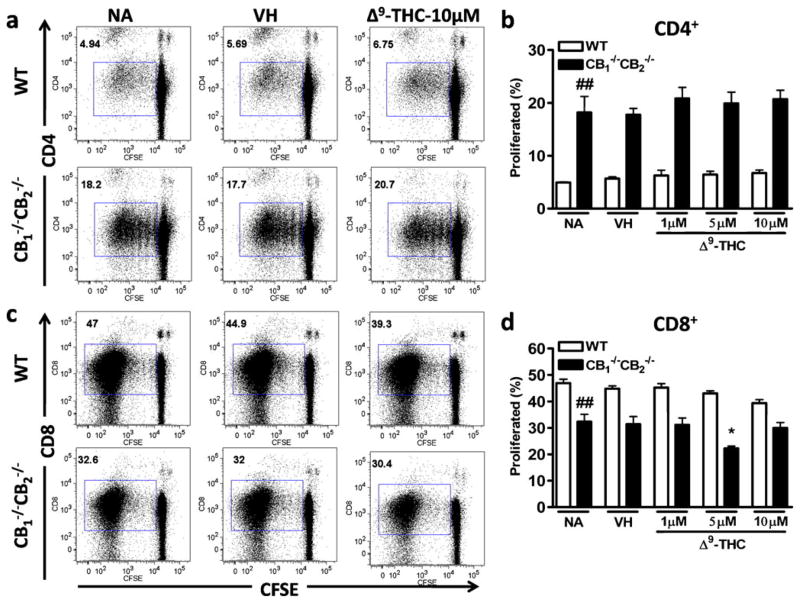
Prior to becoming functional CTL, proliferation occurs in T cells to expand the effector pool. Thus, we focused on proliferation as a potential endpoint leading to decreased viability and decreased CTL response. Splenocytes were labeled with CFSE dye to determine proliferation by dye dilution. No statistically significant differences in proliferation were observed between VH and Δ9-THC-treated groups neither in CD8+ nor in CD4+ cells from WTor CB1 −/−CB2 −/− mice (Fig. 6a, b, c and d). In comparison to WT, CD4+ cells obtained from CB1 −/−CB2 −/− spleens underwent much greater proliferation. CD4+ T cells were not directly stimulated in this model, suggesting that greater proliferation in CB1 −/−CB2 −/− CD4+ cells might either be due to higher basal proliferation in CB1 −/−CB2 −/− cells or a result of the cytokines produced by CD8+ cells. In contrast, notably more CD8+ cells were elicited in samples from WT compared to CB1 −/−CB2 −/− spleens (Fig. 6c and d).
Fig. 6.
No effect of Δ9-THC on proliferation. Splenocytes were isolated from WT and CB1 −/−CB2 −/− mice and labeled with Cell Trace CFSE according to manufacturer’s instructions. Four days after co-culture with irradiated P815 in the presence or absence of VH (0.1% ethanol) and Δ9-THC (1, 5, 10 μM), surface staining with CD4 and CD8 were performed and CFSE fluorescence was assessed by FACS. Shown are concatenated samples (n=4) of CFSE staining as a result of proliferation in CD4+ (a, b) and CD8+ cells (c, d). Data shown are representative of two repeat experiments. * p≤0.05 indicate differences as compared to VH, ## p≤0.01 as compared to WT
Increase of CD69 expression on CD8+ cells with Δ9-THC treatment
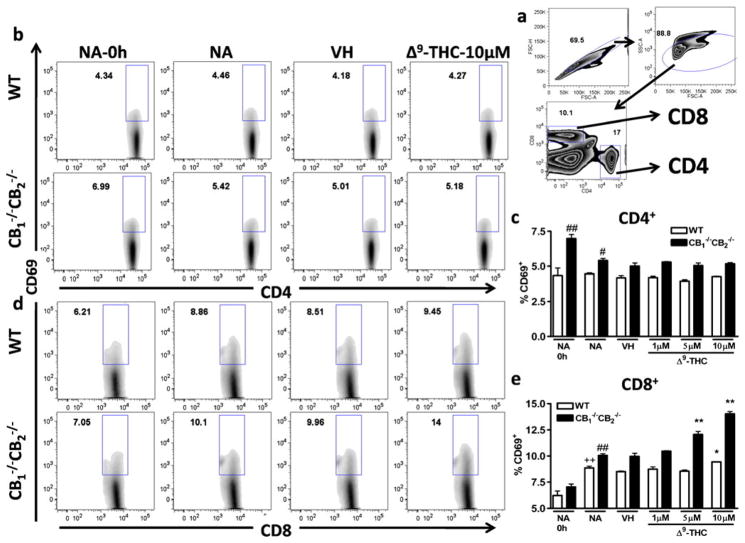
In an effort to determine events leading to the Δ9-THC-mediated reduction in cell viability and CTL activity seen at day 5, without any apparent effects on proliferation, we focused on T cell activation. Two markers of cellular activation found on both CD4+ and CD8+ T cells are the expression of CD69 and CD25. Whereas CD69 is thought to be one of the earliest markers of activation and is rapidly upregulated, CD25 expression increases gradually on activated T cells and is observed later than CD69 on activated T cells (Lopez-Cabrera et al. 1995; Brenchley et al. 2002). We focused on CD69 expression at 6 h and CD25 expression at 12 h after co-culture with irradiated P815 cells. Cells were gated on singlets, by size, and then on CD4 or CD8 (Fig. 7a). In CD4+ cells, CD69 expression was unaffected by co-culture with P815 cells; however, cells from CB1 −/−CB2 −/− mice showed higher basal expression compared to WT mice (Fig. 7b and c). In addition, no effect with Δ9-THC treatment was observed on CD69 expression on CD4+ cells (Fig. 7b and c). In contrast, the expression of CD69 on CD8+ was increased by co-culture with P815 cells and CD8+ T cells from CB1 −/−CB2 −/− expressed higher levels of CD69 than WT CD8+ T cells (Fig. 7d and e). CD69 expression was increased in a concentration-dependent manner by Δ9-THC in CD8+ T cells from both WT and CB1 −/−CB2 −/− spleens, which was significant at concentrations as low as 5 μM in CB1 −/−CB2 −/−-derived cells (Fig. 7d and e).
Fig. 7.
Δ9-THC increases CD69 expression on CD8+ cells in a concentration-dependent manner. Splenocytes from of WT and CB1 −/− CB2−/− mice were incubated with irradiated P815 cells for 6 h to induce CD69 surface expression, in the presence or absence of VH (0.1% ethanol) or Δ9-THC (1, 5, and 10 μM). Cells were gated on singlets and lymphocyte populations by size and then on CD4 and CD8 (a). CD4+ (b, c) and CD8+ (d, e) cells positive as defined by the box gate for CD69 in % are shown (n=4). Data shown are representative of three repeat experiments. Difference due to stimulation by P815 is indicated by ++ p≤0.01, due to genotypes by ## p≤0.01, due to Δ9-THC by * p≤0.05,** p≤0.01
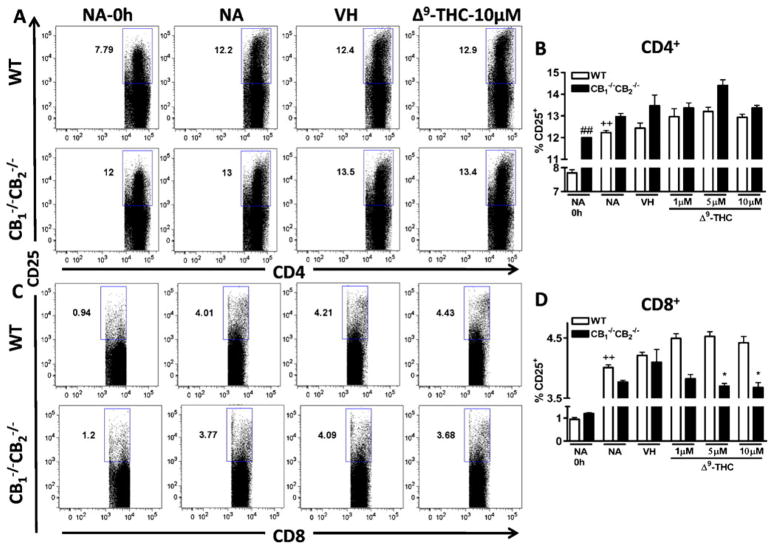
CD25 expression on CD4+ T cells was increased as a result of stimulation with P815 cells and increased levels of CD25 expression were observed in NA unstimulated samples from CB1 −/−CB2 −/− compared to WT mice (Fig. 8a and b). There was a trend towards a Δ9-THC-dependent increase in CD25 expression in both WT and CB1 −/−CB2 −/− CD4+ cell populations, but this trend was not statistically significant (Fig. 8b). In CD8+ cells, the expression of CD25 was much lower than in CD4+ cells (Fig. 8a, b, c and d). Expression of CD25 in CD8+ cells of both genotypes was increased by co-culture with P815 cells (Fig. 8c and d). In CD8+ cells from CB1 −/−CB2 −/− mice, a concentration-dependent decrease with Δ9-THC treatment was observed, while in WT Δ9-THC had no effect (Fig. 8c and d).
Fig. 8.
Δ9-THC decreases CD25 expression on CD8+ cells from CB1−/− CB2−/− mice in a concentration-dependent manner. Splenocytes from WT and CB1−/− CB2−/− mice were co-cultured with irradiated P815 cells for 12 h to induce CD25 levels, in the presence or absence of VH (0.1% ethanol) or Δ9-THC (1,5, and 10 μM). Cells were gated on singlets and lymphocyte populations by size and cells positive for CD25 in % are shown (n=4). Data shown are representative of two repeat experiments. Difference due to stimulation by P815 is indicated by ++ p≤0.01, due to genotypes by ## p≤0.01, due to Δ9-THC by * p≤0.05
Δ9-THC synergizes with Io to induce CD69 expression
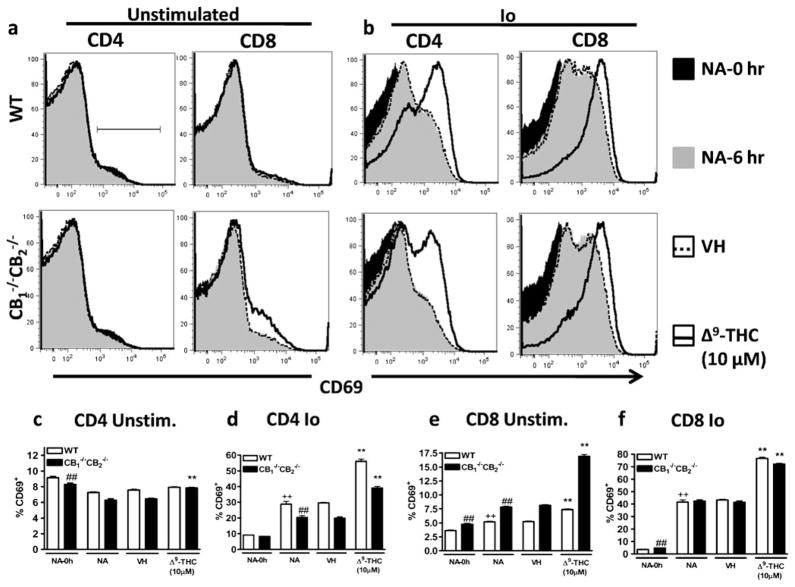
In light of the rapid Δ9-THC-mediated increase in CD69 expression of CD8+ T cells and its inverse correlation with Δ9-THC-mediated suppression of CTL activity, we focused on intracellular signals leading to CD69 protein expression. Previously, it was determined that independent of CB1 and CB2, Δ9-THC partially mediated its effects through the TRPC1 channel, which causes an increase in intracellular Ca2+ levels (Rao and Kaminski 2006). Using the calcium ionophore, Io, we tested whether a rise in intracellular Ca2+ might contribute to the observed increase in CD69 expression. In addition, the effect of Δ9-THC on Io-induced CD69 expression was evaluated. Again, cells were gated as described above (Fig. 7a). In CD4+ cells, Δ9-THC increased expression of CD69 moderately in the absence of an activating stimulus when isolated from CB1 −/−CB2 −/−, but not WT mice (Fig. 9a and c). Δ9-THC increased CD69 expression in CD8+ splenocytes from both WT and CB1 −/−CB2 −/− mice in the absence of an activating stimulus (Fig. 9a and e). After stimulation with Io, CD69 expression was dramatically increased in CD4+ and CD8+ cells from both genotypes (Fig. 9b, d and f). While CD69 expression was similar between WTand CB1 −/−CB2 −/− CD8+ cells (Fig. 9b and f), a marked reduction in CD69 expression was observed in CB1 −/−CB2 −/− CD4+ cells, when compared to WT CD4+ cells (Fig. 9b and d). Most importantly, Δ9-THC synergized with Io to further increase CD69 surface expression in CD4+ and CD8+ cells derived from both genotypes (Fig. 9b, d and f).
Fig. 9.
Δ9-THC synergizes with Io to upregulate CD69 expression. Splenocytes were incubated in the presence of Io (0.5 μM) or VH (0.01% DMSO) in the presence or absence of VH (0.1% ethanol) or Δ9-THC (1, 5, and 10 μM). For NA-0 h, CD69 staining was performed after isolation of a single cell suspension from the spleen otherwise 6 h after co-culture. Cells were gated on singlet, lymphocytes and within CD4 (a–d) or CD8 (a, b, e, f) positive populations. Data shown in histograms are concatenated (n=4) and are representative of two repeat experiments. Difference due to stimulation by Io is indicated by ++ p≤0.01, due to genotypes by ## p≤0.01, due to Δ9-THC by ** p≤0.01
Discussion
Collectively, these studies provide evidence that Δ9-THC-mediated suppression of CD8+ T cell function occurs independent of CB1 and CB2. Moreover, Δ9-THC alters early signaling events that involve putative changes in intracellular Ca2+ levels, eventually resulting in lower numbers of CTL effectors. Finally, this study introduces an inherent role for CB1 and/or CB2 in the elicitation of CTL, because elicitation and function of CTL was reduced in CB1 −/−CB2 −/− mice in vitro.
In contrast to other reports describing enhanced immune responses in CB1 −/−CB2 −/− mice (Karsak et al. 2007; Buchweitz et al. 2008), in this in vitro model of alloantigen-induced CTL elicitation and effector function, CTL activity in cells from CB1 −/−CB2 −/− mice was reduced when compared to WT mice. Although this was consistent with our previous study in which we observed a reduction in the T cell-dependent humoral immune response to sheep erythrocytes in vitro in CB1 −/−/CB2 −/− as compared to WT mice (Springs et al. 2008), there are several studies demonstrating enhanced immune function in CB1 −/−CB2 −/− mice (Karsak et al. 2007; Buchweitz et al. 2008). In a previous study from our laboratory (Buchweitz et al. 2008), it was demonstrated that CB1 −/−CB2 −/− mice, in addition to responding with a greater magnitude to immune stimuli, have altered immune homeostasis compared to WT mice as evidenced by greater numbers of CD4+ T cells and higher levels of TNF-α in the bronchoalveolar lavage fluid in the absence of influenza challenge. In addition, there appeared to be mechanisms in CB1 −/−CB2 −/− mice that might compensate for the loss of CB1 and/or CB2, as evidenced by greater levels of the endocannabinoids, 2-arachidonoyl glycerol and anandamide (Karsak et al. 2007), and increased transcripts of cnr2 using primers specific for the undeleted portion of the gene (Liu et al. 2009). Although CB1 −/−CB2 −/− mice seem to be particularly vulnerable to proinflammatory insult, there were no drastic differences observed in an adjuvant-free airway hypersensitivity model between CB1 −/−CB2 −/− and WT mice (Kaplan et al. 2010). Reasons for reduced function of CTL from CB1−/− CB2−/− mice compared to WT mice, although not altogether clear, might be due to the present studies being conducted in vitro, and/or the nature in which the immune response was initiated, in this case by direct stimulation of CD8+ T cells with an alloantigen.
Greater proliferation was detected in CD4+, but lower proliferation in CD8+ cells, from CB1−/− CB2−/− compared to WT mice. This lower proliferation in CD8+ cells might contribute to the reduced CTL activity in CB1−/− CB2−/− compared to WT mice. Furthermore, higher percentages of CD4+CD25+ were observed in unstimulated splenocytes of CB1−/− CB2−/− compared to WT mice. These CD4+CD25+ cells are thought to be regulatory T cells (Treg) (Suri-Payer et al. 1998), which are involved in the suppression of the immune responses. It has been demonstrated that an increase in CD4+CD25+ cells leads to reduced CTL responses; thereby Tregs could potentially contribute to the reduced activity in vitro in CTL generated from CB1−/− CB2−/− mice (Piccirillo and Shevach 2001). This in vitro model, due to direct stimulation of CTL, lacks a proinflammatory stimulus and does not produce IL-6, which has been implicated in overriding Treg responses, thus Treg responses might be maintained during the in vitro culture (Bettelli et al. 2006). As our focus was on the Δ9-THC-mediated suppression of CTL responses, we did not further characterize these CD4+CD25+ cells for expression of Foxp3 or other cellular markers of the Treg lineage (Fontenot and Rudensky 2005). Additional studies are required to determine the role of Tregs in CB1−/−/CB2−/− mice.
Addition of Δ9-THC during the elicitation and effector response showed that only NA CD8+ cells, but not differentiated CTL, were sensitive to Δ9-THC-mediated suppression of CTL function as assessed by 51Cr release assay, suggesting Δ9-THC-mediated immune modulation during elicitation. Arguably, the concentrations of Δ9-THC at which altered CTL activity was observed in this investigation are higher than detected in the serum of recreational marijuana smokers. However, it is important to emphasize two points. The first is that in addition to Δ9-THC, marijuana smoke contains over 60 other structurally-related cannabinoids, a number of which are also well established immune modulators and the majority of which remain to be evaluated for immunomodulatory activity (Ashton 2001; Friedman et al. 2003). Second, and equally important, the goal of this study was to relate the decrease in viral clearance observed after Δ9-THC treatment of animal with influenza-infected airways (Buchweitz et al. 2007) and the possibility that this may be due to cannabinoid-mediated suppression in CTL activity. In the case of inhaled marijuana smoke, the cannabinoid concentrations attained in the lung are significantly higher than systemic serum Δ9-THC concentrations and may be more closely related to those used in the current study (Azorlosa et al. 1992; Huestis and Cone 2004). The timeframe of sensitivity to Δ9-THC might reflect a high level of T cell plasticity prior to differentiation and reduced plasticity after differentiation (Sundrud et al. 2003). Other immunomodulatory compounds such as 2,3,7,8-tetrachlorodibenzo- p-dioxin and glucocorticoids exert their greatest effect on early stages of immune cell differentiation and tend to have a lower efficacy if added after the onset of the differentiation program (Piccolella et al. 1985; Tucker et al. 1986). Specifically, cyclosporin A is very efficacious in suppressing in vitro culture of allogeneic cells only when added prior to elicitation (Hess and Tutschka 1980). Overall, this suggests a critical window of sensitivity for immunomodulatory compounds, including Δ9-THC, for immune suppression, specifically during the transition of NA CD8+ T cells to CTL during elicitation.
Using IFNγ as a surrogate for CTL activity demonstrated that CD8+ cells are the sole producers of IFNγ after allogeneic stimulation, suggesting that only CTL directly contribute to the 51Cr release from labeled target cells. Although it appeared that Δ9-THC increased IFNγ expression in CTL, the cells were gated on the live cell populations. Upon examination of the results from the total population, there was no effect of Δ9-THC on IFNγ, demonstrating alternative interpretations of the data. Taken together, our results suggest that while there seemed to be a population of CTL whose activity cannot be suppressed by Δ9-THC, which become the IFNγ-secreting cells, the remaining cells are sensitive to Δ9-THC and were not capable of surviving the five-day culture period. Thus, the suppression by Δ9-THC does not appear to reduce the amount of IFNγ each cell produces, but rather impaired the differentiation of a select pool of naïve cells from becoming effector CTL.
No effects of Δ9-THC treatment on the proliferation of CD4+ or CD8+ cells in WT or CB1−/− CB2−/− mice were observed. To link the functional outcome of Δ9-THC treatment to earlier T cell signaling, the expression of activation markers, CD25, forming the high affinity IL-2 receptor and CD69, the earliest known lymphocyte activation marker (Lopez-Cabrera et al. 1995) were assessed. While CD25 expression was increased as a result of P815 co-culture, only CD8+ cells from CB1−/− CB2−/− mice had reduced CD25 expression as a result of Δ9-THC treatment. CD69 expression was also increased as a result of co-culture with P815 cells in both WT and CB1−/− CB2−/− CD8+ cells and Δ9-THC treatment further enhanced the P815-induced rise in CD69 expression in both genotypes. The ability of Δ9-THC to increase CD69 expression on the surface of CD8+ T cells from WT and CB1−/− CB2−/− after P815 cell stimulation provides further evidence for CB1 and/or CB2-independent mechanism(s) of Δ9-THC immune modulation. Notably, expression of CD69 was inversely correlated with CTL activity. For example, the highest CD69 expression and lowest CTL activity were observed in cells treated with the highest concentration of Δ9-THC (10 μM) from CB1−/− CB2−/− mice.
CD69 expression is controlled by several transcription factors, including AP-1 in the proximal promoter (Castellanos et al. 1997) as well as EGR, ATF/CREB (Castellanos Mdel et al. 2002), and NFκB (Lopez-Cabrera et al. 1995). However, the pathways regulating the expression of CD69 are different depending on the cell type (Vazquez et al. 2009). It is not entirely clear what cellular signals contribute to CD69 induction in CD8+ T cells, but it is known that Ca2+ influx into T cells increases CD69 expression (Testi et al. 1994) and, at least in thymocytes, extracellular Ca2+ was found to be critical for CD69 induction (Rodrigues Mascarenhas et al. 2003). In these studies Δ9-THC synergized with Io to increase CD69 expression suggesting that Ca2+ plays an important role in the Δ9-THC-mediated increase of CD69 expression. Previously, our laboratory reported that Δ9-THC strongly induced intracellular Ca2+ in T cells, which was mediated by TRPC1 (Rao et al. 2004; Rao and Kaminski 2006) independent of the requirement for T cell activation. These studies, taken together with previous results, suggest that modulation of an activation stimulus by concurrent induction of Ca2+ through Δ9-THC-mediated opening of TRPC1 channels contributes directly to the suppression of CTL activity. In addition, there are reports indicating that Δ9-THC has a high binding affinity for GPR55 (Ryberg et al. 2007) and causes increases in intracellular Ca2+ levels via GPR55 (Lauckner et al. 2008), but there are also conflicting reports demonstrating that Δ9-THC possesses a low affinity for GPR55 (Oka et al. 2007). The role of GPR55 in the present study is unknown; however, due to the expression of GPR55 in the spleen (Ryberg et al. 2007) and its ability to modulate Ca2+ currents it is tempting to speculate that GPR55 contributes to alterations in Ca2+ signaling induced by Δ9-THC. Ca2+ is a ubiquitous intracellular signaling molecule and in addition to activation, Ca2+ is central to the induction of anergy and cell death, which are seemingly separate processes, yet involve shared mechanisms and endpoints (Macian et al. 2002; Parish et al. 2009). Thus, due to the role of Ca2+ in the generation of CTL, it seems plausible that Δ9-THC-mediated alterations in Ca2+-signaling are involved in the suppression of CTL responses.
Collectively, the reduced cytolytic activity, decreased number of CTL effectors, and the increase in CD69 expression, although temporally distinct, might be interrelated, and a consequence of early Δ9-THC-induced changes in Ca2+ signaling. Concordantly, immune cells appear to initially undergo greater activation (CD69), but become unresponsive to secondary stimulation; in essence, anergic. The critical role of calcium in leukocyte activation and subsequent differentiation and effector function is well established. Δ9-THC treatment prior to cellular activation significantly elevates intracellular Ca2+ levels, which in turn interferes with either entry or execution of the T cell differentiation program. The specific downstream signaling pathways affected through the Δ9-THC-mediated elevation of intracellular Ca2+ levels affecting T cell function remain to be elucidated but likely involve p38 MAPK, JNK, and ERK. Indeed, prior studies by our laboratory demonstrated decreased ERK phosphorylation by cannabinol, another cannabinoid acting independently of CB1 and CB2 (Faubert Kaplan and Kaminski 2003). Thus, the immediate perturbation of intracellular Ca2+ levels by cannabinoids, including Δ9-THC, seems to be the initial event triggering a cascade of events, eventually resulting in immune suppression. Signaling by cannabinoids seems to alter the regulation of Ca2+ that is central to the initiation of a T cell response to impair immune function.
Acknowledgments
The authors would like to thank Mr. Robert Crawford for excellent technical assistance with flow cytometer and Mrs. Kimberly Hambleton for assistance with submission of the manuscript.
Support: NIH Grants RO1DA12740 and RO1DA07908
Contributor Information
Peer W. F. Karmaus, Cell and Molecular Biology Program, East Lansing, USA. Center for Integrative Toxicology, East Lansing, USA
Weimin Chen, Microbiology and Molecular Genetics, East Lansing, USA. Center for Integrative Toxicology, East Lansing, USA.
Barbara L. F. Kaplan, Center for Integrative Toxicology, East Lansing, USA. Pharmacology and Toxicology, Michigan State University, East Lansing, MI 48824, USA
Norbert E. Kaminski, Email: kamins11@msu.edu, Cell and Molecular Biology Program, East Lansing, USA. Center for Integrative Toxicology, East Lansing, USA. Pharmacology and Toxicology, Michigan State University, East Lansing, MI 48824, USA. Center for Integrative Toxicology, Pharmacology and Toxicology, Cell and Molecular Biology Program, 315 Food Safety and Toxicology Building, East Lansing, USA
References
- Ashton CH. Pharmacology and effects of cannabis: a brief review. Br J Psychiatry. 2001;178:101–106. doi: 10.1192/bjp.178.2.101. [DOI] [PubMed] [Google Scholar]
- Azorlosa JL, Heishman SJ, Stitzer ML, Mahaffey JM. Marijuana smoking: effect of varying delta 9-tetrahydrocannabinol content and number of puffs. J Pharmacol Exp Ther. 1992;261:114–122. [PubMed] [Google Scholar]
- Bettelli E, Carrier Y, Gao W, Korn T, Strom TB, Oukka M, Weiner HL, Kuchroo VK. Reciprocal developmental pathways for the generation of pathogenic effector TH17 and regulatory T cells. Nature. 2006;441:235–238. doi: 10.1038/nature04753. [DOI] [PubMed] [Google Scholar]
- Boissonnas A, Fetler L, Zeelenberg IS, Hugues S, Amigorena S. In vivo imaging of cytotoxic T cell infiltration and elimination of a solid tumor. J Exp Med. 2007;204:345–356. doi: 10.1084/jem.20061890. [DOI] [PMC free article] [PubMed] [Google Scholar]
- Brenchley JM, Douek DC, Ambrozak DR, Chatterji M, Betts MR, Davis LS, Koup RA. Expansion of activated human naive T-cells precedes effector function. Clin Exp Immunol. 2002;130:432–440. doi: 10.1046/j.1365-2249.2002.02015.x. [DOI] [PMC free article] [PubMed] [Google Scholar]
- Buchweitz JP, Karmaus PW, Harkema JR, Williams KJ, Kaminski NE. Modulation of airway responses to influenza A/PR/8/34 by Delta9-tetrahydrocannabinol in C57BL/6 mice. J Pharmacol Exp Ther. 2007;323:675–683. doi: 10.1124/jpet.107.124719. [DOI] [PubMed] [Google Scholar]
- Buchweitz JP, Karmaus PW, Williams KJ, Harkema JR, Kaminski NE. Targeted deletion of cannabinoid receptors CB1 and CB2 produced enhanced inflammatory responses to influenza A/PR/8/34 in the absence and presence of Delta9-tetrahydrocannabinol. J Leukoc Biol. 2008;83:785–796. doi: 10.1189/jlb.0907618. [DOI] [PubMed] [Google Scholar]
- Castellanos Mdel C, Lopez-Giral S, Lopez-Cabrera M, de Landazuri MO. Multiple cis-acting elements regulate the expression of the early T cell activation antigen CD69. Eur J Immunol. 2002;32:3108–3117. doi: 10.1002/1521-4141(200211)32:11<3108::AID-IMMU3108>3.0.CO;2-D. [DOI] [PubMed] [Google Scholar]
- Castellanos MC, Munoz C, Montoya MC, Lara-Pezzi E, Lopez-Cabrera M, de Landazuri MO. Expression of the leukocyte early activation antigen CD69 is regulated by the transcription factor AP-1. J Immunol. 1997;159:5463–5473. [PubMed] [Google Scholar]
- De Petrocellis L, Di Marzo V. Non-CB1, non-CB2 receptors for endocannabinoids, plant cannabinoids, and synthetic cannabimimetics: focus on G-protein-coupled receptors and transient receptor potential channels. J Neuroimmune Pharmacol. 2010;5:103–121. doi: 10.1007/s11481-009-9177-z. [DOI] [PubMed] [Google Scholar]
- Engers HD, Thomas K, Cerottini JC, Brunner KT. Generation of cytotoxic T lymphocytes in vitro. V. Response of normal and immune spleen cells to subcellular alloantigens. J Immunol. 1975;115:356–360. [PubMed] [Google Scholar]
- Faubert Kaplan BL, Kaminski NE. Cannabinoids inhibit the activation of ERK MAPK in PMA/Io-stimulated mouse splenocytes. Int Immunopharmacol. 2003;3:1503–1510. doi: 10.1016/S1567-5769(03)00163-2. [DOI] [PubMed] [Google Scholar]
- Fontenot JD, Rudensky AY. A well adapted regulatory contrivance: regulatory T cell development and the forkhead family transcription factor Foxp3. Nat Immunol. 2005;6:331–337. doi: 10.1038/ni1179. [DOI] [PubMed] [Google Scholar]
- Friedman H, Newton C, Klein TW. Microbial infections, immunomodulation, and drugs of abuse. Clin Microbiol Rev. 2003;16:209–219. doi: 10.1128/CMR.16.2.209-219.2003. [DOI] [PMC free article] [PubMed] [Google Scholar]
- Galiegue S, Mary S, Marchand J, Dussossoy D, Carriere D, Carayon P, Bouaboula M, Shire D, Le Fur G, Casellas P. Expression of central and peripheral cannabinoid receptors in human immune tissues and leukocyte subpopulations. Eur J Biochem. 1995;232:54–61. doi: 10.1111/j.1432-1033.1995.tb20780.x. [DOI] [PubMed] [Google Scholar]
- Hess AD, Tutschka PJ. Effect of cyclosporin A on human lymphocyte responses in vitro. I. CsA allows for the expression of alloantigen-activated suppressor cells while preferentially inhibiting the induction of cytolytic effector lymphocytes in MLR. J Immunol. 1980;124:2601–2608. [PubMed] [Google Scholar]
- Howlett AC, Barth F, Bonner TI, Cabral G, Casellas P, Devane WA, Felder CC, Herkenham M, Mackie K, Martin BR, Mechoulam R, Pertwee RG. International union of pharmacology. XXVII. Classification of cannabinoid receptors. Pharmacol Rev. 2002;54:161–202. doi: 10.1124/pr.54.2.161. [DOI] [PubMed] [Google Scholar]
- Huestis MA, Cone EJ. Relationship of Delta 9-tetrahydrocannabinol concentrations in oral fluid and plasma after controlled administration of smoked cannabis. J Anal Toxicol. 2004;28:394–399. doi: 10.1093/jat/28.6.394. [DOI] [PubMed] [Google Scholar]
- Kaplan BL, Rockwell CE, Kaminski NE. Evidence for cannabinoid receptor-dependent and -independent mechanisms of action in leukocytes. J Pharmacol Exp Ther. 2003;306:1077–1085. doi: 10.1124/jpet.103.051961. [DOI] [PubMed] [Google Scholar]
- Kaplan BL, Lawver JE, Karmaus PW, Ngaotepprutaram T, Birmingham NP, Harkema JR, Kaminski NE. The effects of targeted deletion of cannabinoid receptors CB1 and CB2 on intranasal sensitization and challenge with adjuvant-free ovalbumin. Toxicol Pathol. 2010;38:382–392. doi: 10.1177/0192623310362706. [DOI] [PMC free article] [PubMed] [Google Scholar]
- Karsak M, Gaffal E, Date R, Wang-Eckhardt L, Rehnelt J, Petrosino S, Starowicz K, Steuder R, Schlicker E, Cravatt B, Mechoulam R, Buettner R, Werner S, Di Marzo V, Tuting T, Zimmer A. Attenuation of allergic contact dermatitis through the endocannabinoid system. Science. 2007;316:1494–1497. doi: 10.1126/science.1142265. [DOI] [PubMed] [Google Scholar]
- Klein TW, Newton C, Larsen K, Lu L, Perkins I, Nong L, Friedman H. The cannabinoid system and immune modulation. J Leukoc Biol. 2003;74:486–496. doi: 10.1189/jlb.0303101. [DOI] [PubMed] [Google Scholar]
- Lauckner JE, Jensen JB, Chen HY, Lu HC, Hille B, Mackie K. GPR55 is a cannabinoid receptor that increases intracellular calcium and inhibits M current. Proc Natl Acad Sci U S A. 2008;105:2699–2704. doi: 10.1073/pnas.0711278105. [DOI] [PMC free article] [PubMed] [Google Scholar]
- Liu QR, Pan CH, Hishimoto A, Li CY, Xi ZX, Llorente-Berzal A, Viveros MP, Ishiguro H, Arinami T, Onaivi ES, Uhl GR. Species differences in cannabinoid receptor 2 (CNR2 gene): identification of novel human and rodent CB2 isoforms, differential tissue expression and regulation by cannabinoid receptor ligands. Gene Brain Behav. 2009;8:519–530. doi: 10.1111/j.1601-183X.2009.00498.x. [DOI] [PMC free article] [PubMed] [Google Scholar]
- Lopez-Cabrera M, Munoz E, Blazquez MV, Ursa MA, Santis AG, Sanchez-Madrid F. Transcriptional regulation of the gene encoding the human C-type lectin leukocyte receptor AIM/CD69 and functional characterization of its tumor necrosis factor-alpha-responsive elements. J Biol Chem. 1995;270:21545–21551. doi: 10.1074/jbc.270.37.21545. [DOI] [PubMed] [Google Scholar]
- Macian F, Garcia-Cozar F, Im SH, Horton HF, Byrne MC, Rao A. Transcriptional mechanisms underlying lymphocyte tolerance. Cell. 2002;109:719–731. doi: 10.1016/s0092-8674(02)00767-5. [DOI] [PubMed] [Google Scholar]
- Maresz K, Pryce G, Ponomarev ED, Marsicano G, Croxford JL, Shriver LP, Ledent C, Cheng X, Carrier EJ, Mann MK, Giovannoni G, Pertwee RG, Yamamura T, Buckley NE, Hillard CJ, Lutz B, Baker D, Dittel BN. Direct suppression of CNS autoimmune inflammation via the cannabinoid receptor CB1 on neurons and CB2 on autoreactive T cells. Nat Med. 2007;13:492–497. doi: 10.1038/nm1561. [DOI] [PubMed] [Google Scholar]
- Oka S, Nakajima K, Yamashita A, Kishimoto S, Sugiura T. Identification of GPR55 as a lysophosphatidylinositol receptor. Biochem Biophys Res Commun. 2007;362:928–934. doi: 10.1016/j.bbrc.2007.08.078. [DOI] [PubMed] [Google Scholar]
- Parish IA, Rao S, Smyth GK, Juelich T, Denyer GS, Davey GM, Strasser A, Heath WR. The molecular signature of CD8+ T cells undergoing deletional tolerance. Blood. 2009;113:4575–4585. doi: 10.1182/blood-2008-10-185223. [DOI] [PMC free article] [PubMed] [Google Scholar]
- Piccirillo CA, Shevach EM. Cutting edge: control of CD8+ T cell activation by CD4 + CD25+ immunoregulatory cells. J Immunol. 2001;167:1137–1140. doi: 10.4049/jimmunol.167.3.1137. [DOI] [PubMed] [Google Scholar]
- Piccolella E, Vismara D, Lombardi G, Guerritore D, Piantelli M, Ranelletti FO. Effect of glucocorticoids on the development of suppressive activity in human lymphocyte response to a polysaccharide purified from Candida albicans. J Immunol. 1985;134:1166–1171. [PubMed] [Google Scholar]
- Rao GK, Kaminski NE. Induction of intracellular calcium elevation by Delta9-tetrahydrocannabinol in T cells involves TRPC1 channels. J Leukoc Biol. 2006;79:202–213. doi: 10.1189/jlb.0505274. [DOI] [PubMed] [Google Scholar]
- Rao GK, Zhang W, Kaminski NE. Cannabinoid receptor-mediated regulation of intracellular calcium by delta(9)-tetrahydrocannabinol in resting T cells. J Leukoc Biol. 2004;75:884–892. doi: 10.1189/jlb.1203638. [DOI] [PubMed] [Google Scholar]
- Rodrigues Mascarenhas S, Echevarria-Lima J, Fernandes dos Santos N, Rumjanek VM. CD69 expression induced by thapsigargin, phorbol ester and ouabain on thymocytes is dependent on external Ca2+ entry. Life Sci. 2003;73:1037–1051. doi: 10.1016/s0024-3205(03)00377-1. [DOI] [PubMed] [Google Scholar]
- Ryberg E, Larsson N, Sjogren S, Hjorth S, Hermansson NO, Leonova J, Elebring T, Nilsson K, Drmota T, Greasley PJ. The orphan receptor GPR55 is a novel cannabinoid receptor. Br J Pharmacol. 2007;152:1092–1101. doi: 10.1038/sj.bjp.0707460. [DOI] [PMC free article] [PubMed] [Google Scholar]
- Slifka MK, Rodriguez F, Whitton JL. Rapid on/off cycling of cytokine production by virus-specific CD8+ T cells. Nature. 1999;401:76–79. doi: 10.1038/43454. [DOI] [PubMed] [Google Scholar]
- Springs AE, Karmaus PW, Crawford RB, Kaplan BL, Kaminski NE. Effects of targeted deletion of cannabinoid receptors CB1 and CB2 on immune competence and sensitivity to immune modulation by Delta9-tetrahydrocannabinol. J Leukoc Biol. 2008;84:1574–1584. doi: 10.1189/jlb.0508282. [DOI] [PMC free article] [PubMed] [Google Scholar]
- Stinchcombe JC, Griffiths GM. Secretory mechanisms in cell-mediated cytotoxicity. Annu Rev Cell Dev Biol. 2007;23:495–517. doi: 10.1146/annurev.cellbio.23.090506.123521. [DOI] [PubMed] [Google Scholar]
- Sun Y, Iglesias E, Samri A, Kamkamidze G, Decoville T, Carcelain G, Autran B. A systematic comparison of methods to measure HIV-1 specific CD8 T cells. J Immunol Meth. 2003;272:23–34. doi: 10.1016/s0022-1759(02)00328-9. [DOI] [PubMed] [Google Scholar]
- Sundrud MS, Grill SM, Ni D, Nagata K, Alkan SS, Subramaniam A, Unutmaz D. Genetic reprogramming of primary human T cells reveals functional plasticity in Th cell differentiation. J Immunol. 2003;171:3542–3549. doi: 10.4049/jimmunol.171.7.3542. [DOI] [PubMed] [Google Scholar]
- Suri-Payer E, Amar AZ, Thornton AM, Shevach EM. CD4 + CD25+ T cells inhibit both the induction and effector function of autoreactive T cells and represent a unique lineage of immunoregulatory cells. J Immunol. 1998;160:1212–1218. [PubMed] [Google Scholar]
- Testi R, D’Ambrosio D, De Maria R, Santoni A. The CD69 receptor: a multipurpose cell-surface trigger for hematopoietic cells. Immunol Today. 1994;15:479–483. doi: 10.1016/0167-5699(94)90193-7. [DOI] [PubMed] [Google Scholar]
- Tucker AN, Vore SJ, Luster MI. Suppression of B cell differentiation by 2,3,7,8-tetrachlorodibenzo-p-dioxin. Mol Pharmacol. 1986;29:372–377. [PubMed] [Google Scholar]
- Vazquez BN, Laguna T, Carabana J, Krangel MS, Lauzurica P. CD69 gene is differentially regulated in T and B cells by evolutionarily conserved promoter-distal elements. J Immunol. 2009;183:6513–6521. doi: 10.4049/jimmunol.0900839. [DOI] [PMC free article] [PubMed] [Google Scholar]


