CT angiography protocol changes designed to speed imaging and optimize arterial opacification are associated with significant overestimation on CT angiography source images of the region of restricted diffusion on concurrently obtained diffusion-weighted images, which may lead to inappropriate exclusion of patients who may benefit from treatment.
Abstract
Purpose:
To test whether the relationship between acute ischemic infarct size on concurrent computed tomographic (CT) angiography source images and diffusion-weighted (DW) magnetic resonance images is dependent on the parameters of CT angiography acquisition protocols.
Materials and Methods:
This retrospective study had institutional review board approval, and all records were HIPAA compliant. Data in 100 patients with anterior-circulation acute ischemic stroke and large vessel occlusion who underwent concurrent CT angiography and DW imaging within 9 hours of symptom onset were analyzed. Measured areas of hyperintensity at acute DW imaging were used as the standard of reference for infarct size. Information regarding lesion volumes and CT angiography protocol parameters was collected for each patient. For analysis, patients were divided into two groups on the basis of CT angiography protocol differences (patients in group 1 were imaged with the older, slower protocol). Intermethod agreement for infarct size was evaluated by using the Wilcoxon signed rank test, as well as by using Spearman correlation and Bland-Altman analysis. Multivariate analysis was performed to identify predictors of marked (≥20%) overestimation of infarct size on CT angiography source images.
Results:
In group 1 (n = 35), median hypoattenuation volumes on CT angiography source images were slightly underestimated compared with DW imaging hyperintensity volumes (33.0 vs 41.6 mL, P = .01; ratio = 0.83), with high correlation (ρ = 0.91). In group 2 (n = 65), median volume on CT angiography source images was much larger than that on DW images (94.8 vs 17.8 mL, P < .0001; ratio = 3.5), with poor correlation (ρ = 0.49). This overestimation on CT angiography source images would have inappropriately excluded from reperfusion therapy 44.4% or 90.3% of patients eligible according to DW imaging criteria on the basis of a 100-mL absolute threshold or a 20% or greater mismatch threshold, respectively. Atrial fibrillation and shorter time from contrast material injection to image acquisition were independent predictors of marked (≥20%) infarct size overestimation on CT angiography source images.
Conclusion:
CT angiography protocol changes designed to speed imaging and optimize arterial opacification are associated with significant overestimation of infarct size on CT angiography source images.
© RSNA, 2011
Supplemental material: http://radiology.rsna.org/lookup/suppl/doi:10.1148/radiol.11110896/-/DC1
Introduction
Although there remains no perfect imaging technique for delineating infarction size and extent in the acute setting, magnetic resonance (MR) imaging with diffusion-weighted (DW) imaging is widely considered the best imaging tool currently available. Compared with other imaging approaches available in the treatment setting, DW imaging possesses the highest accuracy for depicting acute brain ischemia (1), and its use for the evaluation of patients with acute ischemic stroke is endorsed by multiple expert panels (2,3). Moreover, DW imaging has been used to measure the infarct core, which is defined as irreversibly damaged tissue, in past (4,5) and ongoing randomized controlled clinical trials to select patients for reperfusion therapy by using the mismatch concept and has been used as the reference standard in lesion volume–comparison studies between computed tomographic (CT) and MR imaging (6,7). However, performing MR imaging in the acute setting is difficult outside of major medical centers, largely because of time constraints.
In contrast to MR imaging units, CT scanners are more widely available in the setting of immediate imaging in patients with acute stroke. Hypoattenuation at unenhanced CT in the acute setting has been shown to predict final infarct volume (8), but this test lacks sensitivity compared with DW imaging (1). CT angiography source images, on the other hand, have higher sensitivity in the detection of acute ischemia compared with unenhanced CT images (9), and the extent of hypoattenuation on CT angiography source images correlates with not only the volume of the region of hyperintensity at DW imaging (10,11) but also with final infarct volume in patients who undergo successful recanalization (12). It is thought that on CT angiography source images, hypoattenuation represents areas of the brain with depressed cerebral blood volume (CBV) in steady-state contrast conditions (13,14). Therefore, hypoattenuation on CT angiography source images offers the promise of reliable estimation of acute infarct size in the absence of DW imaging.
With the advent of multidetector scanners, many hospitals have modified their CT angiography acquisition protocols to maximize arterial-phase contrast enhancement (15,16). In our institution, we increased table speed and changed imaging direction to take full advantage of the new multisection scanners. However, faster image acquisition has been hypothesized to prevent sufficient delay time for a steady state between arterial and tissue contrast material to be reached, thus leading to overestimation of infarct size (17). In support of this latter idea, a recent study (18) in which CT angiography source images were compared with perfusion CT images for measurement of CBV and cerebral blood flow (CBF) demonstrated a better correlation of lesions on CT angiography source images with regions of depressed CBF.
We sought to test whether the relationship between ischemic lesion size on CT angiography source images and that on concurrently obtained DW MR images is dependent on the CT angiography acquisition protocol and to evaluate its potential effect on treatment decisions.
Materials and Methods
This study was approved by our institutional review board, and all records were compliant with the Health Insurance Portability and Accountability Act. We retrospectively examined the clinical and imaging data in consecutive patients with acute ischemic stroke who were admitted to our comprehensive stroke center between January 2000 and February 2010. Inclusion criteria were as follows: (a) anterior-circulation acute ischemic stroke; (b) both CT angiography and DW imaging performed within 9 hours of symptom onset and within 2 hours of each other; (c) large-vessel occlusion identified at CT angiography, up to and including third-order (M3) middle cerebral artery (MCA) branches; and (d) absence of reperfusion therapy between the CT angiography and DW imaging sessions. We identified 134 patients who fulfilled the imaging criteria and excluded 34 patients (11 patients with posterior-circulation strokes [because of streak artifacts potentially compromising CT image quality in these regions], six patients because of severe motion artifacts at MR imaging, 15 patients who had received intravenous tissue plasminogen activator [tPA {Alteplase; Genentech, South San Francisco, Calif}] between CT angiography and MR imaging, and two patients with prior infarcts in the same territory on the basis of evaluation of unenhanced CT scans and their medical records).
Imaging Protocol and Analysis
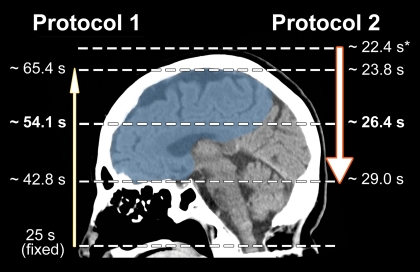
We divided patients into two groups on the basis of changes in the CT angiography protocol that were made at our institution in 2005 (patients in group 1 were imaged with protocol 1, and patients in group 2 were imaged with protocol 2 [Table 1]). Patients in group 2 were imaged by using the faster CT angiography protocol. Patients in group 1 were imaged with a LightSpeed Plus (four-section), a LightSpeed QX/I (four-section), or a LightSpeed 16 (16-section) CT scanner; for patients in group 2, a LightSpeed 16 or a LightSpeed VCT (64-section) CT scanner was used (all scanners were from GE Medical Systems, Milwaukee, Wis). Notably, protocol 1 (used from 2000 to 2004) involved a slower table speed, imaging at a fixed delay following the start of contrast material administration, and scanning in a caudocranial direction. Protocol 2 (used from 2005 to 2010) involved a table speed that was up to 10 times faster, SmartPrep triggering at the aortic arch, and scanning in a craniocaudal direction. These changes resulted in imaging the anterior circulation territory in less than half the time after contrast material injection than with protocol 1 (Fig 1).
Table 1.
CT Angiography Protocols
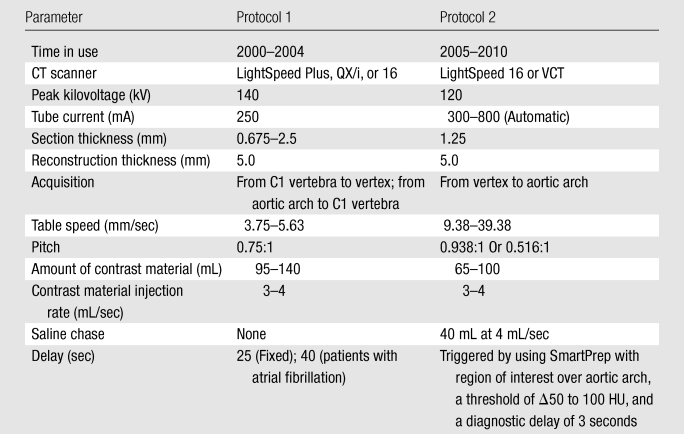
Figure 1:
Scheme of image acquisition with protocols 1 and 2. Blue = anterior circulation territory. Note the differences in image direction (caudocranial vs craniocaudal), imaging starting point (C1 vertebral body vs vertex), delay time (25-second fixed delay vs SmartPrep), and table speed (3.75–5.63 vs 9.38–39.38 mm/sec), which result in different mean imaging times for the anterior circulation territory. ∗ = Monitoring delay (10 seconds) plus trigger time plus diagnostic delay (3 seconds).
For both groups, MR imaging examinations were performed with a 1.5-T whole-body unit (Signa; GE Medical Systems). DW imaging was performed by using a single-shot echo-planar spin-echo sequence. Five images per section were acquired at b = 0 sec/mm2, followed by five images at b = 1000 sec/mm2 in six directions, for a total of 35 images per section. Imaging parameters were as follows: repetition time msec/echo time msec, 5000/80–110; field of view, 22 cm; matrix, 128 × 128 zero-filled to 256 × 256; and section thickness, 5 mm with a 1-mm gap. Only minimal changes (introduction of two 180° radiofrequency pulses to minimize eddy current warping and varying the number of images per section between 28 and 35) were made to the DW imaging protocol over the study period. Ischemic lesions on CT angiography source images and DW images were outlined independently by two neuroradiologists (P.W.S [reader 1] and A.J.Y. [reader 2], with 18 and 7 years of experience, respectively) using dedicated software (Analyze; Biomedical Imaging Resource, Mayo Foundation, Rochester, Minn). For CT angiography source images, window and level settings were adjusted at the discretion of the readers to increase the contrast between normal and ischemic brain. Studies were viewed in random order, and readers were blinded to all patient information except side of stroke involvement. Infarct volumes were calculated in milliliters.
CT Angiography Protocol Variables and Effect on Clinical Management
Various CT angiography acquisition parameters (Table 2) were collected and were incorporated into the statistical analysis, including the contrast material volume and the injection rate, which determine the shape of the tissue concentration–time curves. We also calculated the time to imaging of the anterior circulation territory from the start of contrast material injection by measuring the delay time from contrast material injection to imaging, the table speed, and the distance from the imaging starting point to the anterior circulation territory. For protocol 1, this interval was defined as delay time plus scan duration from the C1 vertebra to the middle of the anterior circulation territory (halfway between the temporal pole and the vertex). For protocol 2, it was defined as monitoring delay (10 seconds) plus trigger time plus diagnostic delay (3 seconds) plus scan duration from the vertex to the middle of the anterior circulation territory (Fig 1). Also, because cardiac output has an influence on the tissue concentration–time curve, electrocardiographic data obtained at the time of patient admission were evaluated for the presence of atrial fibrillation.
Table 2.
Predictors of Infarct Overestimation of 20% or Greater on CT Angiography Source Images
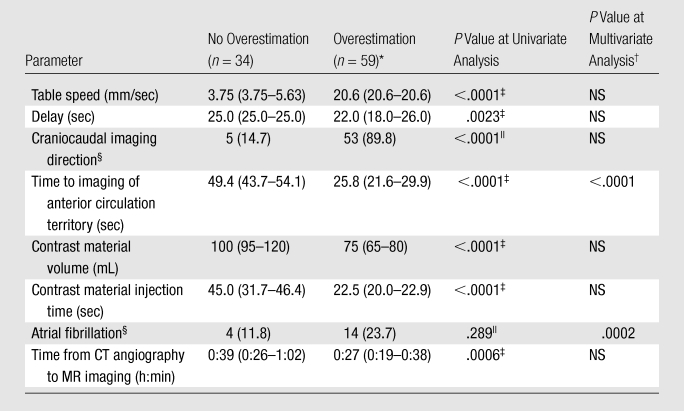
Note.—Unless otherwise specified, data are medians, with interquartile ranges (IQRs) in parentheses.
Overestimation was defined as a difference of 20% or greater between infarct volume on CT angiography source images and that on DW images.
Area under the curve for logistic regression analysis was 0.922 (95% confidence interval [CI]: 0.847, 0.967). NS = nonsignificant.
Calculated with the Mann-Whitney U test.
Data are numbers of patients, with percentages in parentheses.
Calculated with the Fisher exact test.
The potential effect on clinical management was assessed by using the two main imaging approaches to patient selection for reperfusion therapy: (a) exclusion on the basis of infarct size greater than one-third of the MCA territory (100 mL) and (b) inclusion on the basis of a 20% or greater mismatch between infarct size at perfusion-weighted imaging and infarct size at DW imaging (or, alternatively, perfusion abnormality at perfusion CT and infarct size on CT angiography source images) (4,5,19–21). We calculated the proportion of patients with a lesion size greater than 100 mL on CT angiography source images and an abnormal region of less than 100 mL at DW imaging to identify those who would be mistakenly excluded from therapy. We also used a 70-mL threshold on the basis of recent data (22–24). Second, we calculated the proportion of patients in whom the infarct seen on DW images was overestimated on CT angiography source images by 20% or greater to identify those in whom a hypothetical 20% mismatch could be mistakenly considered as absent.
Statistical Analysis
All statistical analyses were performed by using software (MedCalc, version 11.2.1; MedCalc Software, Mariakerke, Belgium). P < .05 was considered to indicate a significant difference. Demographic, imaging, and clinical data were compared between groups by using the Mann-Whitney U test and were presented as medians and IQRs. Categoric data were compared by using the Fisher exact test and were presented as percentages.
Interrater agreement for CT angiography source images and DW images was examined by using the intraclass correlation coefficient, as well as Bland-Altman analysis (25). We sought to confirm previous reports of high interrater agreement for DW imaging in the setting of acute ischemic stroke (26,27) and to compare the interrater agreement for DW imaging to that for CT angiography source images.
Within-group comparisons of lesion volumes on CT angiography source images and lesion volumes at DW imaging were performed by using the Wilcoxon signed rank test (paired analysis). Intermethod agreement between CT angiography source images and DW images was further examined by using Bland-Altman analysis (25), as well as Spearman rank correlation. For relative comparisons, only instances in which the infarct volume at DW imaging was 5 mL or greater were considered because small volumes are prone to measurement errors (28).
Finally, the effects of the aforementioned protocol-related parameters were analyzed in a stepwise multivariate logistic regression analysis to determine predictors of marked overestimation of lesions on CT angiography source images (≥20% of the DW imaging lesion) and in a multivariate linear regression analysis to evaluate the correlation of these parameters with absolute (or relative) overestimation on CT angiography source images. Only variables with a univariate P value of less than .1 were included.
Results
Among 100 patients who satisfied the inclusion criteria, three (3%) had an isolated extracranial internal carotid artery (ICA) occlusion, 29 (29%) had a terminal ICA occlusion with or without MCA M1 segment occlusion, 53 (53%) had an MCA M1 segment occlusion, 14 (14%) had an M2 segment occlusion, and one (1%) had an M3 segment occlusion. Thirty-three patients (33%) received intravenous tPA before imaging was performed. These patients were admitted to the hospital through a “telestroke” service, and intracranial hemorrhage was excluded at the referring hospital by means of unenhanced CT. Median time to CT imaging was 4 hours 1 minute (IQR, 2:36–5:04). Median time between CT angiography and DW imaging was 31 minutes (IQR, 22–41 minutes). Twenty-one patients (21%) were found to have atrial fibrillation just before imaging.
Clinical, demographic, and imaging data are given in Table 3. Between patients imaged with protocol 1 (group 1; n = 35) and those imaged with protocol 2 (group 2; n = 65), we observed no difference in age, male sex, right hemisphere involvement, median NIHSSS, level of occlusion, time from symptom onset to CT imaging, atrial fibrillation, and administration of intravenous tPA before imaging. The time from CT angiography to MR imaging acquisition was 40 minutes in group 1, versus 27 minutes in group 2 (P < .0001). However, the time to MR imaging and DW imaging infarct volume did not correlate significantly (ρ = 0.13 [P = .17] for all patients, ρ = 0.008 [P = .96] for group 1, and ρ = 0.28 [P = .82] for group 2).
Table 3.
Comparison of Clinical and Demographic Characteristics between Patients Imaged with Protocol 1 and Those Imaged with Protocol 2
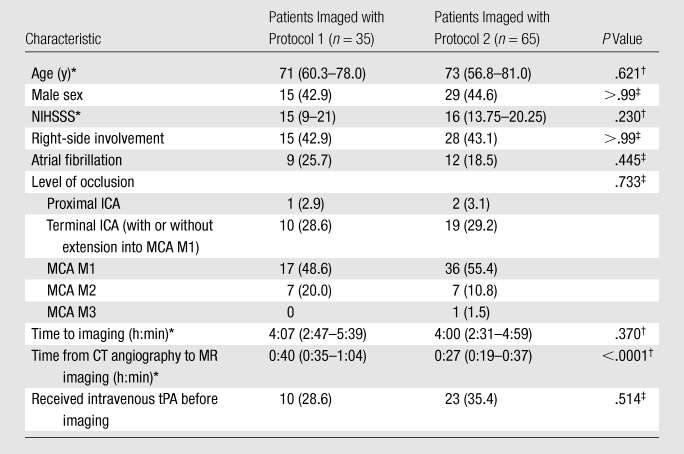
Note.—Unless otherwise indicated, data are numbers of patients, with percentages in parentheses. NIHSSS = National Institutes of Health Stroke Scale Score.
Data are medians, with IQRs in parentheses.
Calculated with the Mann-Whitney U test.
Calculated with the Fisher exact test.
Table 4 shows the results of comparison of regions of hypoattenuation on CT angiography source images and hyperintensity volumes at DW imaging according to protocol. Volume on CT angiography source images was slightly smaller than the volume at DW imaging in group 1 (33.0 vs 41.6 mL, P = .01) but was significantly larger in group 2 (94.8 vs 17.8 mL, P = .0001 [Fig 2]). The median ratio of volume on CT angiography source images to volume at DW imaging was 0.83 in group 1, versus 3.5 in group 2 (P < .0001). Patients with an infarct volume at DW imaging of less than 100 mL (or < 70 mL) were found to have a volume on CT angiography source images of greater than 100 mL (or > 70 mL) 44.4% (or 59.6%) of the time in group 2, but no such overestimation was observed in group 1 (P < .0001). Finally, volume at DW imaging was overestimated by at least 20% in 90.3% of patients in group 2, versus in 9.7% of patients in group 1 (P < .0001).
Table 4.
Imaging Characteristics of Patients Imaged with Protocol 1 and Those Imaged with Protocol 2
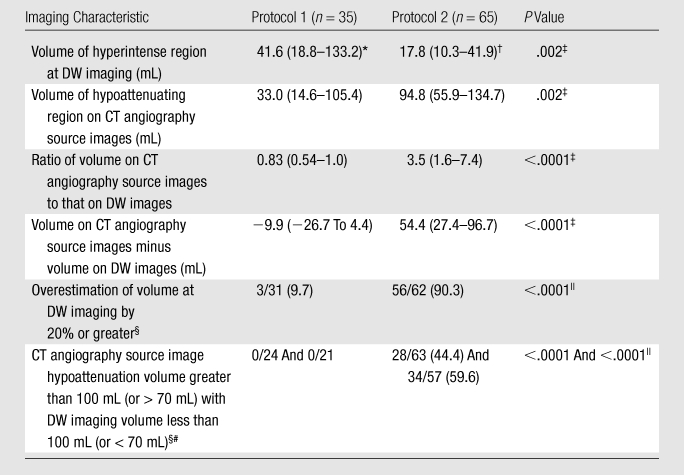
Note.—Unless otherwise specified, data are medians, with IQRs in parentheses.
P = .01 (Wilcoxon signed rank test) for comparison with volume on CT angiography source images.
P < .0001 (Wilcoxon signed rank test) with volume on CT angiography source images.
Calculated with the Mann-Whitney U test.
Data are numbers of patients, with percentages in parentheses.
Calculated with the Fisher exact test.
In patients with a DW imaging volume of less than 100 mL (or < 70 mL).
Figure 2:
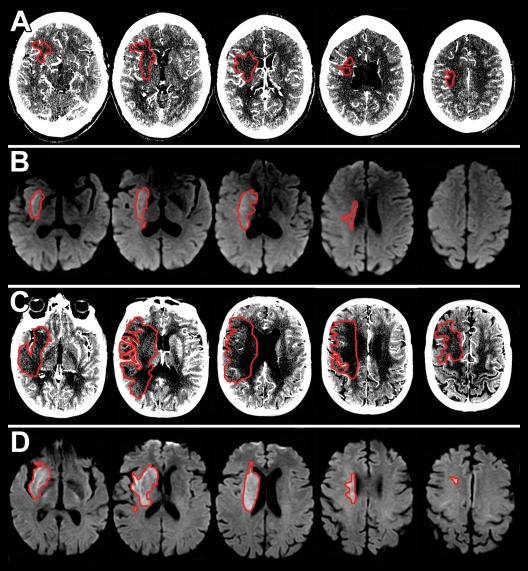
Axial, A, C, CT angiography source images and, B, D, DW images. Ischemic lesions are outlined in red. A, B, Images in 65-year-old woman with NIHSSS of 16 and right ICA and MCA M1 occlusion imaged with protocol 1. A, CT angiography source images were acquired 5 hours 20 minutes after symptom onset, and, B, DW images were acquired 20 minutes after the CT examination. The hypoattenuating area in A (13.1 mL) matches the area of decreased diffusion in B (15.2 mL). C, D, Images in 66-year-old woman with NIHSSS of 16 and right MCA M1 occlusion imaged with protocol 2. C, CT angiography source images were acquired 4 hours 30 minutes after symptom onset, and, D, DW images were acquired 23 minutes after the CT examination. The hypoattenuating area in C (159.5 mL) is much larger than the lesion in D (25.3 mL).
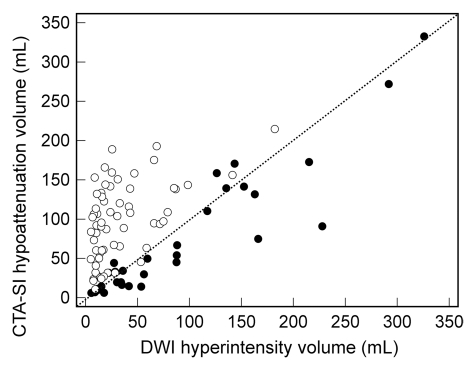
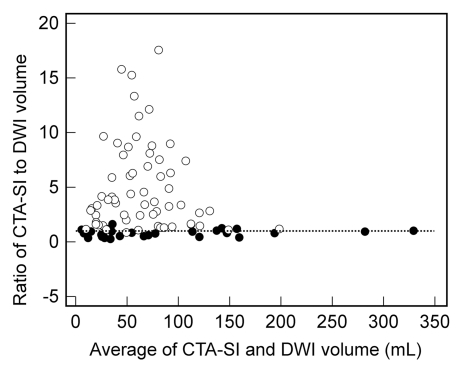
The correlation between CT angiography source images and DW images was significantly stronger for group 1 than for group 2 (ρ = 0.91 vs 0.49, P < .001 [Fig 3a]). At Bland-Altman analysis (Fig 3b), the mean ratio of infarct volume on CT angiography source images to volume at DW imaging was 0.82 (limits of agreement: 0.18,1.46) for group 1. In contrast, the mean ratio for group 2 was 5.0 (limits of agreement: −2.9,12.9). Both the means and the limits of agreement were significantly different between the protocols (P < .0001).
Figure 3a:
(a) Scatterplot shows correlation between infarct volume on CT angiography source images (CTA-SI) and that on DW images (DWI) for protocol 1 (●) (ρ = 0.912) and protocol 2 (○) (ρ = 0.494). (b) Bland-Altman plot shows agreement between infarct volume on CT angiography source images and that on DW images for protocol 1 (●) (mean, 0.82) and protocol 2 (○) (mean, 5.0). Dotted line = line of equality.
Figure 3b:
(a) Scatterplot shows correlation between infarct volume on CT angiography source images (CTA-SI) and that on DW images (DWI) for protocol 1 (●) (ρ = 0.912) and protocol 2 (○) (ρ = 0.494). (b) Bland-Altman plot shows agreement between infarct volume on CT angiography source images and that on DW images for protocol 1 (●) (mean, 0.82) and protocol 2 (○) (mean, 5.0). Dotted line = line of equality.
Between patients with and those without marked (≥20%) infarct volume overestimation on CT angiography source images, there were statistically significant differences in table speed, delay time, imaging direction (craniocaudal vs caudocranial), time to imaging of the anterior circulation territory, contrast material volume, contrast material injection duration, and time from CT angiography to DW imaging (P < .001 for all; Table 2). In general, image acquisition was already completed with protocol 2 before it had even started with protocol 1.
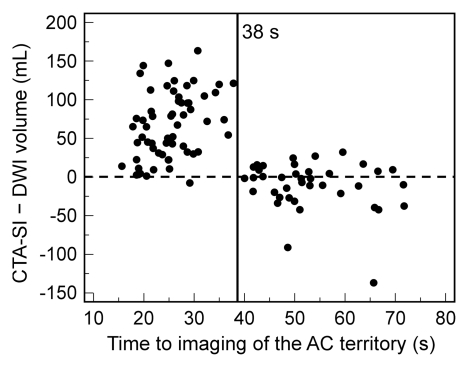
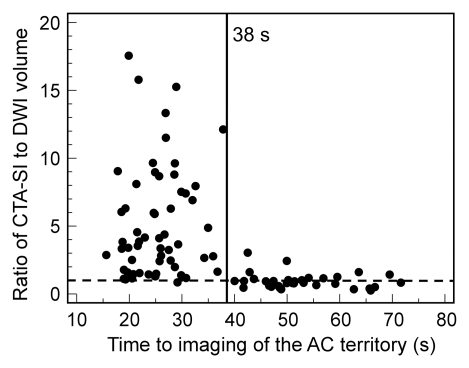
Although atrial fibrillation was not a predictor of marked overestimation for the entire cohort (P = .289), it was predictive in patients imaged with protocol 1 (P = .008), in which a fixed delay was used. In multivariate logistic regression, a shorter time to imaging of the anterior circulation territory (odds ratio: 0.80; 95% CI: 0.74, 0.88) and the presence of atrial fibrillation (odds ratio: 447; 95% CI: 18.2, 11007) were independent predictors of marked overestimation (Table 2). This was also confirmed by multivariate linear regression analysis (Table E1 [online]), where a negative correlation was found between time to imaging of the anterior circulation territory and both absolute difference and ratio between infarct volume on CT angiography source images and that on DW images (coefficients, −2.39 ± 0.30 [standard deviation] and −0.138 ± 0.02, respectively; P < .001). The presence of atrial fibrillation correlated positively with both absolute difference and ratio between infarct volume on CT angiography source images and that on DW images (coefficients, 30.49 ± 11.1 and 2.24 ± 0.92, respectively; P < .02). Finally, a time of 38 seconds to imaging of the middle of the anterior circulation territory demonstrated good discrimination between good and poor agreement between infarct volume on CT angiography source images and that on DW images (Fig 4).
Figure 4a:
Graphs show (a) absolute difference and (b) ratio between infarct volume on CT angiography source images (CTA-SI) and that on DW images (DWI) versus mean time to imaging of the anterior circulation (AC) territory. At imaging times of less than 38 seconds, volume is overestimated at DW imaging in the majority of cases. Dashed line = line of equality.
Figure 4b:
Graphs show (a) absolute difference and (b) ratio between infarct volume on CT angiography source images (CTA-SI) and that on DW images (DWI) versus mean time to imaging of the anterior circulation (AC) territory. At imaging times of less than 38 seconds, volume is overestimated at DW imaging in the majority of cases. Dashed line = line of equality.
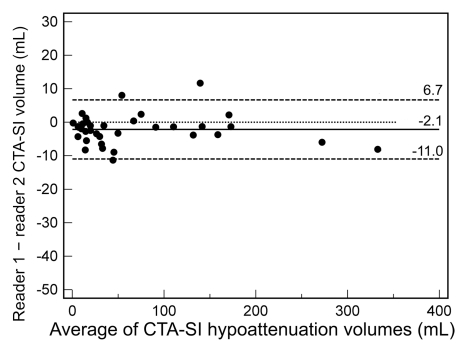
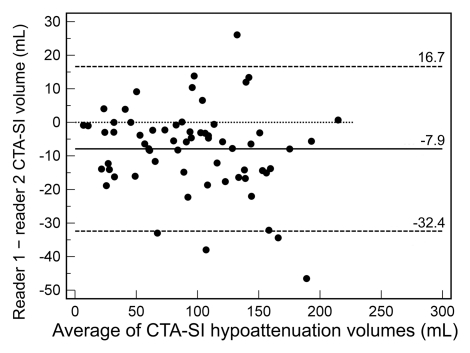
The intraclass correlation coefficient for CT angiography source images in protocol 1 was 0.998 (95% CI: 0.995, 0.999), while it was 0.958 (95% CI: 0.882, 0.980) for protocol 2 (P < .0001). In Bland-Altman analysis (Fig 5) for protocol 1, reader 1 underestimated infarct volume on CT angiography source images by a mean of 2.1 mL compared with reader 2 (limits of agreement [95% CI for differences]: 6.7, −11.0 mL). For protocol 2, the mean difference between reader 1 and 2 was −7.9 mL (limits of agreement: 16.7, −32.4 mL). Both mean differences and limits of agreement were significantly different between the two CT angiography protocols (P < .001).
Figure 5a:
Bland-Altman plots of interrater agreement for CT angiography source images (CTA-SI) according to protocol show that (a) protocol 1 resulted in good agreement, with a mean difference of −2.1 mL and narrow limits of agreement (6.7, −11.0 mL), while with (b) protocol 2, the mean difference was −7.9 mL, with limits of agreement of 16.7, −32.4 mL. Dotted line = line of equality.
Figure 5b:
Bland-Altman plots of interrater agreement for CT angiography source images (CTA-SI) according to protocol show that (a) protocol 1 resulted in good agreement, with a mean difference of −2.1 mL and narrow limits of agreement (6.7, −11.0 mL), while with (b) protocol 2, the mean difference was −7.9 mL, with limits of agreement of 16.7, −32.4 mL. Dotted line = line of equality.
The intraclass correlation coefficient for DW imaging in group 1 was 0.996 (95% CI: 0.992, 0.998), while it was 0.995 (95% CI: 0.991, 0.997) for group 2 (P > .05). Bland-Altman analysis (Fig E1 [online]) demonstrated good agreement between reader 1 and reader 2 for both groups, with mean differences and limits of agreement similar to those for CT angiography source images obtained with protocol 1.
Discussion
In patients with anterior-circulation acute ischemic stroke who are imaged within 9 hours of symptom onset, the extent of hypoattenuation on CT angiography source images varies with the acquisition protocol. Specifically, we demonstrated that hypoattenuating volumes on CT angiography source images obtained with our newer, rapid CT angiography protocol represented significantly overestimated volumes of restricted diffusion at concurrent DW imaging, while analysis of images obtained with our older, slower protocol revealed reasonable agreement and no consistent overestimation compared with DW imaging infarct volumes. Interrater agreement was worse with the new protocol than with the old protocol. Additionally, atrial fibrillation, likely a marker for reduced cardiac output, and shorter time from contrast material injection to image acquisition of the ischemic territory independently predicted significant lesion overestimation on CT angiography source images.
If confirmed, these findings would have major implications for clinical practices that use CT angiography source images to evaluate brain parenchyma and estimate infarct core size and for clinical trials (29–31) that are designed to select patients for thrombolysis on the basis of a mismatch between infarct size on CT angiography source images and mean transit time abnormality on perfusion CT images. In particular, infarct overestimation on CT angiography source images could lead to inappropriate exclusion of patients who may benefit from treatment. With our current, rapid CT angiography protocol, approximately 45%–60% of patients would have been inappropriately excluded from treatment on the basis of absolute thresholds. It needs to be stated, however, that neither the mismatch concept nor absolute infarct size at DW imaging is currently recommended outside approved clinical trials as a method of selecting patients for treatment. Importantly, many centers are using similar protocols to ours, including protocols that involve craniocaudal imaging (15), a shortened delay time (16), and increased table speed (32).
Our finding that evaluation of acute ischemia with CT angiography source images is protocol dependent reflects the pathophysiology of ischemic stroke. While DW imaging images the differences in Brownian motion of protons in water, CT angiography source images provide an approximation of CBV under the assumption of a steady state between arterial and parenchymal contrast material (13,14). Attenuation values of brain tissue on CT angiography source images are directly proportional to the amount of contrast material that has arrived within the parenchyma at the time of imaging. When a proximal cerebral artery is occluded, the affected territory is supplied by the collateral circulation, prolonging contrast material arrival time even in the setting of sufficient blood flow. Earlier CT angiography image acquisition prevents contrast material from traversing the collateral vessels and reaching the distal bed, thereby increasing the area of hypoattenuation. This explains why time to imaging was an independent predictor of volume overestimation on CT angiography source images in this study. Similarly, atrial fibrillation, as a surrogate for low cardiac output, creates a situation where blood flow via collateral vessels is delayed. Insufficient delay time is also the most likely explanation for the findings of Sharma et al (18), who concluded that CT angiography source images appear to be CBF weighted instead of CBV weighted. In their study, they used a 5–10-second delay time, which, according to our data, would be too short. In contrast, Wittkamp et al (33) triggered CT image acquisition at peak enhancement of the superior sagittal sinus, ensuring sufficient delay times. Furthermore, they performed CT angiography after perfusion CT, so that contrast material from the perfusion CT study had enough time to reach the ischemic bed by the time of CT angiography image acquisition. As a result, they found good correlation between CT angiography source images and CBV. Results of initial studies (10,11) demonstrating a close approximation in infarct size between CT angiography source images and DW images also likely used a sufficient delay time. The fact that this issue was not detected earlier probably relates to the inability of older CT scanners to image at speeds similar to those of current scanners. On the basis of our findings, we suggest that when CT angiography source images are used to evaluate the parenchyma during ischemic stroke, a protocol that is empirically validated to provide a good estimate of the infarct core be established at each institution.
Unfortunately, there are trade-offs between vessel and parenchymal imaging with CT angiography. The primary goals of our CT angiography protocol optimization were to speed evaluation and to improve visualization of the intracranial arteries, allowing for better characterization of vessel occlusions, stenoses, and aneurysms. The longer delay required for parenchymal evaluation would prevent vessel opacification in the early arterial phase. To solve this problem, two protocols could be implemented, one performed early for optimal visualization of the intracranial arteries, and a second performed with an appropriate delay to evaluate the brain parenchyma. Our data suggest that a delay of at least 40 seconds may be sufficient. While we found an underestimation of DW imaging volumes using such a delay, the differences were relatively small, and there remained a strong correlation between the two techniques such that CT angiography source images acquired with this delay provided a reasonable approximation of the infarct core.
Our study limitations included its retrospective design. Therefore, there was a shorter time between CT angiography and DW imaging in the protocol 2 cohort, but this was not an independent predictor of lesion overestimation. Because DW imaging volumes were smaller in group 2 despite group 1 and group 2 having similar NIHSSSs, we cannot exclude DW imaging infarct underestimation in this group. However, given the minimal variations in DW imaging protocol and the use of the same MR imaging unit throughout the study period, this possibility seems unlikely. An alternative explanation for the difference in DW imaging infarct size is that despite similar NIHSSSs in the two groups, patients in group 2 had better collateral vessels. It has been shown that with proximal occlusions, the strength of the collateral vessels is inversely correlated with the size of the infarct core (23,34). However, if the collateral vessels were indeed better in patients in group 2, this difference would be unlikely to explain the significant overestimation on CT angiography source images of the DW imaging infarct volume seen in these patients. On the contrary, better collateral blood flow would be expected to improve the correlation between CT angiography source image and DW imaging lesion volumes by allowing the contrast material to reach the ischemic bed more quickly. Owing to the static nature of CT angiography imaging, we could not assess the strength of the collateral circulation (eg, timing and extent) in our patient cohort.
Another limitation was our use of DW imaging as the reference standard for assessment of the infarct core. It has been demonstrated that hyperintense regions at DW imaging can reverse themselves (35–38), but recently (39) this was shown to be a rare event, with insignificant volumes of reversal when tissue shrinkage was taken into account. Moreover, such reversal at DW imaging does not improve clinical outcome (37,40), and delayed regrowth into previously affected areas occurs (35,36), even with successful reperfusion (41,42). Second, areas of restricted diffusion in acute stroke have been shown to represent several pathophysiologic processes (43,44), such as tissue acidosis (45), CBF above the viability threshold (46,47), and cerebral metabolic rate of oxygen (CMRO2) below the viability threshold (48). However, because of the possibility of spontaneous reperfusion in acute ischemic stroke, CMRO2 better differentiates between irreversible and reversible neuronal damage than CBF (49,50). Spontaneous reperfusion also challenges the use of MR imaging– or CT-measured CBV as an alternative to estimating the infarct core at DW imaging. With reperfusion of the core, CBV may be normal despite the presence of irreversibly damaged tissue (51). Moreover, lesion volume at acute DW imaging correlates highly with that at flumazenil positron emission tomography (52), a marker for neuronal integrity (53), and is similar to final infarct volume in patients with successful recanalization but not in patients with persistent occlusion (12,54). Despite these limitations, DW imaging is widely regarded as the best imaging modality for estimating the infarct core in the acute setting.
Finally, we cannot exclude that reperfusion occurred between CT angiography and MR imaging. We excluded patients in whom thrombolytic agents were administered between CT angiography and MR imaging, but approximately one-third of patients received intravenous tPA before CT angiography. We included only patients with occlusions that were identifiable at CT angiography because a high proportion of patients with proximal occlusions will have a mismatch (55) and because proximal occlusions are poorly responsive to intravenous tPA (56). The time window of 9 hours was chosen because it is the longest time after stroke where there is clinical evidence to support a beneficial treatment effect in patients who are selected on the basis of imaging findings (4,5).
In summary, CT angiography protocol changes designed to speed imaging and optimize arterial opacification are associated with significant overestimation on CT angiography source images of the region of restricted diffusion at concurrent DW imaging, which may lead to inappropriate exclusion of patients who may benefit from treatment. Significant overestimation occurs with shortened time from contrast material injection to imaging of the ischemic territory and with atrial fibrillation.
Advances in Knowledge.
In a consecutive series of 100 patients with acute ischemic stroke, infarct estimation on CT angiography source images was highly dependent on the CT angiography acquisition protocol; the delay from contrast material injection to imaging of the anterior circulation territory (P < .0001) and atrial fibrillation (P = .0002) were independent predictors of significant infarct overestimation on CT angiography source images compared with estimation on diffusion-weighted (DW) images.
As compared with CT angiography source images acquired by using relatively slower CT scanners, when source images are acquired by using protocols adapted to faster, multisection CT scanners, the reduced time from contrast material injection to imaging leads to overestimation of infarct size.
The observed infarct overestimation may be large (ratio of volume on CT angiography source images to volume on DW images, 3.5; median overestimation, 54 mL), and, as compared with patient selection performed by using DW imaging, may lead to inappropriate treatment exclusion in 44.4%–90.3% of patients.
Implications for Patient Care.
The use of CT angiography source images to estimate the size of irreversible tissue injury may lead to inappropriate exclusion of patients from reperfusion therapy by incorrectly suggesting the presence of a large infarct.
The use of CT angiography source imaging requires technical standardization before it can be used as a surrogate for DW imaging.
Disclosures of Potential Conflicts of Interest: B.P. No potential conflicts of interest to disclose. P.W.S. No potential conflicts of interest to disclose. R.H. No potential conflicts of interest to disclose. Z.A.C. No potential conflicts of interest to disclose. M.H.L. Financial activities related to the present article: received research support from GE Healthcare and consulting fees or honoraria from CoAxia, Millennium Pharmaceuticals, and GE Healthcare. Financial activities not related to the present article: none to disclose. Other relationships: none to disclose. J.A.H. Financial activities related to the present article: none to disclose. Financial activities not related to the present article: has served as a consultant for CareFusion, Atrius, and Phillips; receives royalties from CareFusion; holds stock or stock options in IntraTech and N Focus. Other relationships: none to disclose. R.G.G. No potential conflicts of interest to disclose. A.J.Y. Financial activities related to the present article: none to disclose. Financial activities not related to the present article: has a grant or a grant pending with Penumbra. Other relationships: none to disclose.
Supplementary Material
Received May 2, 2011; revision requested June 1; revision received July 27; accepted August 11; final version accepted August 30. A.J.Y.
Funding: This research was supported by the National Institutes of Health (grants NS050041 and NS051343-01A2).
supported by Neuroradiology Education and Research Foundation/Boston Scientific Fellowship in Cerebrovascular Disease Research.
Abbreviations:
- CBF
- cerebral blood flow
- CBV
- cerebral blood volume
- CI
- confidence interval
- DW
- diffusion weighted
- ICA
- internal carotid artery
- IQR
- interquartile range
- MCA
- middle cerebral artery
- NIHSSS
- National Institutes of Health Stroke Scale Score
- tPA
- tissue plasminogen activator
References
- 1.Chalela JA, Kidwell CS, Nentwich LM, et al. Magnetic resonance imaging and computed tomography in emergency assessment of patients with suspected acute stroke: a prospective comparison. Lancet 2007;369(9558):293–298 [DOI] [PMC free article] [PubMed] [Google Scholar]
- 2.Latchaw RE, Alberts MJ, Lev MH, et al. Recommendations for imaging of acute ischemic stroke: a scientific statement from the American Heart Association. Stroke 2009;40(11):3646–3678 [DOI] [PubMed] [Google Scholar]
- 3.Schellinger PD, Bryan RN, Caplan LR, et al. Evidence-based guideline: the role of diffusion and perfusion MRI for the diagnosis of acute ischemic stroke—report of the Therapeutics and Technology Assessment Subcommittee of the American Academy of Neurology. Neurology 2010;75(2):177–185 [DOI] [PMC free article] [PubMed] [Google Scholar]
- 4.Hacke W, Albers G, Al-Rawi Y, et al. The Desmoteplase in Acute Ischemic Stroke Trial (DIAS): a phase II MRI-based 9-hour window acute stroke thrombolysis trial with intravenous desmoteplase. Stroke 2005;36(1):66–73 [DOI] [PubMed] [Google Scholar]
- 5.Furlan AJ, Eyding D, Albers GW, et al. Dose Escalation of Desmoteplase for Acute Ischemic Stroke (DEDAS): evidence of safety and efficacy 3 to 9 hours after stroke onset. Stroke 2006;37(5):1227–1231 [DOI] [PubMed] [Google Scholar]
- 6.Wintermark M, Meuli R, Browaeys P, et al. Comparison of CT perfusion and angiography and MRI in selecting stroke patients for acute treatment. Neurology 2007;68(9):694–697 [DOI] [PubMed] [Google Scholar]
- 7.Wintermark M, Flanders AE, Velthuis B, et al. Perfusion-CT assessment of infarct core and penumbra: receiver operating characteristic curve analysis in 130 patients suspected of acute hemispheric stroke. Stroke 2006;37(4):979–985 [DOI] [PubMed] [Google Scholar]
- 8.von Kummer R, Bourquain H, Bastianello S, et al. Early prediction of irreversible brain damage after ischemic stroke at CT. Radiology 2001;219(1):95–100 [DOI] [PubMed] [Google Scholar]
- 9.Camargo EC, Furie KL, Singhal AB, et al. Acute brain infarct: detection and delineation with CT angiographic source images versus nonenhanced CT scans. Radiology 2007;244(2):541–548 [DOI] [PubMed] [Google Scholar]
- 10.Schramm P, Schellinger PD, Fiebach JB, et al. Comparison of CT and CT angiography source images with diffusion-weighted imaging in patients with acute stroke within 6 hours after onset. Stroke 2002;33(10):2426–2432 [DOI] [PubMed] [Google Scholar]
- 11.Schramm P, Schellinger PD, Klotz E, et al. Comparison of perfusion computed tomography and computed tomography angiography source images with perfusion-weighted imaging and diffusion-weighted imaging in patients with acute stroke of less than 6 hours’ duration. Stroke 2004;35(7):1652–1658 [DOI] [PubMed] [Google Scholar]
- 12.Lev MH, Segal AZ, Farkas J, et al. Utility of perfusion-weighted CT imaging in acute middle cerebral artery stroke treated with intra-arterial thrombolysis: prediction of final infarct volume and clinical outcome. Stroke 2001;32(9):2021–2028 [DOI] [PubMed] [Google Scholar]
- 13.Hamberg LM, Hunter GJ, Kierstead D, Lo EH, Gilberto González R, Wolf GL. Measurement of cerebral blood volume with subtraction three-dimensional functional CT. AJNR Am J Neuroradiol 1996;17(10):1861–1869 [PMC free article] [PubMed] [Google Scholar]
- 14.Hunter GJ, Hamberg LM, Ponzo JA, et al. Assessment of cerebral perfusion and arterial anatomy in hyperacute stroke with three-dimensional functional CT: early clinical results. AJNR Am J Neuroradiol 1998;19(1):29–37 [PMC free article] [PubMed] [Google Scholar]
- 15.Smith WS, Roberts HC, Chuang NA, et al. Safety and feasibility of a CT protocol for acute stroke: combined CT, CT angiography, and CT perfusion imaging in 53 consecutive patients. AJNR Am J Neuroradiol 2003;24(4):688–690 [PMC free article] [PubMed] [Google Scholar]
- 16.Murphy BD, Fox AJ, Lee DH, et al. Identification of penumbra and infarct in acute ischemic stroke using computed tomography perfusion-derived blood flow and blood volume measurements. Stroke 2006;37(7):1771–1777 [DOI] [PubMed] [Google Scholar]
- 17.Konstas AA, Goldmakher GV, Lee TY, Lev MH. Theoretic basis and technical implementations of CT perfusion in acute ischemic stroke. I. Theoretic basis. AJNR Am J Neuroradiol 2009;30(4):662–668 [DOI] [PMC free article] [PubMed] [Google Scholar]
- 18.Sharma M, Fox AJ, Symons S, Jairath A, Aviv RI. CT angiographic source images: flow- or volume-weighted? AJNR Am J Neuroradiol 2011;32(2):359–364 [DOI] [PMC free article] [PubMed] [Google Scholar]
- 19.Albers GW, Thijs VN, Wechsler L, et al. Magnetic resonance imaging profiles predict clinical response to early reperfusion: the Diffusion and Perfusion Imaging Evaluation for Understanding Stroke Evolution (DEFUSE) study. Ann Neurol 2006;60(5):508–517 [DOI] [PubMed] [Google Scholar]
- 20.Schellinger PD, Thomalla G, Fiehler J, et al. MRI-based and CT-based thrombolytic therapy in acute stroke within and beyond established time windows: an analysis of 1210 patients. Stroke 2007;38(10):2640–2645 [DOI] [PubMed] [Google Scholar]
- 21.Köhrmann M, Jüttler E, Fiebach JB, et al. MRI versus CT-based thrombolysis treatment within and beyond the 3 h time window after stroke onset: a cohort study. Lancet Neurol 2006;5(8):661–667 [DOI] [PubMed] [Google Scholar]
- 22.Sanák D, Nosál’ V, Horák D, et al. Impact of diffusion-weighted MRI-measured initial cerebral infarction volume on clinical outcome in acute stroke patients with middle cerebral artery occlusion treated by thrombolysis. Neuroradiology 2006;48(9):632–639 [DOI] [PubMed] [Google Scholar]
- 23.Yoo AJ, Verduzco LA, Schaefer PW, Hirsch JA, Rabinov JD, González RG. MRI-based selection for intra-arterial stroke therapy: value of pretreatment diffusion-weighted imaging lesion volume in selecting patients with acute stroke who will benefit from early recanalization. Stroke 2009;40(6):2046–2054 [DOI] [PMC free article] [PubMed] [Google Scholar]
- 24.Yoo AJ, Barak ER, Copen WA, et al. Combining acute diffusion-weighted imaging and mean transmit time lesion volumes with National Institutes of Health Stroke Scale Score improves the prediction of acute stroke outcome. Stroke 2010;41(8):1728–1735 [DOI] [PubMed] [Google Scholar]
- 25.Bland JM, Altman DG. Statistical methods for assessing agreement between two methods of clinical measurement. Lancet 1986;1(8476):307–310 [PubMed] [Google Scholar]
- 26.Fiebach JB, Schellinger PD, Jansen O, et al. CT and diffusion-weighted MR imaging in randomized order: diffusion-weighted imaging results in higher accuracy and lower interrater variability in the diagnosis of hyperacute ischemic stroke. Stroke 2002;33(9):2206–2210 [DOI] [PubMed] [Google Scholar]
- 27.Luby M, Bykowski JL, Schellinger PD, Merino JG, Warach S. Intra- and interrater reliability of ischemic lesion volume measurements on diffusion-weighted, mean transit time and fluid-attenuated inversion recovery MRI. Stroke 2006;37(12):2951–2956 [DOI] [PMC free article] [PubMed] [Google Scholar]
- 28.Warach S. New imaging strategies for patient selection for thrombolytic and neuroprotective therapies. Neurology 2001;57(5,Suppl 2):S48–S52 [DOI] [PubMed] [Google Scholar]
- 29.Wang Y, Liao X, Zhao X, et al. Imaging-based thrombolysis trial in acute ischemic stroke-II (ITAIS-II). Int J Stroke 2009;4(1):49–53; discussion 49 [DOI] [PubMed] [Google Scholar]
- 30.Imaging-based Thrombolysis trial in Acute Ischemic Stroke-II. ISRCTN#: 12033002. Stroke Trials Registry. Internet Stroke Center Web site. http://www.strokecenter.org/. Accessed April 30, 2011.
- 31.Imaging-based Thrombolysis trial in Acute Ischemic Stroke-III. ISRCTN#: 03887874. Stroke Trials Registry. Internet Stroke Center Web site. http://www.strokecenter.org/. Accessed April 30, 2011.
- 32.Bartlett ES, Walters TD, Symons SP, Fox AJ. Quantification of carotid stenosis on CT angiography. AJNR Am J Neuroradiol 2006;27(1):13–19 [PMC free article] [PubMed] [Google Scholar]
- 33.Wittkamp G, Buerke B, Dziewas R, et al. Whole brain perfused blood volume CT: visualization of infarcted tissue compared to quantitative perfusion CT. Acad Radiol 2010;17(4):427–432 [DOI] [PubMed] [Google Scholar]
- 34.Jovin TG, Yonas H, Gebel JM, et al. The cortical ischemic core and not the consistently present penumbra is a determinant of clinical outcome in acute middle cerebral artery occlusion. Stroke 2003;34(10):2426–2433 [DOI] [PubMed] [Google Scholar]
- 35.Kidwell CS, Saver JL, Starkman S, et al. Late secondary ischemic injury in patients receiving intraarterial thrombolysis. Ann Neurol 2002;52(6):698–703 [DOI] [PubMed] [Google Scholar]
- 36.Schaefer PW, Hassankhani A, Putman C, et al. Characterization and evolution of diffusion MR imaging abnormalities in stroke patients undergoing intra-arterial thrombolysis. AJNR Am J Neuroradiol 2004;25(6):951–957 [PMC free article] [PubMed] [Google Scholar]
- 37.Fiehler J, Knudsen K, Kucinski T, et al. Predictors of apparent diffusion coefficient normalization in stroke patients. Stroke 2004;35(2):514–519 [DOI] [PubMed] [Google Scholar]
- 38.Kidwell CS, Saver JL, Mattiello J, et al. Thrombolytic reversal of acute human cerebral ischemic injury shown by diffusion/perfusion magnetic resonance imaging. Ann Neurol 2000;47(4):462–469 [PubMed] [Google Scholar]
- 39.Chemmanam T, Campbell BC, Christensen S, et al. Ischemic diffusion lesion reversal is uncommon and rarely alters perfusion-diffusion mismatch. Neurology 2010;75(12):1040–1047 [DOI] [PubMed] [Google Scholar]
- 40.Chalela JA, Kang DW, Luby M, et al. Early magnetic resonance imaging findings in patients receiving tissue plasminogen activator predict outcome: insights into the pathophysiology of acute stroke in the thrombolysis era. Ann Neurol 2004;55(1):105–112 [DOI] [PubMed] [Google Scholar]
- 41.Neumann-Haefelin T, Kastrup A, de Crespigny A, et al. Serial MRI after transient focal cerebral ischemia in rats: dynamics of tissue injury, blood-brain barrier damage, and edema formation. Stroke 2000;31(8):1965–1972; discussion 1972–1973 [DOI] [PubMed] [Google Scholar]
- 42.Li F, Liu KF, Silva MD, et al. Transient and permanent resolution of ischemic lesions on diffusion-weighted imaging after brief periods of focal ischemia in rats: correlation with histopathology. Stroke 2000;31(4):946–954 [DOI] [PubMed] [Google Scholar]
- 43.Guadagno JV, Warburton EA, Jones PS, et al. The diffusion-weighted lesion in acute stroke: heterogeneous patterns of flow/metabolism uncoupling as assessed by quantitative positron emission tomography. Cerebrovasc Dis 2005;19(4):239–246 [DOI] [PubMed] [Google Scholar]
- 44.Guadagno JV, Warburton EA, Jones PS, et al. How affected is oxygen metabolism in DWI lesions? a combined acute stroke PET-MR study. Neurology 2006;67(5):824–829 [DOI] [PubMed] [Google Scholar]
- 45.Kohno K, Hoehn-Berlage M, Mies G, Back T, Hossmann KA. Relationship between diffusion-weighted MR images, cerebral blood flow, and energy state in experimental brain infarction. Magn Reson Imaging 1995;13(1):73–80 [DOI] [PubMed] [Google Scholar]
- 46.Busza AL, Allen KL, King MD, van Bruggen N, Williams SR, Gadian DG. Diffusion-weighted imaging studies of cerebral ischemia in gerbils: potential relevance to energy failure. Stroke 1992;23(11):1602–1612 [DOI] [PubMed] [Google Scholar]
- 47.Lin W, Lee JM, Lee YZ, Vo KD, Pilgram T, Hsu CY. Temporal relationship between apparent diffusion coefficient and absolute measurements of cerebral blood flow in acute stroke patients. Stroke 2003;34(1):64–70 [DOI] [PubMed] [Google Scholar]
- 48.Sobesky J, Zaro Weber O, Lehnhardt FG, et al. Does the mismatch match the penumbra? magnetic resonance imaging and positron emission tomography in early ischemic stroke. Stroke 2005;36(5):980–985 [DOI] [PubMed] [Google Scholar]
- 49.Frykholm P, Andersson JL, Valtysson J, et al. A metabolic threshold of irreversible ischemia demonstrated by PET in a middle cerebral artery occlusion-reperfusion primate model. Acta Neurol Scand 2000;102(1):18–26 [DOI] [PubMed] [Google Scholar]
- 50.Powers WJ, Grubb RL, Jr, Darriet D, Raichle ME. Cerebral blood flow and cerebral metabolic rate of oxygen requirements for cerebral function and viability in humans. J Cereb Blood Flow Metab 1985;5(4):600–608 [DOI] [PubMed] [Google Scholar]
- 51.de Ipolyi AR, Wu O, Schaefer PW, et al. Cerebral blood volume measurements in acute ischemic stroke are technique-dependent and cannot substitute for DW imaging. Boston, Mass: American Society of Neuroradiology, 2010 [Google Scholar]
- 52.Heiss WD, Sobesky J, Smekal U, et al. Probability of cortical infarction predicted by flumazenil binding and diffusion-weighted imaging signal intensity: a comparative positron emission tomography/magnetic resonance imaging study in early ischemic stroke. Stroke 2004;35(8):1892–1898 [DOI] [PubMed] [Google Scholar]
- 53.Heiss WD, Grond M, Thiel A, et al. Permanent cortical damage detected by flumazenil positron emission tomography in acute stroke. Stroke 1998;29(2):454–461 [DOI] [PubMed] [Google Scholar]
- 54.Hermier M, Nighoghossian N, Adeleine P, et al. Early magnetic resonance imaging prediction of arterial recanalization and late infarct volume in acute carotid artery stroke. J Cereb Blood Flow Metab 2003;23(2):240–248 [DOI] [PubMed] [Google Scholar]
- 55.Copen WA, Rezai Gharai L, Barak ER, et al. Existence of the diffusion-perfusion mismatch within 24 hours after onset of acute stroke: dependence on proximal arterial occlusion. Radiology 2009;250(3):878–886 [DOI] [PubMed] [Google Scholar]
- 56.Bhatia R, Hill MD, Shobha N, et al. Low rates of acute recanalization with intravenous recombinant tissue plasminogen activator in ischemic stroke: real-world experience and a call for action. Stroke 2010;41(10):2254–2258 [DOI] [PubMed] [Google Scholar]
Associated Data
This section collects any data citations, data availability statements, or supplementary materials included in this article.


