

Abstract
Human leucocyte antigen (HLA) loci have a complex evolution where both stochastic (e.g. genetic drift) and deterministic (natural selection) forces are involved. Owing to their extraordinary level of polymorphism, HLA genes are useful markers for reconstructing human settlement history. However, HLA variation often deviates significantly from neutral expectations towards an excess of genetic diversity. Because HLA molecules play a crucial role in immunity, this observation is generally explained by pathogen-driven-balancing selection (PDBS). In this study, we investigate the PDBS model by analysing HLA allelic diversity on a large database of 535 populations in relation to pathogen richness. Our results confirm that geographical distances are excellent predictors of HLA genetic differentiation worldwide. We also find a significant positive correlation between genetic diversity and pathogen richness at two HLA class I loci (HLA-A and -B), as predicted by PDBS, and a significant negative correlation at one HLA class II locus (HLA-DQB1). Although these effects are weak, as shown by a loss of significance when populations submitted to rapid genetic drift are removed from the analysis, the inverse relationship between genetic diversity and pathogen richness at different loci indicates that HLA genes have adopted distinct evolutionary strategies to provide immune protection in pathogen-rich environments.
Keywords: human leucocyte antigen, immunogenetics, pathogen-driven-balancing selection, pathogen richness, human migrations, genetic drift
1. Introduction
The molecules of the major histocompatibility complex (MHC) in humans, or human leucocyte antigen (HLA) system, play a central role in immunity by presenting virus- or pathogen-derived antigenic peptides to T cells and triggering an immune response (see recent reviews by [1,2]). The HLA molecules are encoded by a total of six class I and 18 class II genes located among many other genes on the short arm of chromosome 6 (6p21.3) [3], six of them (HLA-A, -B, -C for class I, and HLA-DPB1, -DRB1, -DQB1 for class II) being particularly polymorphic, with up to 2125 currently known alleles for HLA-B (http://hla.alleles.org/nomenclature/stats). Class I and class II molecules differ both in their structure and function: class I molecules, expressed in almost all nucleated cells, consist of a single α chain (non-covalently bound to a small β2-microglobulin polypeptide) and present virus-derived intracellular peptides to CD8+ cytotoxic T cells, leading to the lysis of the infected cells. Class II molecules, expressed by specialized cells of the immune system such as dendritic cells or macrophages, consist of two chains, α and β, and present peptides derived from endocytosed extracellular antigens (e.g. from parasites) to CD4+ helper T cells, leading to a humoral (antibody-mediated) immune response destroying the foreign antigens. In both cases, peptides are presented within a pocket-like ‘peptide-binding site’ (PBS) which is a portion of the α chain for HLA class I, and combined portions of the α and β chains for HLA class II molecules (therefore called αβ heterodimers) [4]. This groove is highly polymorphic; actually, almost all the observed HLA DNA variation is located in exons 2 and 3 for class I, and in exon 2 for class II, of their corresponding HLA genes and results in amino acid substitutions in the PBS. Considering the total HLA variation existing in a given human population, a very large set of antigenic peptides may thus be recognized. A common theory, initially suggested by studies of mice MHC [5], proposes that, within populations, individuals who are heterozygotes at HLA loci would have a higher fitness in pathogen-rich environments. At the population level, this would explain the maintenance of a very high HLA diversity, which is generally confirmed by an excess of heterozygotes compared with Hardy–Weinberg proportions [6,7]. At the molecular level, it justifies the higher rate of non-synonymous than synonymous substitutions observed in the PBS [8,9].
This theory, currently known as the pathogen-driven-balancing selection (PDBS) model, is however not well understood from a functional point of view [10]. Moreover, other mechanisms such as negative frequency-dependent selection and fluctuating selection in space and time may represent alternative models explaining the above-mentioned observations [10,11]. In the first case, rare alleles would be advantageously selected against pathogens evading common HLA alleles, resulting in a dynamic process of allelic frequency fluctuation through host–pathogen coevolution [12–14]. In the second case, different sets of HLA alleles would be selected positively at different periods according to geographical and/or temporal changes in the type and prevalence of pathogens, also leading to allelic frequency variation through time [11,15]. The importance of those three different mechanisms in shaping the diversity of HLA loci is very difficult to determine as they are not mutually exclusive and their consequences are very similar. Moreover, the specific evolution of either class I or class II HLA molecules, which play different roles in the immune defence, may not necessarily follow the same mechanisms.
Our laboratory has been analysing HLA data in human populations during many years with the aim to reconstruct human peopling history [16–25]. As a matter of fact, our group and others confirmed that the HLA polymorphism evolves under different kinds of mechanisms, i.e. stochastic factors related to the geographical and demographic expansion of modern humans throughout the world, and natural selection [6,7,20,23,26,27]. To disentangle these different effects is a real challenge [26], but some results have recently been conclusive in finding a significant, although low coefficient of selection for at least one HLA locus, explaining a lack of differentiation of human populations across a geographical barrier [20]. Whether the excess of genetic diversity found for HLA in comparison with neutral loci is directly related to pathogens' history has yet to be determined.
A valuable approach is to compare the genetic diversity between populations living in different parasitic contexts representing different risk factors. Existing databases of worldwide distributions of pathogens may be used to achieve this aim. On the basis of HLA allele frequency data of 61 human populations worldwide and values of pathogen richness provided by the Global Infectious Diseases and Epidemiology Online Network database (GIDEON; http://www.gideononline.com) for different countries of the world, Prugnolle et al. [28] reported that HLA genetic variation was correlated with pathogen richness, although human colonization history explained a much higher proportion of HLA genetic diversity worldwide. As the authors used a dataset made up of only HLA class I frequencies to investigate the correlations between genetic diversity and virus richness, we decided to perform a similar analysis by extending it to a larger population database including both HLA class I and class II frequencies that we would compare to both viral and all kinds of pathogens' distributions. Our aim was to check whether the PDBS hypothesis could be validated by this approach for the seven highly polymorphic HLA-A, -B, -C, -DPB1, -DQA1, -DQB1 and -DRB1 loci.
2. Material and methods
(a). Human leucocyte antigen polymorphism in human populations
We used a very large database including information on genetic diversity on HLA class I (A, B, C) and class II (DPB1, DQA1, DQB1, DRB1) genes for a large number of populations. This database was compiled by Buhler & Sanchez-Mazas [6], mainly from the 12 and 13th International Histocompatibility Workshops [29,30], but also from various published reports, and completed with data from our own laboratory. These data consist of allele frequencies defined at a four-digits level and preliminary submitted to a quality control procedure (see Buhler & Sanchez-Mazas [6] for details). We removed from the original dataset populations that recently migrated from one country to another (e.g. Egyptian Copts living in the United States of America) or which have been categorized as admixed populations (OTH) by Buhler & Sanchez-Mazas [6]. The rationale for this was to avoid putative mismatching between the pathogen environment where the population was sampled and the HLA polymorphism of this population, as its HLA profile could have evolved in response to the pathogen environment of the region where the population initially lived. The remaining 535 population samples were classified into 10 geographical groups, following the recommendation from the International Histocompatibility Working Group—Anthropology/Human Genetic Diversity component of the 13th Histocompatibility Workshop [31]. The number of populations studied for each HLA locus was 88 for HLA-A, 80 for HLA-B, 62 for HLA-C, 56 for HLA-DPB1, 57 for HLA-DQA1, 88 for HLA-DQB1 and 104 for HLA-DRB1.
To describe genetic diversity at the HLA complex within each population, we used two different statistics, the allelic richness  and the expected heterozygosity
  . Allelic richness represents the number of alleles expected in a population sample of size equal to the rarefaction size 2n (i.e. size of the smallest sample of n individuals at this locus). Rarefaction sizes are 50 for HLA-A, 58 for -B, 56 for -C, 60 for -DPB1, 66 for -DQA1 and -DQB1 and 52 for -DRB1. Allelic richness was measured using the rarefaction method [32] as in El Mousadik & Petit [33], according to:
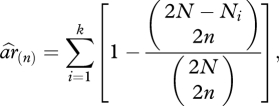 |
where k is the number of alleles in the sample and Ni the number of occurrences of the ith allele among the 2N sampled genes.
The expected heterozygosity within a sampled population at Hardy–Weinberg equilibrium was computed according to the following formula:
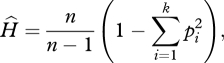 |
where n is the sample size, k the number of alleles and pi the frequency of the ith allele in the sample.
(b). Pathogen richness
Information on pathogen richness was extracted from the GIDEON database (http://www.gideononline.com/). This database provides information on the presence and the prevalence of infectious diseases in every country in the world. It is updated weekly through peer-reviewed publications in medical journals, abstracts of major meetings and national health ministry reports. The GIDEON database was recently used in a broad range of evolutionary ecology studies [28,34–36]. Information on pathogen richness used in the present study was extracted from the GIDEON database between July and October 2010. In order to relate the level of HLA polymorphism within a population and the pathogen environment of this population, we compiled the number (pr) of infectious diseases present in all countries for which we had information on HLA genetic diversity (n = 73 countries). The mean number (±s.d.) of pathogens per country was 214.15 ± 15.79, with a minimum number of pathogens found in the Azores (n = 183 pathogens) and a maximum number of pathogens found in Brazil (n = 250 pathogens). Then, because it is generally assumed that the level of polymorphism of HLA class I genes (A, B and C) will be better explained by the virus richness rather than by the whole set of pathogens including bacteria and parasites [28,37], we also compiled the number of distinct virus agents (both DNA and RNA viruses) for each country for which we had information on HLA. The mean number (±s.d.) of viruses per country was 41.98 ± 4.52, with a minimum number of pathogens found in New Zealand (n = 34 viruses) and a maximum number of virus found in India (n = 51 viruses). Electronic supplementary material, table S1 lists all pathogens used in this study.
(c). Effect of past colonization history
Since past colonization history has a strong impact in shaping genetic diversity in human populations, including diversity at the HLA complex [28], we included in the statistical analyses described below the geographical distance between the location of each population sample considered and East Africa. For each population, we computed the distance (in kilometres) from East Africa (taking Addis-Abeda, 9.03 N, 38.74 E as the reference) across landmass, assuming that human populations did not cross large bodies of water during their migration history. Following Ramachandran et al. [38], we used five obligatory waypoints to obtain estimates of the migration distances. Those waypoints were Anadyr, Russia (64 N, 177 E), Cairo, Egypt (30 N, 31 E), Istanbul, Turkey (41 N, 28 E), Phnom Penh, Cambodia (11 N, 104 E) and Prince Rupert, Canada (54 N, 130 W). To illustrate this for a population located in southeast Asia such as Malays, we computed the distance from East Africa taking the distance between Addis-Abeda and Cairo, plus the distance between Cairo and Phnom Penh, plus the distance between Phnom Penh and the Malay population. Geographical distances (in kilometres) between all points of interest were computed using coordinates with the computer program Geodist [39].
(d). Effect of genetic drift
Because genetic drift reduces the level of polymorphism in a small-sized isolated population, this process may confound the examination of potential relationships between pathogen and/or virus richness and HLA polymorphism across all populations studied. To take such an effect into account, we also ran the statistical analyses after excluding the populations which were likely to be submitted to a rapid genetic drift. In our dataset, this led us to exclude Amerindian (Region = America in electronic supplementary material, tables S2–S8) and Taiwanese (Country = Taiwan in electronic supplementary material, tables S2–S8) populations [6], decreasing the number of populations down to 65 for HLA-A, 57 for HLA-B, 42 for HLA-C, 44 for HLA-DPB1, 40 for HLA-DQA1, 69 for HLA-DQB1 and 70 for HLA-DRB1 (see electronic supplementary material, tables S2–S8 for the complete list of populations used).
(e). Statistical analysis
We used multiple linear regressions to measure how the richness in pathogens or, more specifically, viruses, explained the level of genetic diversity (both the allelic richness ar and the expected heterozygosity H) at each locus. In a first step, we measured how the geographical distance from East Africa explained the level of HLA genetic diversity. To that aim, we included in a linear regression model the statistic of genetic diversity (either ar or H) as the dependent variable and the geographical distance from East Africa as the independent variable. In a second step, since we found a significant role of migration history in shaping populations' HLA diversity (see §3), we included the statistic of pathogen abundance (either pathogen or virus richness) as a second independent variable in a multiple linear regression model. This allowed us to take into account the effect of migration history in our search for putative relationships between HLA genetic diversity and pathogen richness. We thus estimated the coefficient of determination r2 as a measure of the proportion of variability of genetic diversity (allelic richness or expected heterozygosity) explained by the geographical distance from East Africa alone or by both the geographical distance from East Africa and the pathogen (or virus) richness. Normality of the data was improved using log-transformations [40]. All tests were two-tailed and conducted using SPSS v. 18.0. Data are presented as means ± s.d and differences were regarded as statistically significant at p < 0.05.
3. Results
(a). Human leucocyte antigen diversity and geographical distance
We computed the allelic richness ar and the expected heterozygosity H for every population sample and all seven HLA class I and class II loci. Average values of both statistics on all populations may be found in table 1. HLA-B is the locus with the highest allelic richness ar (18.52) and heterozygosity H (0.90), while HLA-DQA1 has the lowest ar (6.59) and HLA-DPB1 the lowest H (0.72).
Table 1.
Mean values (±s.d.) of allelic richness (ar) and expected heterozygosity (H) for each of the seven HLA loci investigated (class I and class II). n is the number of population samples.
| allelic richness (ar) | expected heterozygosity (H) | ||
|---|---|---|---|
| locus | n | mean (±s.d.) | mean (±s.d.) |
| class I | |||
| HLA-A | 88 | 12.07 (±4.85) | 0.80 (±0.15) |
| HLA-B | 80 | 18.52 (±6.56) | 0.90 (±0.07) |
| HLA-C | 62 | 12.18 (±3.98) | 0.85 (±0.72) |
| class II | |||
| HLA-DPB1 | 56 | 9.88 (±3.81) | 0.72 (±0.17) |
| HLA-DQA1 | 57 | 6.59 (±1.87) | 0.74 (±0.11) |
| HLA-DQB1 | 88 | 9.78 (±3.04) | 0.79 (±0.11) |
| HLA-DRB1 | 104 | 14.79 (±5.05) | 0.87 (±0.08) |
| total | 535 | ||
We then tested the correlation between each of the two statistics measuring genetic diversity (allelic richness ar and expected heterozygosity H) and the geographical distance from East Africa through landmass (table 2). Strong and significant negative correlations between geographical distance from East Africa and both statistics are found for each locus tested (class I and class II). The global correlation between increasing geographical distance and decreasing genetic diversity remains significant after Bonferroni's correction for multiple tests (threshold α′ = 0.007). Allelic richness decreases generally faster than heterozygosity.
Table 2.
Correlation between genetic diversity (both allelic richness ar and expected heterozygosity H) at each HLA locus and geographical distance from East Africa. n is the number of populations tested at each locus, β (±s.d.) is the slope of the linear regression between the two variables, r2 is the coefficient of determination and p represents the p-value of the statistical test.
| locus | n | genetic diversity | β (±s.d.) | r2 | p |
|---|---|---|---|---|---|
| class I | |||||
| HLA-A | 88 | H | −0.16 (±0.03) | 0.22 | <0.001 |
| ar | −0.45 (±0.06) | 0.43 | <0.001 | ||
| HLA-B | 80 | H | −0.04 (±0.01) | 0.17 | <0.001 |
| ar | −0.24 (±0.06) | 0.18 | <0.001 | ||
| HLA-C | 62 | H | −0.06 (±0.01) | 0.23 | <0.001 |
| ar | −0.29 (±0.05) | 0.38 | <0.001 | ||
| class II | |||||
| HLA-DPB1 | 56 | H | −0.21 (±0.08) | 0.12 | 0.009 |
| ar | −0.35 (±0.06) | 0.41 | <0.001 | ||
| HLA-DQA1 | 57 | H | −0.13 (±0.02) | 0.35 | <0.001 |
| ar | −0.23 (±0.04) | 0.35 | <0.001 | ||
| HLA-DQB1 | 88 | H | −0.09 (±0.02) | 0.28 | <0.001 |
| ar | −0.20 (±0.04) | 0.28 | <0.001 | ||
| HLA-DRB1 | 104 | H | −0.08 (±0.01) | 0.32 | <0.001 |
| ar | −0.33 (±0.05) | 0.31 | <0.001 | ||
(b). Human leucocyte antigen diversity and pathogens
We also computed the correlation between genetic diversity (both ar and H) and pathogen richness, taking into account the geographical distance from East Africa. We considered both all pathogens together and viruses only, which we compared with both class I and class II diversity. Indeed, although the main function of HLA class I molecules is to display virus-derived intracellular peptides to CD8+ cytotoxic T cells and that of HLA class II molecules to present peptides derived from extracellular parasites to CD4+ helper T cells, the mechanisms of the immune response appear to be much more complex; for example, the action of HLA class II molecules triggering an antibody-mediated response may also be necessary in viral infection (W. Reith 2010 and D. Pinschewer 2010, personal communications).
With all pathogens, a significant positive correlation between genetic diversity (only H) and pathogen richness is found for HLA-B, while a significant negative correlation is found for HLA-DQB1. When considering only viruses, the results do not change much. HLA-B shows a significant positive correlation for the two indices of genetic diversity (both ar and H) and the correlation becomes significant for HLA-A (only H). HLA-DQB1 is still the only class II locus with a significant negative correlation. There is no significant correlation between pathogen richness and genetic diversity for HLA-C, -DPB1, -DQA1 and -DRB1.
(c). Genetic drift effect
When small-sized populations which were likely to have passed through episodes of rapid genetic drift are removed (Amerindian and Taiwanese populations), the correlation between genetic diversity (both ar and H) and the geographical distance from East Africa through landmass remains significant except for HLA-DQA1 and -DQB1 (electronic supplementary material, table S9). The significance of the correlation with H, but not with ar, also disappears for HLA-DPB1. On the other hand, when Amerindians and Taiwanese are removed, no correlation between genetic diversity and pathogen richness remains significant (electronic supplementary material, table S10), i.e. for HLA-B between allelic richness (ar) and pathogen or virus richness (r2 = 0.19, p = 0.679 and r2 = 0.19, p = 0. 994, respectively) and between heterozygosity (H) and pathogen or virus richness (r2 = 0.22, p = 0.216 and r2 = 0.21, p = 0.434, respectively). The positive correlation found for HLA-B when all populations are considered is thus low as its significance depends on the presence of some peculiar Amerindian and/or Taiwanese populations, which exhibit a high genetic diversity in pathogen-rich environments (figure 1).
Figure 1.

Map of the worldwide distribution of pathogen richness. Green circles illustrate the allelic richness of every population sampled for the locus HLA-B. Graphs below the map represent the regression between allelic richness for HLA-B and pathogen richness (with and without Taiwanese and Amerindian populations). To take into account the effect of past colonization history, we represent allelic richness by the standardized residuals of the linear regression between allelic richness and distance from East Africa and the pathogen richness by the standardized residuals of the linear regression between pathogen richness and distance from East Africa (all variables log-transformed).
The significant and negative correlation between genetic diversity and pathogen richness at HLA-DQB1 also vanishes out when Amerindian populations (there are no Taiwanese samples here for HLA-DQB1) are not considered, i.e. between allelic richness (ar) and pathogen or virus richness (r2 = 0.01 and p = 0.414 and r2 = 0.0, p = 0. 997, respectively) and between heterozygosity (H) and pathogen or virus richness (r2 = 0.04 and p = 0.740 and r2 = 0.04, p = 0.670, respectively). It thus seems that the negative correlation found at HLA-DQB1 is low as its significance depends on the presence of some peculiar Amerindian populations, which exhibit a very low diversity despite living in pathogen-rich environments (figure 2).
Figure 2.

Map of the worldwide distribution of pathogen richness. Green circles illustrate the allelic richness of every population sampled for the locus HLA-DQB1. Graphs below the map represent the regression between allelic richness for HLA-DQB1 and pathogen richness (with and without Amerindian populations). To take into account the effect of past colonization history, we represent allelic richness by the standardized residuals of the linear regression between allelic richness and distance from East Africa and the pathogen richness by the standardized residuals of the linear regression between pathogen richness and distance from East Africa (all variables log-transformed).
4. Discussion
The crucial role of humans' migration history in shaping HLA genetic patterns worldwide is revealed in this study for seven classical class I (A, B and C) and class II (DPB1, DQA1, DQB1 and DRB1) loci. This research extends our previous results showing correlations between genetic and geographical distances among populations [6,23], as it reveals specifically a correlation between HLA genetic diversity and geographical distance from East Africa for a number of populations from all continents at both class I and class II loci. Like Prugnolle et al. [28], we thus made the preliminary assumption that modern humans migrated from this region, which harbours a very high genetic diversity [41–43], to expand worldwide, as suggested by a number of population genetics studies [38,44–49], a scenario often referred to as ‘Out-of-Africa’. A testable prediction resulting from this model is that modern human populations would have lost genetic diversity through a very large number of small founder effects during their geographical expansion [49], as proposed on the basis of the observation of decreasing diversity from East Africa at neutral autosomal microsatellites [38,46]. This is also what we found in this study, in agreement with Prugnolle et al. [28] for the three HLA class I loci HLA-A, -B and -C, and for the first time for the four HLA class II loci HLA-DRB1, -DQA1, -DQB1 and -DPB1. On the other hand, distance from East Africa only explains between 12 and 35 per cent of the genetic variation when estimated by the expected heterozygosity H, and from 18 to 43 per cent when estimated by the allelic richness ar at each locus, the latter decreasing faster than the former with the distance from East Africa (table 2). This is much less than the 85 per cent of variance explained by the neutral markers mentioned above [46]. We also checked that these correlations were not completely induced by the presence of small-sized Amerindian or Taiwanese populations, which are very distant geographically from East Africa and which would have undergone particularly strong bottlenecks and/or rapid genetic drift during their colonization of America or their isolation in Taiwan, respectively. When Amerindians and Taiwanese are removed from the analysis, the correlation between allelic richness ar and distance from Africa remains significant at all loci except DQA1 and DQB1 (electronic supplementary material, table S9). The same results are obtained when genetic diversity is estimated by the heterozygosity H (instead of the allelic richness ar), except for DPB1 whose correlation becomes non-significant. This last result is somewhat surprising because HLA-DPB1 is generally considered as the most neutral among all HLA loci, with the highest level of genetic differentiation among populations (ΦST = 14.5%, compared with 6–9% for the other loci except DQA1, with 13.1%) [6], and is thus, in principle, particularly useful to infer human peopling history. However, such as HLA-DQA1 and -DQB1, this locus exhibits a low level of genetic diversity in most human populations (table 1) and cases of significant deviations from selective neutrality towards an excess of homozygotes are sometimes observed [6]: in this case, to remove the most distant and less diversified populations from the data would have been sufficient to erase some direct signatures of human colonization, at least when measured by the slow decrease in heterozygosity with geographical distance from East Africa. On the other hand, these traces are still detected for HLA-DPB1 when allelic richness instead of heterozygosity is used. Hence we may say that the genetic patterns of at least five of the seven HLA loci investigated in this study, i.e. HLA-A, -B, -C, -DRB1 and -DPB1, are compatible with an expansion model of modern humans from East Africa. The important role of geographical migrations and demography in shaping HLA global genetic structure confirms that HLA markers can be used for inferring human settlement history [17], even if natural selection may distort such patterns in some particular situations, e.g. as it has been shown for HLA-DRB1 across the geographical barrier of the Strait of Gibraltar [20].
HLA-DQA1 and -DQB1, for which the correlation between genetic diversity (estimated by both ar and H indices) and geographical distance from East Africa vanishes out in the absence of populations strongly submitted to genetic drift, both show a decreasing level of genetic diversity with increasing pathogen richness (only -DQB1 is statistically significant), i.e. an extremely surprising result. This may indicate a very peculiar mode of natural selection which does not correspond to the classical PDBS hypothesis. Actually, even though the correlation between HLA genetic diversity (either allelic richness or expected heterozygosity) and pathogen richness is significant for HLA-B and -DQB1, when either all pathogens or viruses only are considered, and for HLA-A, when only viruses are tested, it loses its significance when Amerindian and/or Taiwanese populations are removed from the worldwide dataset. The PBDS model is thus not strongly sustained by this approach.
A noteworthy result is the inverse relationship found between these variables for different HLA class I and class II loci (table 3). HLA class I loci (A, B and C) tend to exhibit a positive relationship between genetic diversity and pathogen richness, suggesting heterozygote advantage as the main mechanism of pathogen-mediated selection, in agreement, although weakly, with the PDBS model. On the other hand, HLA class II loci (actually DQA1, DQB1 and DRB1) tend to reveal a negative relationship, indicating that other mechanisms may be at work. Actually, this negative relationship for class II molecules is much more pronounced for HLA-DQB1 than for HLA-DRB1, HLA-DQA1 lying in between. Functional differences between HLA class I and class II molecules probably explain these divergent results, although specific mechanisms remain to be investigated. A tentative explanation may be found in the different way HLA class I and class II molecules bind antigenic peptides. Class I-bound peptides are short (approx. 8–10 amino acids) and completely anchored with a high binding affinity within the PBS, which is composed, as mentioned above, of a portion of the single α chain. On the contrary, class II-bound peptides are long (approx. 12–25 amino acids), incompletely inserted (with side chains lying outside) in the peptide-binding groove, which in this case is composed of combined portions of the two chains α and β. Class II molecules thus display a lower specificity (or restriction) and affinity of peptide-binding, and, among them, HLA-DQ heterodimers are likely to be the more promiscuous [50,51]. These observations may explain our findings. Indeed, for class I molecules, a high allelic diversity of the α chain, as attested by the mean allelic richness of each locus presented in table 1, would be advantageous in a virus-rich environment because each virus-derived peptide would need a very specific binding groove to be presented to CD8+ T cells. Actually, this may also be the case for HLA-DRB1 whose allelic variation in human populations falls within the range of the values found for HLA class I loci (table 1), and for which more than 1000 alleles coding for almost 800 different proteins are currently known (see http://hla.alleles.org/nomenclature/stats.html). Note also that unlike for the other class II molecules, the α chain of DR αβ heterodimers is almost monomorphic (only two subtypes, DRA*01:01 and DRA*01:02, differing by non-synonymous substitutions are known, see http://hla.alleles.org/class2.html); therefore, variation at the DR β chain would be crucial to guarantee specific peptide presentations in a manner similar to the class I loci. Another argument is that human populations generally exhibit highly divergent HLA-A, -B, -C and -DRB1 alleles in terms of pairwise nucleotidic differences (with often more than 20 differences among DNA sequences at exon 2 (and exon 3 for class I)), suggesting that these loci may have evolved according to a model of asymmetric balancing selection whereby heterozygotes for molecularly distant alleles would have a higher fitness [6], a hypothesis that is worth testing in future research when DNA sequence data for those loci are available. The decrease of genetic diversity with pathogen richness found for HLA-DRB1, whose slope is actually much less pronounced than for HLA-DQA1 and -DQB1 despite the much higher number of populations considered (table 3), may then be irrelevant.
Table 3.
Correlation between genetic diversity (allelic richness ar and expected heterozygosity H) at each HLA locus and pathogen or virus richness. n is the number of populations tested at each locus. Geographical distance from Africa is used as a third variable; its correlation with genetic diversity statistics may be found in table 2. β (±s.d.) is the slope of the linear regression between the two variables, r2 is the coefficient of determination of the two independent variables (geographical distances from Africa and pathogen or virus richness), while p is the p-value of the effect of the pathogen/virus diversity on the genetic diversity. *p < 0.05; **p < 0.01.
| locus | n | genetic diversity | all pathogen richness |
virus richness |
||||
|---|---|---|---|---|---|---|---|---|
| β (±s.d.) | r2 | p | β (±s.d.) | r2 | p | |||
| class I | ||||||||
| HLA-A | 88 | H | 0.56 (±0.3) | 0.25 | 0.067 | 0.52 (±0.3) | 0.26 | 0.024* |
| ar | 0.65 (±0.5) | 0.44 | 0.204 | 0.54 (±0.4) | 0.44 | 0.169 | ||
| HLA-B | 80 | H | 0.24 (±0.1) | 0.22 | 0.035* | 0.22 (±0.1) | 0.24 | 0.010* |
| ar | 1.14 (±0.6) | 0.22 | 0.052 | 0.94 (±0.4) | 0.23 | 0.032* | ||
| HLA-C | 62 | H | 0.15 (±0.1) | 0.24 | 0.281 | 0.16 (±0.1) | 0.26 | 0.131 |
| ar | 0.20 (±0.5) | 0.38 | 0.672 | 0.31 (±0.4) | 0.39 | 0.390 | ||
| class II | ||||||||
| HLA-DPB1 | 56 | H | 0.83 (±0.8) | 0.13 | 0.329 | 0.46 (±0.6) | 0.13 | 0.450 |
| ar | 0.58 (±0.6) | 0.42 | 0.345 | 0.13 (±0.5) | 0.41 | 0.771 | ||
| HLA-DQA1 | 57 | H | −0.50 (±0.3) | 0.38 | 0.101 | −0.37 (±0.2) | 0.38 | 0.094 |
| ar | −0.75 (±0.5) | 0.37 | 0.168 | −0.36 (±0.4) | 0.36 | 0.360 | ||
| HLA-DQB1 | 88 | H | −0.65 (±0.2) | 0.35 | 0.004** | −0.47 (±0.2) | 0.36 | 0.002** |
| ar | −1.49 (±0.5) | 0.35 | 0.003** | −1.05 (±0.3) | 0.36 | 0.002** | ||
| HLA-DRB1 | 104 | H | −0.14 (±0.1) | 0.33 | 0.318 | −0.11 (±0.1) | 0.33 | 0.246 |
| ar | −0.41 (±0.6) | 0.21 | 0.479 | −0.38 (±0.4) | 0.31 | 0.343 | ||
By contrast, a limited number of DQ αβ heterodimers are found at high frequencies in human populations worldwide [52]. Previous results have shown that particular DQA1 and -DQB1 allelic combinations lead to unstable DQ molecules [53,54], suggesting that these loci are submitted to purifying selection owing to structural constraints, with the possible consequence to slow down the rate of nucleotidic divergence among their alleles. This may explain why DQB1 alleles are more related to each other from a molecular point of view than the alleles of other loci (except DPB1) [6]. A paradox that has yet recently been underlined is that whereas different HLA-DQ αβ heterodimers exhibit highly divergent peptide-binding motifs, they share largely overlapping peptide-binding repertoires [52]. A plausible explanation is that HLA-DQ PBS would play a minor role in peptide-binding compared with lateral interactions involving side-chains. The loss of PBS role in antigen recognition (i.e. recognition degeneracy like described by Stoffels & Spencer [55]) would have been essential for HLA-DQ to guarantee immune protection against a large variety of pathogens despite the existence of only a few stable αβ heterodimers. A further conclusion is that HLA loci submitted to different selective forces—balancing selection in the case of HLA-A, -B, -C and -DRB1, and purifying selection in the case of HLA-DQA1 and -DQB1—would have followed distinct evolutionary strategies to provide efficient immune protection in pathogen-rich environments.
5. Conclusion
The present study brings new evidence that molecular variation at both class I and class II HLA loci, with the possible exception of HLA-DQA1 and -DQB1, reveals significant signatures of past migrations of modern humans throughout the world, as a general pattern of decreasing genetic diversity with increasing geographical distance from East Africa is confirmed for three HLA class I loci (A, B, C) and is shown for two HLA class II loci (DRB1, DPB1), even when genetic drift effects owing to remote populations are controlled. In addition to previous evidence suggesting that these polymorphisms mainly evolve under the influence of geographical and demographic expansions of human populations, these results indicate that most HLA markers are useful tools to infer migration's history. A small part of the HLA genetic variation may also be explained by a response to pathogen richness in different environments for HLA-B (compatible with other studies suggesting the strongest selection for this locus [56–58]), and, to a lesser extent, HLA-A, in agreement with the PDBS model, although this effect is no longer significant when Amerindian and Taiwanese populations are excluded from the data. The present study also describes for the first time the relationship between genetic diversity and pathogen richness at the HLA class II loci. The most surprising result is the highly significant, negative correlation found for HLA-DQB1, although statistical significance disappears again when Amerindians are excluded. The comparisons of the different HLA loci for their amount of genetic diversity observed in human populations, their peptide-binding characteristics and the observed relationships between their genetic diversity and pathogen richness led us to suggest that they followed distinct evolutionary strategies in pathogen-rich environments: whereas HLA-A, -B, -C, and probably -DRB1, accumulated allelic diversity to ensure an efficient immune response in such environments, HLA-DQA1 and DQB1 relaxed the restriction of their PBS to maintain their protective role against pathogens despite a strong selective pressure against the formation of a large variety of DQ αβ heterodimers. These hypotheses should of course be considered as tentative, and both more immunogenetic investigation, e.g. to assess peptide-binding specificities or repertoire overlaps between class I and class II loci [50], and more robust biostatistical results are needed to better understand the molecular evolution of the complex HLA polymorphism.
Acknowledgements
We would like to thank Stéphane Buhler for helping us with the Gene[VA] large worldwide HLA database, as well as Prof. Walter Reith and Daniel Pinschewer (University of Geneva) for useful discussions. This work received financial support from the Swiss National Science Foundation (SNF, Switzerland) grants no. 3100A0—112651 and 31003A—127465 (A.S.M.) and the ESF (Europe) COST grant of Action BM0803 ‘HLA-NET’ (A.S.M.).
References
- 1.Mehra N. K. (ed.) 2010. The HLA complex in biology and medicine. New Delhi, India: Jaypee Brothers Medical Publishers (P) Ltd [Google Scholar]
- 2.Parham P. 2009. The immune system, 3rd edn. London, UK: Garland Science [Google Scholar]
- 3.Horton R., et al. 2004. Gene map of the extended human MHC. Nat. Rev. Genet. 5, 889–899 10.1038/nrg1489 (doi:10.1038/nrg1489) [DOI] [PubMed] [Google Scholar]
- 4.Jensen P. E. 2007. Recent advances in antigen processing and presentation. Nat. Immunol. 8, 1041–1048 10.1038/ni1516 (doi:10.1038/ni1516) [DOI] [PubMed] [Google Scholar]
- 5.Doherty P., Zinkernagel R. 1975. A biological role for the major histocompatibility antigens. Lancet 1, 1406–1409 10.1016/S0140-6736(75)92610-0 (doi:10.1016/S0140-6736(75)92610-0) [DOI] [PubMed] [Google Scholar]
- 6.Buhler S., Sanchez-Mazas A. 2011. HLA DNA sequence variation among human populations: molecular signatures of demographic and selective events. PLoS ONE 6, e14643. 10.1371/journal.pone.0014643 (doi:10.1371/journal.pone.0014643) [DOI] [PMC free article] [PubMed] [Google Scholar]
- 7.Solberg O. D., Mack S. J., Lancaster A. K., Single R. M., Tsai Y., Sanchez-Mazas A., Thomson G. 2008. Balancing selection and heterogeneity across the classical human leukocyte antigen loci: a meta-analytic review of 497 population studies. Hum. Immunol. 69, 443–464 10.1016/j.humimm.2008.05.001 (doi:10.1016/j.humimm.2008.05.001) [DOI] [PMC free article] [PubMed] [Google Scholar]
- 8.Hughes A. L., Nei M. 1988. Pattern of nucleotide substitution at major histocompatibility complex class I loci reveals overdominant selection. Nature 335, 167–170 10.1038/335167a0 (doi:10.1038/335167a0) [DOI] [PubMed] [Google Scholar]
- 9.Hughes A. L., Nei M. 1989. Nucleotide substitution at major histocompatibility complex class II loci: evidence for overdominant selection. Proc. Natl Acad. Sci. USA 86, 958–962 10.1073/pnas.86.3.958 (doi:10.1073/pnas.86.3.958) [DOI] [PMC free article] [PubMed] [Google Scholar]
- 10.Spurgin L. G., Richardson D. S. 2010. How pathogens drive genetic diversity: MHC, mechanisms and misunderstandings. Proc. R. Soc. B 277, 979–988 10.1098/rspb.2009.2084 (doi:10.1098/rspb.2009.2084) [DOI] [PMC free article] [PubMed] [Google Scholar]
- 11.Hill A. V. S. 1991. HLA associations with malaria in Africa: some implications for MHC evolution. In Molecular evolution of the major histocompatibility complex (eds Klein J., Klein D.), pp. 403–419 Berlin, Germany: Springer [Google Scholar]
- 12.Borghans J. A., Beltman J. B., De Boer R. J. 2004. MHC polymorphism under host–pathogen coevolution. Immunogenetics 55, 732–739 10.1007/s00251-003-0630-5 (doi:10.1007/s00251-003-0630-5) [DOI] [PubMed] [Google Scholar]
- 13.Slade R. W., McCallum H. I. 1992. Overdominant vs. frequency-dependent selection at MHC loci. Genetics 132, 861–864 [DOI] [PMC free article] [PubMed] [Google Scholar]
- 14.Takahata N., Nei M. 1990. Allelic genealogy under overdominant and frequency-dependent selection and polymorphism of major histocompatibility complex loci. Genetics 124, 967–978 [DOI] [PMC free article] [PubMed] [Google Scholar]
- 15.Hedrick P. W. 2002. Pathogen resistance and genetic variation at MHC loci. Evolution 56, 1902–1908 [DOI] [PubMed] [Google Scholar]
- 16.Riccio M. E., Nunes J. M., Rahal M., Kervaire B., Tiercy J.-M., Sanchez-Mazas A. 2011. The Austro-Asiatic Munda population from India and its enigmatic origin: a HLA diversity study. Hum. Biol. 83, 405–435 10.1353/hub.2011.0021 (doi:10.1353/hub.2011.0021) [DOI] [PubMed] [Google Scholar]
- 17.Sanchez-Mazas A., et al. 2011. Immunogenetics as a tool in anthropological studies. Immunology 133, 143–164 10.1111/j.1365-2567.2011.03438.x (doi:10.1111/j.1365-2567.2011.03438.x) [DOI] [PMC free article] [PubMed] [Google Scholar]
- 18.Di D., Sanchez-Mazas A. 2011. Challenging views on the peopling history of East Asia: the story according to HLA markers. Am. J. Phys. Anthropol. 145, 81–96 10.1002/ajpa.21470 (doi:10.1002/ajpa.21470) [DOI] [PubMed] [Google Scholar]
- 19.Nunes J. M., et al. 2010. Analysis of HLA population data (AHPD) submitted to the 15th International Histocompatibility/Immunogenetics Workshop by using the GENE[RATE] computer tools accommodating ambiguous data (AHPD project report). Tissue Antigens 76, 18–30 10.1111/j.1399-0039.2010.01469.x (doi:10.1111/j.1399-0039.2010.01469.x) [DOI] [PubMed] [Google Scholar]
- 20.Currat M., Poloni E. S., Sanchez-Mazas A. 2010. Human genetic differentiation across the Strait of Gibraltar. BMC Evol. Biol. 10, 237. 10.1186/1471-2148-10-237 (doi:10.1186/1471-2148-10-237) [DOI] [PMC free article] [PubMed] [Google Scholar]
- 21.Buhler S., Megarbane A., Lefranc G., Tiercy J.-M. 2006. HLA-C molecular characterization of a Lebanese population and genetic structure of 39 populations from Europe to India-Pakistan. Tissue Antigens 68, 44–57 10.1111/j.1399-0039.2006.00621.x (doi:10.1111/j.1399-0039.2006.00621.x) [DOI] [PubMed] [Google Scholar]
- 22.Sanchez-Mazas A., Poloni E. S., Jacques G., Sagart L. 2005. HLA genetic diversity and linguistic variation in East Asia. In The peopling of East Asia: putting together archaeology, linguistics and genetics (eds Sagart L., Blench R., Sanchez-Mazas A.), pp. 273–296 London, UK: RoutledgeCurzon [Google Scholar]
- 23.Sanchez-Mazas A. 2001. African diversity from the HLA point of view: influence of genetic drift, geography, linguistics, and natural selection. Hum. Immunol. 62, 937–948 10.1016/S0198-8859(01)00293-2 (doi:10.1016/S0198-8859(01)00293-2) [DOI] [PubMed] [Google Scholar]
- 24.Renquin J., Sanchez-Mazas A., Halle L., Rivalland S., Jaeger G., Mbayo K., Bianchi F., Kaplan C. 2001. HLA class II polymorphism in Aka Pygmies and Bantu Congolese and a reassessment of HLA-DRB1 African diversity. Tissue Antigens 58, 211–222 10.1034/j.1399-0039.2001.580401.x (doi:10.1034/j.1399-0039.2001.580401.x) [DOI] [PubMed] [Google Scholar]
- 25.Tiercy J. M., et al. 1992. HLA-DR polymorphism in a Senegalese Mandenka population: DNA oligotyping and population genetics of DRB1 specificities. Am. J. Hum. Genet. 51, 592–608 [PMC free article] [PubMed] [Google Scholar]
- 26.Meyer D., Single R. M., Mack S. J., Erlich H. A., Thomson G. 2006. Signatures of demographic history and natural selection in the human major histocompatibility complex loci. Genetics 173, 2121–2142 10.1534/genetics.105.052837 (doi:10.1534/genetics.105.052837) [DOI] [PMC free article] [PubMed] [Google Scholar]
- 27.Sanchez-Mazas A. 2007. An apportionment of human HLA diversity. Tissue Antigens 69(Suppl. 1), 198–202 10.1111/j.1399-0039.2006.00802.x (doi:10.1111/j.1399-0039.2006.00802.x) [DOI] [PubMed] [Google Scholar]
- 28.Prugnolle F., Manica A., Charpentier M., Guegan J. F., Guernier V., Balloux F. 2005. Pathogen-driven selection and worldwide HLA class I diversity. Curr. Biol. 15, 1022–1027 10.1016/j.cub.2005.04.050 (doi:10.1016/j.cub.2005.04.050) [DOI] [PubMed] [Google Scholar]
- 29.Mack S. J., Tsai Y., Sanchez-Mazas A., Erlich H. A. 2006. 13th International Histocompatibility Workshop Anthropology/Human Genetic Diversity Joint Report — chapter 3: Anthropology/human genetic diversity population reports. In Immunobiology of the human MHC: Proc. 13th Int. Histocompatibility Workshop and Conf. (ed. Hansen J. A.), pp. 580–652 Seattle, WA: IHWG Press [Google Scholar]
- 30.Bodmer J., Cambon-Thomsen A., Jors J., Piazza A., Sanchez-Mazas A. 1997. Anthropology report: introduction. In Proc. 12th Int. Histocompatibility Workshop and Conf. (ed. Charron D.), pp. 269–284 Paris, Italy: EDK [Google Scholar]
- 31.Mack S. J., Meyer D., Single R., Sanchez-Mazas A., Thomson G., Erlich H. A. 2007. 13th international histocompatibility workshop anthropology/human genetic diversity joint report—chapter 1: Introduction and overview. In Immunobiology of the human MHC: Proc. 13th Int. Histocompatibility Workshop and Conf. (ed. Hansen J. A.), pp. 560–563 Seattle, WA: IHWG Press [Google Scholar]
- 32.Hurlbert S. H. 1971. The non-concept of species diversity: a critique and alternative parameters. Ecology 52, 577–586 10.2307/1934145 (doi:10.2307/1934145) [DOI] [PubMed] [Google Scholar]
- 33.El Mousadik A., Petit R. J. 1996. High level of genetic differentiation for allelic richness among populations of the argan tree [Argania spinosa (L) Skeels] endemic to Morocco. Theor. Appl. Genet. 92, 832–839 10.1007/BF00221895 (doi:10.1007/BF00221895) [DOI] [Google Scholar]
- 34.Dunn R. R., Davies T. J., Harris N. C., Gavin M. C. 2010. Global drivers of human pathogen richness and prevalence. Proc. R. Soc. B 277, 2587–2595 10.1098/rspb.2010.0340 (doi:10.1098/rspb.2010.0340) [DOI] [PMC free article] [PubMed] [Google Scholar]
- 35.Fincher C. L., Thornhill R., Murray D. R., Schaller M. 2008. Pathogen prevalence predicts human cross-cultural variability in individualism/collectivism. Proc. R. Soc. B 275, 1279–1285 10.1098/rspb.2008.0094 (doi:10.1098/rspb.2008.0094) [DOI] [PMC free article] [PubMed] [Google Scholar]
- 36.Guernier V., Hochberg M. E., Guegan J. F. O. 2004. Ecology drives the worldwide distribution of human diseases. PloS Biol. 2, 740–746 10.1371/journal.pbio.0020141 (doi:10.1371/journal.pbio.0020141) [DOI] [PMC free article] [PubMed] [Google Scholar]
- 37.Blackwell J. M., Jamieson S. E., Burgner D. 2009. HLA and infectious diseases. Clin. Microbiol. Rev. 22, 370–385 10.1128/CMR.00048-08 (doi:10.1128/CMR.00048-08) [DOI] [PMC free article] [PubMed] [Google Scholar]
- 38.Ramachandran S., Deshpande O., Roseman C. C., Rosenberg N. A., Feldman M. W., Cavalli-Sforza L. L. 2005. Support from the relationship of genetic and geographic distance in human populations for a serial founder effect originating in Africa. Proc. Natl Acad. Sci. USA 102, 15 942–15 947 10.1073/pnas.0507611102 (doi:10.1073/pnas.0507611102) [DOI] [PMC free article] [PubMed] [Google Scholar]
- 39.Ray N. 2002. GEODIST. A program to compute matrices of geographic distances. Geneva, Switzerland: LGB/University of Geneva [Google Scholar]
- 40.Sokal R. R., Rohlf F. J. 1995. Biometry, 3rd edn. New York, NY: Freeman [Google Scholar]
- 41.Poloni E. S., Naciri Y., Bucho R., Niba R., Kervaire B., Excoffier L., Langaney A., Sanchez-Mazas A. 2009. Genetic evidence for complexity in ethnic differentiation and history in East Africa. Ann. Hum. Genet. 73, 582–600 10.1111/j.1469-1809.2009.00541.x (doi:10.1111/j.1469-1809.2009.00541.x) [DOI] [PubMed] [Google Scholar]
- 42.Tishkoff S. A., et al. 2009. The genetic structure and history of Africans and African Americans. Science 324, 1035–1044 10.1126/science.1172257 (doi:10.1126/science.1172257) [DOI] [PMC free article] [PubMed] [Google Scholar]
- 43.Sanchez-Mazas A., Poloni E. S. 2008. Genetic diversity in Africa. In Encyclopedia of life sciences (ELS). Chichester: John Wiley & Sons, Ltd. (doi:10.1002/9780470015902.a0020800) [Google Scholar]
- 44.Maca-Meyer N., Gonzalez A. M., Larruga J. M., Flores C., Cabrera V. M. 2001. Major genomic mitochondrial lineages delineate early human expansions. BMC Genet. 2, 13. 10.1186/1471-2156-2-13 (doi:10.1186/1471-2156-2-13) [DOI] [PMC free article] [PubMed] [Google Scholar]
- 45.Macaulay V., et al. 2005. Single, rapid coastal settlement of Asia revealed by analysis of complete mitochondrial genomes. Science 308, 1034–1036 10.1126/science.1109792 (doi:10.1126/science.1109792) [DOI] [PubMed] [Google Scholar]
- 46.Prugnolle F., Manica A., Balloux F. 2005. Geography predicts neutral genetic diversity of human populations. Curr. Biol. 15, R159–R160 10.1016/j.cub.2005.02.038 (doi:10.1016/j.cub.2005.02.038) [DOI] [PMC free article] [PubMed] [Google Scholar]
- 47.Quintana-Murci L., Semino O., Bandelt H. J., Passarino G., McElreavey K., Santachiara-Benerecetti A. S. 1999. Genetic evidence of an early exit of Homo sapiens sapiens from Africa through eastern Africa. Nat. Genet. 23, 437–441 10.1038/70550 (doi:10.1038/70550) [DOI] [PubMed] [Google Scholar]
- 48.Underhill P. A., et al. 2000. Y chromosome sequence variation and the history of human populations. Nat. Genet. 26, 358–361 10.1038/81685 (doi:10.1038/81685) [DOI] [PubMed] [Google Scholar]
- 49.Deshpande O., Batzoglou S., Feldman M. W., Cavalli-Sforza L. L. 2009. A serial founder effect model for human settlement out of Africa. Proc. R. Soc. B 276, 291–300 10.1098/rspb.2008.0750 (doi:10.1098/rspb.2008.0750) [DOI] [PMC free article] [PubMed] [Google Scholar]
- 50.Greenbaum J., Sidney J., Chung J., Brander C., Peters B., Sette A. 2011. Functional classification of class II human leukocyte antigen (HLA) molecules reveals seven different supertypes and a surprising degree of repertoire sharing across supertypes. Immunogenetics 63, 325–335 10.1007/s00251-011-0513-0 (doi:10.1007/s00251-011-0513-0). [DOI] [PMC free article] [PubMed] [Google Scholar]
- 51.Landais E., Romagnoli P. A., Corper A. L., Shires J., Altman J. D., Wilson I. A., Garcia K. C., Teyton L. 2009. New design of MHC class II tetramers to accommodate fundamental principles of antigen presentation. J. Immunol. 183, 7949–7957 10.4049/jimmunol.0902493 (doi:10.4049/jimmunol.0902493) [DOI] [PMC free article] [PubMed] [Google Scholar]
- 52.Sidney J., Steen A., Moore C., Ngo S., Chung J., Peters B., Sette A. 2010. Divergent motifs but overlapping binding repertoires of six HLA-DQ molecules frequently expressed in the worldwide human population. J. Immunol. 185, 4189–4198 10.4049/jimmunol.1001006 (doi:10.4049/jimmunol.1001006) [DOI] [PMC free article] [PubMed] [Google Scholar]
- 53.Kwok W. W., Kovats S., Thurtle P., Nepom G. T. 1993. HLA-DQ allelic polymorphisms constrain patterns of class II heterodimer formation. J. Immunol. 150, 2263–2272 [PubMed] [Google Scholar]
- 54.Kwok W. W., Nepom G. T., Raymond F. C. 1995. HLA-DQ polymorphisms are highly selective for peptide binding interactions. J. Immunol. 155, 2468–2476 [PubMed] [Google Scholar]
- 55.Stoffels R. J., Spencer H. G. 2008. An asymmetric model of heterozygote advantage at major histocompatibility complex genes: degenerate pathogen recognition and intersection advantage. Genetics 178, 1473–1489 10.1534/genetics.107.082131 (doi:10.1534/genetics.107.082131) [DOI] [PMC free article] [PubMed] [Google Scholar]
- 56.Satta Y., O'Huigin C., Takahata N., Klein J. 1994. Intensity of natural selection at the major histocompatibility complex loci. Proc. Natl Acad. Sci. USA 91, 7184–7188 10.1073/pnas.91.15.7184 (doi:10.1073/pnas.91.15.7184) [DOI] [PMC free article] [PubMed] [Google Scholar]
- 57.Slatkin M., Muirhead C. A. 2000. A method for estimating the intensity of overdominant selection from the distribution of allele frequencies. Genetics 156, 2119–2126 [DOI] [PMC free article] [PubMed] [Google Scholar]
- 58.Takahata N., Satta Y., Klein J. 1992. Polymorphism and balancing selection at major histocompatibility complex loci. Genetics 130, 925–938 [DOI] [PMC free article] [PubMed] [Google Scholar]