Abstract
Mass spectrometry with stable isotope labels has been seminal in discovering the dynamic state of living matter1,2 but is limited to bulk tissues or cells. We developed multi-isotope imaging mass spectrometry (MIMS) that allowed us to view and measure stable isotope incorporation with sub-micron resolution3,4. Here we apply MIMS to diverse organisms, including Drosophila, mice, and humans. We test the “immortal strand hypothesis,” which predicts that during asymmetric stem cell division chromosomes containing older template DNA are segregated to the daughter destined to remain a stem cell, thus insuring lifetime genetic stability. After labeling mice with 15N-thymidine from gestation through post-natal week 8, we find no 15N label retention by dividing small intestinal crypt cells after 4wk chase. In adult mice administered 15N-thymidine pulse-chase, we find that proliferating crypt cells dilute label consistent with random strand segregation. We demonstrate the broad utility of MIMS with proof-of-principle studies of lipid turnover in Drosophila and translation to the human hematopoietic system. These studies show that MIMS provides high-resolution quantitation of stable isotope labels that cannot be obtained using other techniques and that is broadly applicable to biological and medical research.
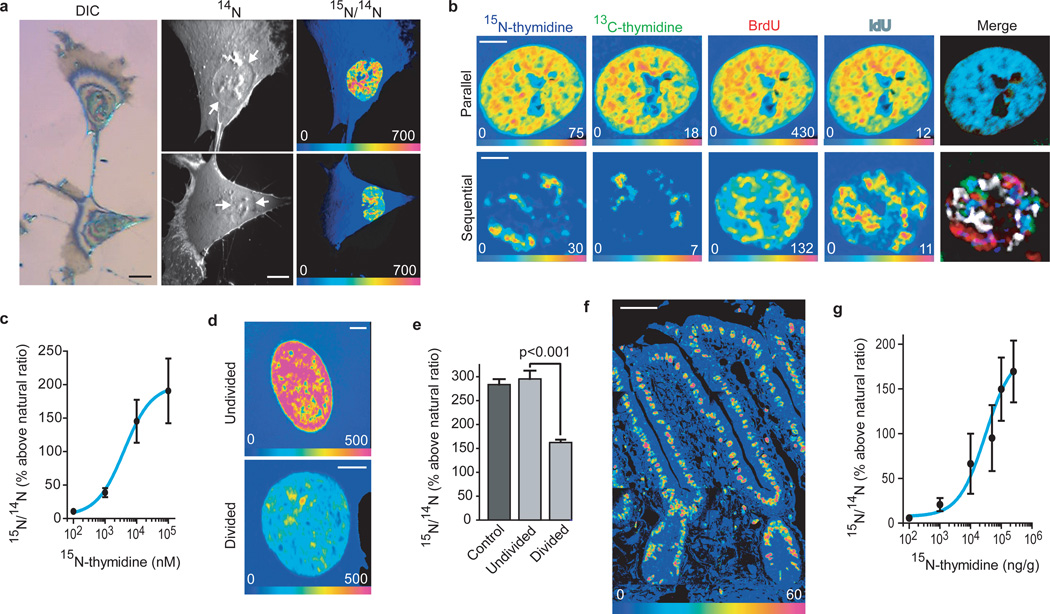
MIMS combines ion microscopy with secondary ion mass spectrometry (SIMS), stable isotope reporters, and intensive computation (Supplemental Fig 1). MIMS allows imaging and measuring stable isotope labels in cell domains smaller than one micron cubed. We tested the potential of MIMS to quantitatively track DNA labeling with 15N-thymidine in vitro. In proliferating fibroblasts, we detected label incorporation within the nucleus by an increase in the 15N/14N ratio above natural ratio (Fig 1a). The labeling pattern resembled chromatin with either stable isotope-tagged thymidine or thymidine analogs (Fig 1b). We measured dose-dependent incorporation of 15N-thymidine over three orders of magnitude (Fig 1d, Supplemental Fig 2). We also tracked fibroblast division after a 24-hour label-free chase (Fig 1d,e, Supplemental Fig 3). Cells segregated into two populations, one indistinguishable from control cells suggesting no division, the other with halving of label, consistent with one division during chase.
Figure 1. MIMS quantitation of stable isotope-labeled thymidine incorporation by dividing cells.
- Dividing fibroblast labeled with 15N-thymidine. The cell surface was sputtered to reach the nuclei. Left: Differential interference contrast reflection microscopy. Middle: MIMS 14N image revealing subcellular details including the nucleus (white arrows) with nucleoli. Right: Hue saturation intensity (HSI) image mapping the 15N/14N ratio. The rainbow scale ranges from blue, set to natural ratio (0.37%, expressed as 0% above natural ratio), to red, where the ratio is several fold above natural ratio (700%=8x natural ratio). 15N labeling is concentrated in the nucleus. Scale bars=10µm.
- Fibroblast nuclei after serial or parallel DNA labeling with 15N-thymidine, 13C-thymidine, BrdU (81Br), or IdU (127I). Parallel labeling (top row): colocalization of label confirmed by the merged image (far right). Sequential labeling (bottom row): non-superimposable nuclear labeling. Scale bars=5µm.
- Concentration-dependent nuclear 15N-labeling in 15N-thymidine treated fibroblasts. Pixel-by-pixel quantitation of 15N-incorporation. Data are derived from the mean of intranuclear pixels. Sigmoidal dose response curve: R2=0.99.
- Nuclei from 15N-thymidine-labeled human foreskin fibroblasts after 24hr chase (cycle ~ 18 hr). Scale bars=5µm.
- One group labeled similarly to control cells (undivided), the other with labeling that was approximately half that of control (divided).
- 15N/14N HSI image of the small intestine. 15N-thymidine labeling (one wk) of nuclei extends from the crypts to the tips of the villi. Mosaic: 8 tiles, 80µm each. Scale bar=30µm.
- Sigmoidal dose response curve: 15N-thymidine labeling after single subcutaneous injection (R2=0.99).
We found similar results by tracking cell division in vivo in the small intestine (Fig 1f,g, Supplemental Figs 4–6). We measured dose-dependent 15N-thymidine incorporation within nuclei of actively dividing crypt cells (Fig 1g, Supplemental Fig 4), down to a dose of 0.1µg/g (Supplemental Fig 2). The cytoplasm was slightly above natural ratio, likely due to low level soluble 15N-thymidine or mitochondrial incorporation (Supplemental Fig 2). We measured halving of label with each division during label-free chase (Supplemental Fig 6).
We then tested the “immortal strand hypothesis,” a concept that emerged from autoradiographic studies5 and that predicted long-term label retaining cells in the small intestinal crypt6,7. It proposes that asymmetrically dividing stem cells also asymmetrically segregate DNA, such that older template strands are retained by daughter cells that will remain stem cells and newer strands are passed to daughters committed to differentiation (Supplemental Fig 7)5,6. Modern studies continue to argue both for8,9,10,11,12 or against13,14,15,16 the hypothesis, leading to the suggestion that definitive resolution of the debate will require a new experimental approach17.
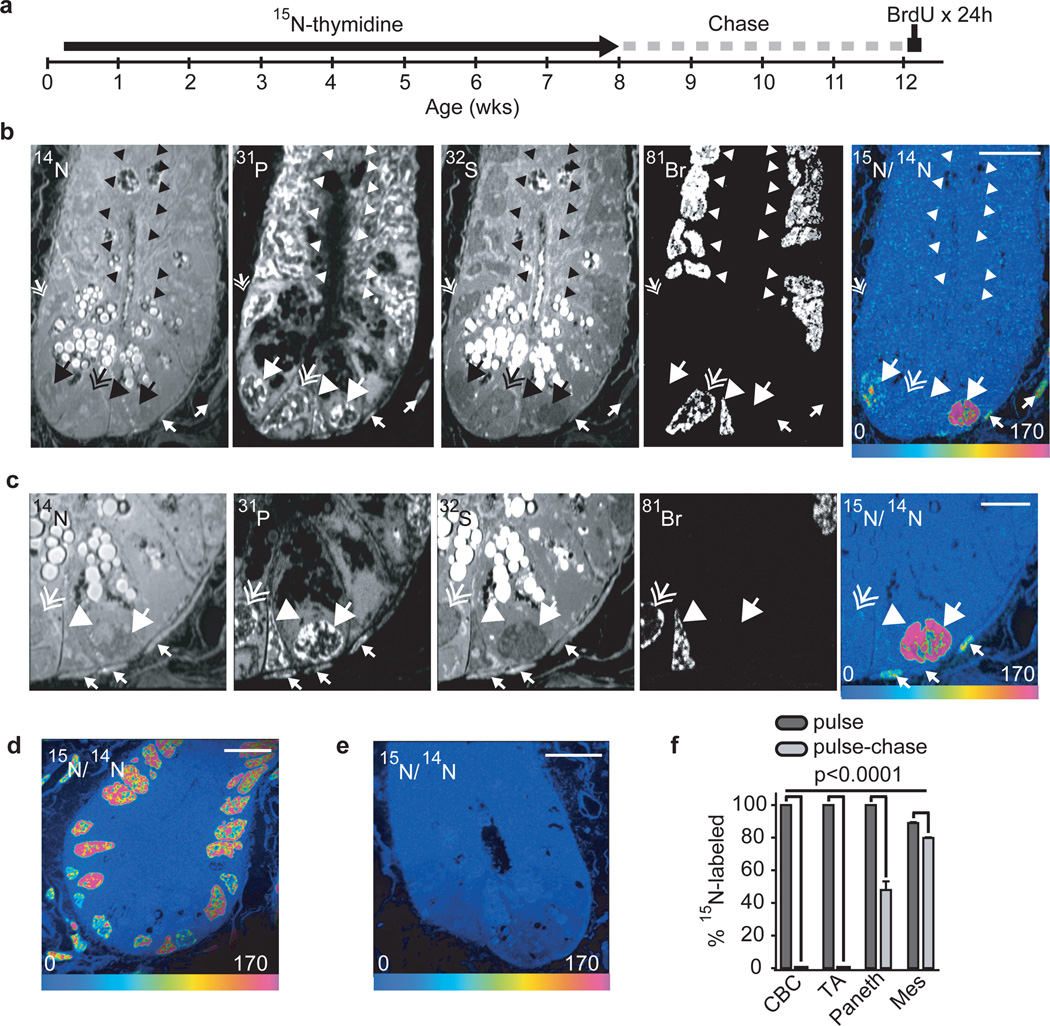
Although prior evidence suggests a concentration of label-retaining cells in the +4 anatomic position7,8, we searched for DNA label retention irrespective of anatomic position or molecular identity. We labeled mice with 15N-thymidine for the first 8 wks of life when intestinal stem cells are proposed to form8. After a 4-wk chase, mice received bromodeoxyuridine (BrdU) for 24h prior to sacrifice to identify proliferating cells(Fig 2a, Supplemental Fig 8: Exp 1), specifically crypt base columnar (CBC) cells and transit amplifying cells (TA) (Supplemental Fig 9), which cycle at a rate of one and two times per 24h, respectively18 (Supplemental Fig 10). All crypt cell nuclei were highly labeled upon completion of 15N-thymidine; after a four-week chase, however, we found no label retention by non-Paneth crypt cells (Fig 2b–f; n=3 mice, 136 crypts analysed). 15N-labeling in BrdU−/15N+ Paneth and mesenchymal cells was equivalent to that measured at pulse completion (Fig2b,c) suggesting quiescence during the chase (values above 15N/14N natural ratio: Paneth pulse=107.8 +/− 5.0% s.e.m. n=51 vs Paneth pulse-chase=96.3+/−2.8% s.e.m. n=218; mesenchymal pulse=92.0+/−5.0% s.e.m. n=89 vs mesenchymal pulse-chase=90.5+/−2.2% s.e.m. n=543). The number of randomly selected crypt sections was sufficient to detect a frequency as low as one label-retaining stem cell per crypt irrespective of anatomic location within the crypt. Because each anatomic level contains approximately 16 circumferentially arrayed cells8, a 2-dimensional analysis captures approximately 1/8th of the cells at each anatomic position (one on each side of the crypt; Supplemental Fig 9a). Therefore, assuming only 1 label-retaining stem cell per crypt we should have found 17 label-retaining cells in the 136 sampled crypts (1/8th of 136); we found 0 (binomial test p<0.0001). The significance of this result held after lowering the expected frequency of label-retaining cells by 25% to account for the development of new crypts, a process thought to continue into adulthood19. In three additional experiments, using shorter labeling periods and including in utero development, we also found no label-retaining cells in the crypt other than Paneth cells (Supplemental Fig 8, Exps 2–4).
Figure 2. No label-retaining stem cells in the small intestinal crypt.
- 15N-thymidine administered from post-natal day 4 - week 8. After 4-wk chase, BrdU was administered (500 µg i.p. Every 6 h) for 24 hrs before sacrifice (See Supplemental Fig 8).
- 14N: crypt structure and intense signal in intracytoplasmic Paneth granules at the crypt base. 31P: intense intranuclear signal. 32S: intense signal within cytoplasmic Paneth cell granules. 81Br: direct measure of BrdU incorporation. 15N/14N HSI: 15N-thymidine labeling within 15N+/BrdU- Paneth cells (large arrow) and mesenchymal cells (small arrows). No other cells reveal 15N retention. Large arrow head: recently formed (15N−/BrdU+) Paneth cell. Small hatched arrow (middle left side of the crypt): unlabeled Paneth cell, (15N−/Br-). Scale bar=15µm.
- Continued analysis of the same crypt after narrowing the acquisition field. High 15N-signal in a BrdU− Paneth cell (large arrow) and mesenchymal cells closely associated with the crypt (small arrows). BrdU+ CBC (hatched arrow) and Paneth cell (arrow head) are 15N−. Scale bar=5µm.
- 15N/14N HSI image of small intestinal crypt at the end of 15N-thymidine pulse. All nuclei are labeled. Nuclei with lesser degrees of labeling likely represent cells born during a period of lower circulating 15N-thymidine as expected given the different labeling protocols (Supplemental Fig 8). Scale bar=20µm.
- Unlabeled mouse image. The entire crypt contains the natural abundance of 15N. Scale bar=10µm.
- Mean % 15N+ cells at the completion of pulse and after pulse-chase (± standard error of CBC, TA, Paneth, and mesenchymal (Mes) cells (n=3 mice per group).
To address the possibility that long-term thymidine exposure or frequent high dose injections introduced pitfalls, we limited labeling to the previously reported peak time period of label-retaining stem cell formation8 and reduced the dose by 50-fold compared to prior experiments (Supplemental Fig 8, Exp 5). Potten and colleagues8 observed approximately 6 label-retaining cells per intestinal circumference with a similar protocol; with about 90 crypts per circumference, this translates to 1 label-retaining cell per 15 sectioned crypts. We analysed 330 crypts and observed 19 15N+/BrdU− Paneth cells (one per 17 crypt sections), but no non-Paneth label-retaining cells (expected = 21; observed = 0; binomial test p<0.0001) or doubly labeled (15N+/BrdU+) cells irrespective of cellular identity. Thus, after labeling during all potential periods of stem cell formation, spanning in utero through post-natal development, we found no label-retaining stem cells in the small intestinal crypt other than Paneth cells, which are largely quiescent. We conclude therefore that the phenomenon of label retaining cells as described by others was most likely due either to reagent toxicity or to insufficient resolution with the consequent misidentification of labeled post-mitotic Paneth cell nuclei as label retaining +4 stem cells. MIMS minimizes these potential artifacts due to its ability to detect non-radioactive isotopes and the high imaging resolution both lateral and vertical. Although our data cannot directly exclude the migration of label-retaining stem cells into the crypt under non-homeostatic conditions such as radiation injury11, prior examinations of crypt clones argue against contributions from either a resting stem cell population or from stem cells originating outside the crypt20.
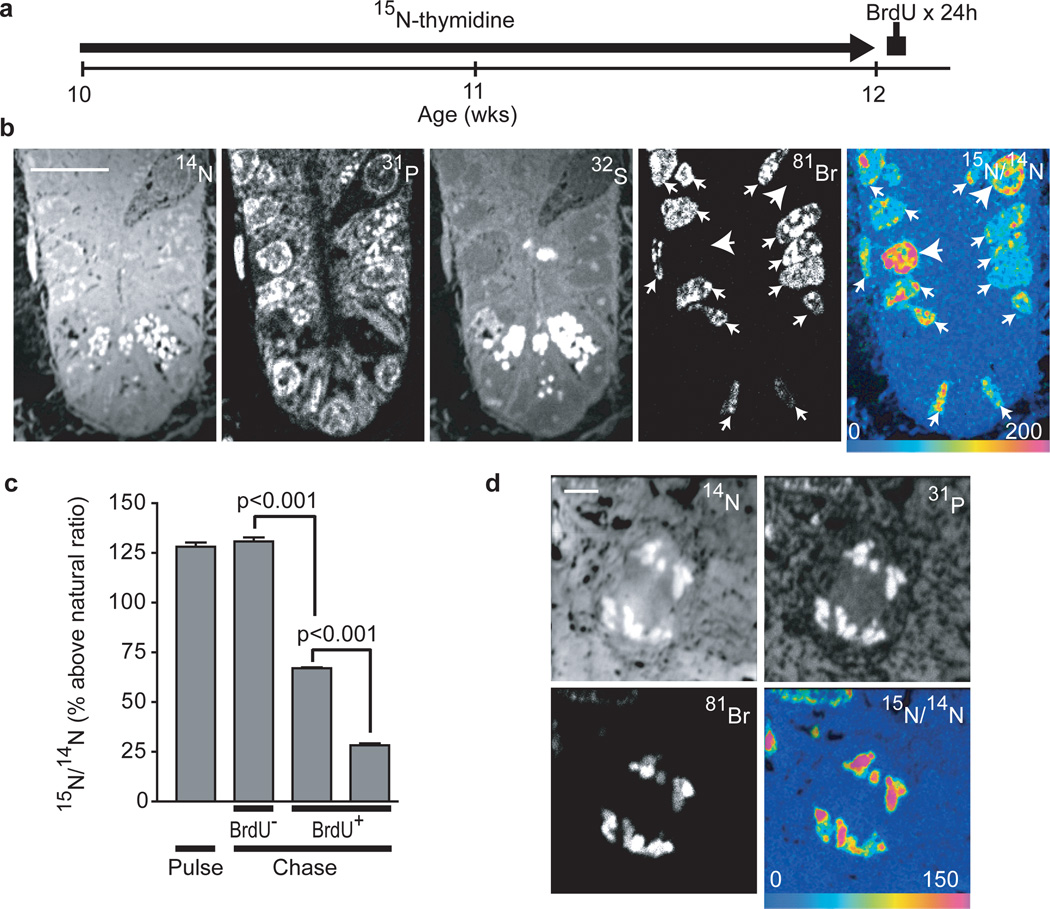
We also studied label release in adult mice after stem cell formation. These experiments are particularly relevant given the recent suggestion that crypt stem cells exhibit monoclonal drift over 8 months21,22, a model that is incompatible with lifetime survival of label-retaining stem cells but that does not exclude the possibility of biased template strand segregation. After administering 15N-thymidine for 2 wks to label all proliferating crypt cells, 15N-thymidine was stopped and BrdU was administered for 24h to label cells dividing during the 15N-thymidine-free chase (Fig 3a). A consequence of the “immortal strand hypothesis” would be that a stem cell would produce a daughter in which 15N label was completely lost with the first division during chase (Supplemental Fig 7). We observed no such BrdU+/15N− crypt cells, even after extending the 15N-thymidine-free chase to 48h (Fig 3b, Supplemental Fig 11). Proliferating (BrdU+) crypt cells (n=3mice; 563 cells analysed) diluted 15N-thymidine label (mean=71% above natural ratio) compared to undivided (BrdU-) cells (129% above natural ratio) or cells analysed at the end of 15N-thymidine pulse (128% above natural ratio), as expected of cells undergoing random chromosomal segregation (Fig 3c). We also analysed crypt cell nuclei in late mitosis, finding 15N label and BrdU in both sets of segregating chromosomes (Fig 3d, Supplemental Fig 12, n=232). Together, these data result from an analysis of 625 crypts, in which we did not find a single BrdU+ nucleus or chromosomal complement that was not 15N-labeled, suggesting that dividing cells in the crypt uniformly dilute labeled DNA in a pattern consistent with random DNA strand segregation.
Figure 3. Label-dilution in adult mice indicates random segregation of DNA strands.
- 15N-thymidine administered for 2 wks to adult mice (osmotic mini-pump: 20µg/h), then BrdU for 24h before sacrifice (See Supplemental Fig 8).
- Dividing cells (BrdU+) dilute 15N-thymidine label (small arrows) relative to undivided cells (BrdU−) (large arrows). Note 2 CBC cells with elongated nuclei at the crypt base. Scale bar=10µm.
- Divided crypt cells (BrdU+), residing in CBC or +4–10 positions, demonstrated 15N-dilution consistent with 1 or 2 rounds of division during the chase (n = 3 mice per group).
- Mitotic crypt cell. Segregating chromosomes are visible in 14N and 31P images. 15N-label and BrdU were measured in both segregating chromosomal complements consistent with symmetric chromosomal segregation. Scale bar=2µm.
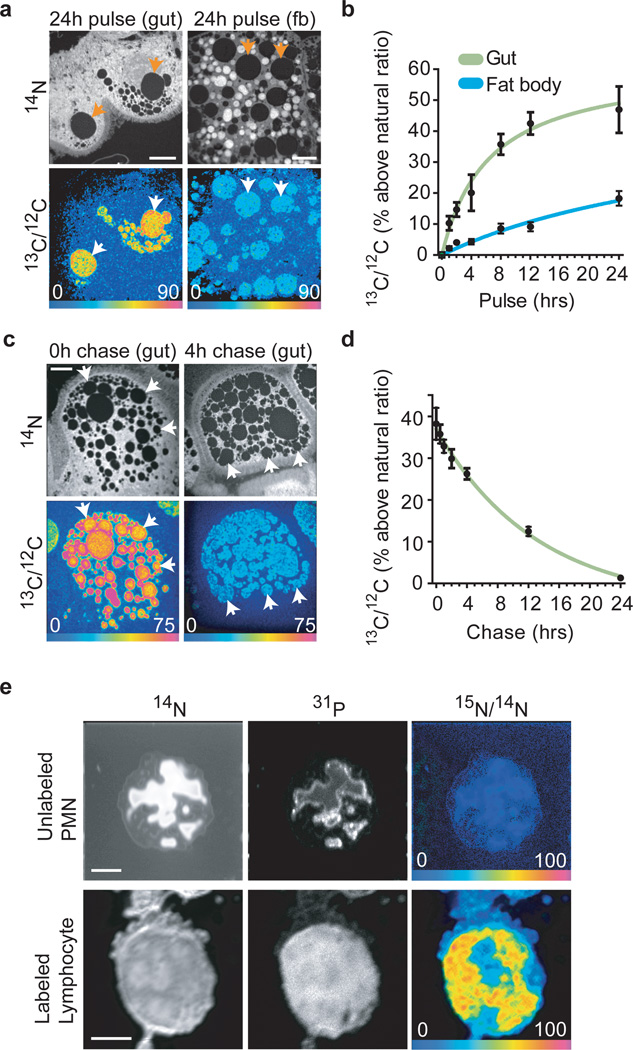
The broad applicability of MIMS is demonstrated by proof-of-principle studies in Drosophila and humans. Drosophila provides a model system to study the genetics of lipid metabolism, in vivo. Due to its small size, however, it is difficult to obtain sufficient material from specific tissue/cell types for measurement with conventional mass spectrometry. A previous study showed numerous lipid droplets in enterocytes within a segment of the Drosophila larval intestine, the anterior midgut23. We therefore used MIMS to measure the incorporation and turnover of diet-derived 13C-palmitate. Following larval exposure to dietary 13C-palmitate, label is incorporated into enterocyte lipid droplets with a subcellular pattern similar to that seen with a neutral lipid dye (compare Fig 4a with supplementary Fig. 13). Dietary 13C-palmitate pulses of varying periods indicate that the rate of 13C label incorporation into lipid droplets is greater in anterior midgut enterocytes than in the adipocytes of the fat body, the major lipid storage depot in Drosophila (Fig. 4a,b). Pulse-chase experiments with dietary 13C-palmitate also demonstrate a reproducible exponential decay (R2=0.9) of the 13C signal within enterocyte lipid droplets and provide an estimate for the half-life of ~9 h (Fig. 4c,d). These results demonstrate the utility of MIMS for precise measurement of in vivo lipid turnover at high resolution within individual Drosophila lipid droplets.
Figure 4. Extending MIMS to Drosophila and human metabolism.
- Drosophila anterior midgut enterocytes (gut, left panels) accumulate more 13C from 24hr exposure to dietary 13C-palmitate than adipocytes (fat body cells; fb, right panels). Lipid droplets (arrows) have low nitrogen content and so appear dark in 14N images (top panels). The 13C/12C HSI images reveal 13C incorporation into lipid droplets. Scale bars=10µm.
- Timecourse of 13C accumulation in Drosophila lipid droplets of anterior midgut enterocytes (Gut) and adipocytes (Fat body) over 24hr of larval exposure to dietary 13C-palmitate. Initial rates of 13C-incorporation in the lipid droplets were 9.7%/hr (Gut) and 1.16%/hr (Fat body) with the first timepoint after pulse taken at 1hr.
- Rapid lipid turnover in Drosophila anterior midgut enterocytes (gut) after larval dietary 13C-palmitate pulse-chase. Upper panels show 14N images and lower panels show corresponding 13C/12C HSI images, indicating strong 13C incorporation at the end of the pulse (bottom left) and rapid elimination during a 4 hr chase (bottom right). Scale bar=5µm.
- 13C tracer dilution in the lipid droplets of anterior midgut enterocytes during a label-free chase fits an exponential decay curve (R2=0.90, half-life=9.1 h).
- 15N-thymidine administered for 48hrs: no labeled WBC were found. After a 4 wk chase we found few labeled lymphocytes. Top: unlabeled polymorphonuclear leukocyte (PMN) with multi-lobed nucleus. Bottom: 15N-labeled lymphocyte after chase. The round nucleus seen in the 31P image occupies the majority of the cell, as is typical for lymphocytes. Scale bars=3µm.
In the first MIMS human experiment, we administered 15N-thymidine to a healthy volunteer by intravenous infusion for 48h. We performed MIMS analysis on peripheral white blood cell (WBC) smears. We found no labeled WBC at the end of the infusion (3600 analysed). After a 4-wk chase we found a few labeled WBC (Fig 4c: 4 of ~2000 cells analysed) consistent with a lag time before release from the bone marrow (Chi-squared, p<0.01). Radiolabeled thymidine has been administered to humans in numerous prior studies24, but these studies were conducted primarily on cancer patients. There is no known risk to using stable isotopes25. Thus, this experiment now opens the door to studies of metabolism and cell tracking in humans.
In conclusion, we provide direct evidence under physiological conditions against non-random template strand segregation in the small intestine. Our approach encompasses all potential stem cell populations in the crypt, those identifiable by known markers26,27,28 and putative ones not identified by a specific marker. We have demonstrated the power of MIMS to image and quantitate cell metabolism in three different contexts: mammalian intestinal cell division, Drosophila lipid metabolism, and human lymphopoiesis. We anticipate that the measuring and imaging power of MIMS will make it a major tool to study metabolism and cell fate in animals and humans.
METHODS SUMMARY
Data were acquired with the prototype (4 detectors) and a second-generation instrument (NanoSIMS 50L, Cameca: 7 detectors). Quantitative mass images were analysed with “Open MIMS” software, a plug-in to ImageJ (http://www.nrims.harvard.edu/software.php). Stable isotopes were obtained from Cambridge Isotopes, Inc. (15N-thymidine, 13C-thymidine) and Sigma-Aldrich, Inc. (13C-palmitate).
Full Methods and any associated references are available in the online version of the paper at www.nature.com/nature.
Supplementary Material
Acknowledgements
We thank A. Mudge, M. Raff, and A. Aperia for critical reading of the manuscript; M. Wang for MIMS analysis; C. Poczatek and Z. Kaufman for MIMS analysis software development; C. MacGillivray, L. Takrimas, S. Clark, and E. Hurst for histology; W. Wang for statistics advice. We thank Cambridge Isotope Laboratories for their generous gift of thymidine (15N2, 96–98%). M.L.S is funded by the American Heart Association and Future Leaders in Cardiovascular Medicine. A.P.G is funded by the Medical Research Council (U117584237). R.T.L is funded by the National Institutes of Health (AG032977) and a grant from the Harvard Stem Cell Institute. C.P.L. is funded by the National Institutes of Health (EB001974, AG034641), the Ellison Medical Foundation, and Human Frontier Science Program.
Footnotes
Supplementary Information is linked to the online version of the paper at www.nature.com/nature.
Author Contributions
M.L.S. ran with MIMS in the small intestine; C.P.L. conceived of the general application of MIMS to metabolism and cell turnover. M.L.S. designed the in vivo mouse experiments with input from C.P.L.; M.L.S. performed in vivo mouse experiments with help from S.S. A.B. designed the Drosophila experiments with input from A.P.G.; A.B. and A.P.G. performed the Drosophila experiments. M.L.S. designed the human experiment with input from R.T.L. and T.S.P.; M.L.S. and T.S.P. conducted the human protocol. C.P.L. designed and performed in vitro experiments. S.S. was involved in study design. M.L.S. analysed the data with C.P.L. input. C.G. operated the instrument and assisted with analysis of Drosophila lipid droplets. M.L.S., A.B., A.P.G. and C.P.L. wrote the manuscript. R.T.L. was involved in study design and provided critical feedback at all junctures.
Author Information
Reprints and permissions information is available at www.nature.com/reprints.
The authors report no competing financial interests.
References
- 1.Schoenheimer R, Rittenberg D. The Application of Isotopes to the Study of Intermediary Metabolism. Science. 1938;87:221–226. doi: 10.1126/science.87.2254.221. [DOI] [PubMed] [Google Scholar]
- 2.Schoenheimer R, et al. The Application of the Nitrogen Isotope N15 for the Study of Protein Metabolism. Science. 1938;88:599–600. doi: 10.1126/science.88.2295.599. [DOI] [PubMed] [Google Scholar]
- 3.Lechene C, et al. High-resolution quantitative imaging of mammalian and bacterial cells using stable isotope mass spectrometry. J Biol. 2006;5:20. doi: 10.1186/jbiol42. [DOI] [PMC free article] [PubMed] [Google Scholar]
- 4.Lechene CP, Luyten Y, McMahon G, Distel DL. Quantitative imaging of nitrogen fixation by individual bacteria within animal cells. Science. 2007;317:1563–1566. doi: 10.1126/science.1145557. [DOI] [PubMed] [Google Scholar]
- 5.Lark KG, Consigli RA, Minocha HC. Segregation of sister chromatids in mammalian cells. Science. 1966;154:1202–1205. doi: 10.1126/science.154.3753.1202. [DOI] [PubMed] [Google Scholar]
- 6.Cairns J. Mutation selection and the natural history of cancer. Nature. 1975;255:197–200. doi: 10.1038/255197a0. [DOI] [PubMed] [Google Scholar]
- 7.Potten CS, Hume WJ, Reid P, Cairns J. The segregation of DNA in epithelial stem cells. Cell. 1978;15:899–906. doi: 10.1016/0092-8674(78)90274-x. [DOI] [PubMed] [Google Scholar]
- 8.Potten CS, Owen G, Booth D. Intestinal stem cells protect their genome by selective segregation of template DNA strands. J Cell Sci. 2002;115:2381–2388. doi: 10.1242/jcs.115.11.2381. [DOI] [PubMed] [Google Scholar]
- 9.Shinin V, Gayraud-Morel B, Gomes D, Tajbakhsh S. Asymmetric division and cosegregation of template DNA strands in adult muscle satellite cells. Nat Cell Biol. 2006;8:677–687. doi: 10.1038/ncb1425. [DOI] [PubMed] [Google Scholar]
- 10.Conboy MJ, Karasov AO, Rando TA. High incidence of non-random template strand segregation and asymmetric fate determination in dividing stem cells and their progeny. PLoS Biol. 2007;5:e102. doi: 10.1371/journal.pbio.0050102. [DOI] [PMC free article] [PubMed] [Google Scholar]
- 11.Quyn AJ, et al. Spindle orientation bias in gut epithelial stem cell compartments is lost in precancerous tissue. Cell Stem Cell. 2010;6:175–181. doi: 10.1016/j.stem.2009.12.007. [DOI] [PubMed] [Google Scholar]
- 12.Rando TA. The immortal strand hypothesis: segregation and reconstruction. Cell. 2007;129:1239–1243. doi: 10.1016/j.cell.2007.06.019. [DOI] [PubMed] [Google Scholar]
- 13.Kiel MJ, et al. Haematopoietic stem cells do not asymmetrically segregate chromosomes or retain BrdU. Nature. 2007;449:238–242. doi: 10.1038/nature06115. [DOI] [PMC free article] [PubMed] [Google Scholar]
- 14.Sotiropoulou PA, Candi A, Blanpain C. The majority of multipotent epidermal stem cells do not protect their genome by asymmetrical chromosome segregation. Stem Cells. 2008;26:2964–2973. doi: 10.1634/stemcells.2008-0634. [DOI] [PubMed] [Google Scholar]
- 15.Schepers AG, et al. Lgr5 intestinal stem cells have high telomerase activity and randomly segregate their chromosomes. EMBO J. 2011;30:1104–1109. doi: 10.1038/emboj.2011.26. [DOI] [PMC free article] [PubMed] [Google Scholar]
- 16.Lansdorp PM. Immortal strands? Give me a break. Cell. 2007;129:1244–1247. doi: 10.1016/j.cell.2007.06.017. [DOI] [PubMed] [Google Scholar]
- 17.Pech MF, Artandi SE. TRAPping telomerase within the intestinal stem cell niche. EMBO J. 2011;30:986–987. doi: 10.1038/emboj.2011.51. [DOI] [PMC free article] [PubMed] [Google Scholar]
- 18.Cheng H, Leblond CP. Origin, differentiation and renewal of the four main epithelial cell types in the mouse small intestine. V. Unitarian Theory of the origin of the four epithelial cell types. Am J Anat. 1974;141:537–561. doi: 10.1002/aja.1001410407. [DOI] [PubMed] [Google Scholar]
- 19.Totafurno J, Bjerknes M, Cheng H. The crypt cycle. Crypt and villus production in the adult intestinal epithelium. Biophys J. 1987;52:279–294. doi: 10.1016/S0006-3495(87)83215-0. [DOI] [PMC free article] [PubMed] [Google Scholar]
- 20.Bjerknes M, Cheng H. Clonal analysis of mouse intestinal epithelial progenitors. Gastroenterology. 1999;116:7–14. doi: 10.1016/s0016-5085(99)70222-2. [DOI] [PubMed] [Google Scholar]
- 21.Lopez-Garcia C, Klein AM, Simons BD, Winton DJ. Intestinal Stem Cell Replacement Follows a Pattern of Neutral Drift. Science. 2010 doi: 10.1126/science.1196236. [DOI] [PubMed] [Google Scholar]
- 22.Snippert HJ, et al. Intestinal crypt homeostasis results from neutral competition between symmetrically dividing Lgr5 stem cells. Cell. 2010;143:134–144. doi: 10.1016/j.cell.2010.09.016. [DOI] [PubMed] [Google Scholar]
- 23.Gutierrez E, Wiggins D, Fielding B, Gould AP. Specialized hepatocyte-like cells regulate Drosophila lipid metabolism. Nature. 2007;445:275–280. doi: 10.1038/nature05382. [DOI] [PubMed] [Google Scholar]
- 24.Schick P, et al. Labelling of human resting lymphocytes by continuous infusion of [3H]thymidine. I. Characterization of cytoplasmic label. J Cell Sci. 1978;33:351–362. doi: 10.1242/jcs.33.1.351. [DOI] [PubMed] [Google Scholar]
- 25.Sturup S, Hansen HR, Gammelgaard B. Application of enriched stable isotopes as tracers in biological systems: a critical review. Anal Bioanal Chem. 2008;390:541–554. doi: 10.1007/s00216-007-1638-8. [DOI] [PubMed] [Google Scholar]
- 26.Barker N, et al. Identification of stem cells in small intestine and colon by marker gene Lgr5. Nature. 2007;449:1003–1007. doi: 10.1038/nature06196. [DOI] [PubMed] [Google Scholar]
- 27.Sangiorgi E, Capecchi MR. Bmi1 is expressed in vivo in intestinal stem cells. Nat Genet. 2008;40:915–920. doi: 10.1038/ng.165. [DOI] [PMC free article] [PubMed] [Google Scholar]
- 28.Montgomery RK, et al. Mouse telomerase reverse transcriptase (mTert) expression marks slowly cycling intestinal stem cells. Proc Natl Acad Sci U S A. 2011;108:179–184. doi: 10.1073/pnas.1013004108. [DOI] [PMC free article] [PubMed] [Google Scholar]
Associated Data
This section collects any data citations, data availability statements, or supplementary materials included in this article.


