Abstract
Objective:
Blood pressure (BP) decline and recovery during the Valsalva maneuver (VM) are used to evaluate the degree of sympathetic failure (SF) but a reliable sympathetic index (SI) derived from VM is lacking.
Methods:
Patients with mild (n = 20), moderate (n = 65), and severe (n = 60) SF and 23 healthy controls were evaluated using a standardized battery of autonomic tests. SF was defined as mild (associated with reduced sudomotor volumes at distal leg); moderate (associated with a fall in systolic BP ≥ 10 < 30 mm Hg during the tilt test); and severe (associated with a fall in systolic BP ≥30 mm Hg during the tilt test). Six SIs were compared: SI1 (BP fall during phase 2), SI2 (BP recovery during phase 2), SI3 (the difference in BP between baseline and the end of phase 2), SI4 (the magnitude of phase 4), SI5 (BP recovery time), and SI6 (baroreflex sensitivity index).
Results:
All indexes showed overall significant differences among tested groups (p < 0.05). Only SI3 differentiated all subject groups. Compared to other SIs, SI3 correlated the most with orthostatic hypotension (OH; r = 0.62, p < 0.05) during the tilt.
Conclusions:
SI3 is the optimal method for calculation of SI since it 1) easily differentiates between healthy controls and those with SF; 2) correlates with the OH, a proxy for a sympathetic failure; 3) tracks the full spectrum of SF (mild–moderate–severe). SI3 expands the utility of quantitative autonomic testing.
The Valsalva maneuver (VM) is a sensitive, noninvasive, and widely available clinical test to identify sympathetic adrenergic failure (SF).1 VM provides an indirect index of sympathetic vasoconstrictor functions based on characteristic blood pressure (BP) responses.2–4 A direct measurement of the sympathetic activity, for example, from the muscle using microneurography, remains primarily a research tool with limited clinical applications.5,6 Catecholamine levels, including norepinephrine, beside being invasive, do not correlate well with SF.7 With the availability of noninvasive continuous BP monitoring, VM is typically utilized as a part of the Ewing battery of cardiovascular autonomic function tests that includes deep breathing, VM, and tilt table testing.8 The tilt test is a standard test for valuation of sympathetic adrenergic functions but it may not detect milder forms of SF due to its limited sensitivity. The primary advantage of VM is that it expands the sensitivity of the tilt test in detecting milder forms of sympathetic impairment.1,3
VM results in a fall in BP that elicits the sympathetic-mediated vasoconstrictor response resulting in BP recovery via baroreflex.4,9 Common approaches to evaluate sympathetic responses utilize either the magnitude or duration of BP changes evoked by VM. However, differences in definitions of sympathetic indexes (SIs) derived from VM pose a challenge for comparative quantitative analysis.
This study compared several methods of evaluating hemodynamic responses to VM. These methods were applied to patients with graded SF, a study design previously used for validation of VM.3,10
METHODS
Study population.
This retrospective, single-center study included subjects with a history of autonomic testing. The most common diagnoses were multiple system atrophy, PD, and diabetic and nondiabetic neuropathy. Group 1, 23 healthy subjects (age 58.3 ± 10.3 [mean ± SD], 13/10 [women/men]), had normal sympathetic functions, defined as having systolic BP drop ≤10 mm Hg during tilt and normal quantitative sudomotor axon reflex test (QSART) at distal leg. The patients were divided into groups with different degree of SF. Group 2 (n = 20, age 53.7 ± 15.6, 10/10) included subjects with mild SF defined as having abnormal QSART at distal leg and systolic BP drop ≤10 mm Hg during the tilt test. Group 3 (n = 65, age 60.4 ± 15.1, 37/28) included those with moderate SF, defined by the presence of borderline orthostatic hypotension (OH) with systolic BP fall ≥ 10 < 30 mm Hg.10 Group 4 (n = 60, 62.3 ± 13.4, 28/32) included patients with severe SF, defined by the presence of OH with systolic BP fall ≥30 mm Hg during the tilt test.
Medication that affects autonomic testing or causing OH was stopped for 5 half-lives if this was considered to be safe. Levodopa and dopaminergic medication was allowed because levodopa has no major cardiovascular effect in most patients.11,12 In the University of Massachusetts Autonomic Laboratory protocol, all patients with OH during the autonomic testing are evaluated for non-neurogenic causes such as dehydration (by observing dry skin and mouth, tachycardia, tachypnea), anemia (checking hematocrit or reviewing medical history), cardiac arrhythmia (evaluating ECG), medication-induced OH (by reviewing current and recently used medication), and heart failure (by observing shortness of breath, distal edema, a square variant of VM, reviewing medical history). The following subjects were excluded from the study: 16 subjects who had a square wave variant of VM, 11 patients with syncope, 3 subjects who were unable to follow instructions due to cognitive impairment, one patient with PD who had severe tremor that caused poor BP signal quality, and 12 subjects who were taking medication that can affect the results of autonomic function tests.
Standard protocol approvals, registrations, and patient consents.
The study was approved by the Institutional Review Board of the University of Massachusetts Medical School as a minimal risk study.
Autonomic testing.
Standardized autonomic testing included deep breathing, VM, head-up tilt, and QSART. Subjects were asked to refrain from caffeinated beverages, alcohol, and smoking on the day of testing. All tests were performed in an air-conditioned room at 23°C. ECG, continuous BP monitoring using Finometer® (FMS, Amsterdam, Netherlands), and respiratory movement were obtained throughout the testing. In addition, BP was obtained at the baseline before each test automatically with the use of a Dinamap ProCare Monitor 100 (GE, Fairfield, CT). Cardiovagal functions were evaluated by the heart rate responses to deep breathing and to VM. Deep breathing was done in supine position. After a relaxation period of at least 5 minutes, the patient was instructed to breathe at a rate of 6 breaths per minute (5 seconds of inhalation and 5 seconds of exhalation). Sympathetic functions were measured by BP responses to VM and to tilt. VM was done in the supine position with the head slightly elevated by a pillow. VM was performed with expiratory pressure equal to 40 mm Hg for 15 seconds by blowing through the mouthpiece attached to a manometer. If the subject was unable to perform VM because of air leak around the mouthpiece that was due to mild facial muscle strength, apraxia, tremor, or rigidity, gentle pressure with fingers was applied to the mouth to seal the air leak. This technique was effective in most of the patients as long as a patient was able to generate adequate expiratory pressure. The tilt protocol included 10 minutes in the supine position and at least 10 minutes of a tilt at 70 degrees if it was considered safe. The BP was monitored with Finometer® continuously and every 1 minute with the use of a Dinamap ProCare Monitor 100 during the tilt. Patients were continuously monitored for dizziness, chest pain, and shortness of breath or other signs of discomfort during the tilt test. Postganglionic sympathetic sudomotor functions were analyzed by QSART at the forearm, proximal leg, distal leg, and foot using Q-Sweat machine (WR Medical Electronics, Stillwater, MN). The volume of capsules was 0.1229 cm2, stimulation current was 2 mA, and duration of stimulation was 5 minutes. The sweat volume was collected for 10 minutes. All testing was performed following established standards.13
Definition of VM phases.
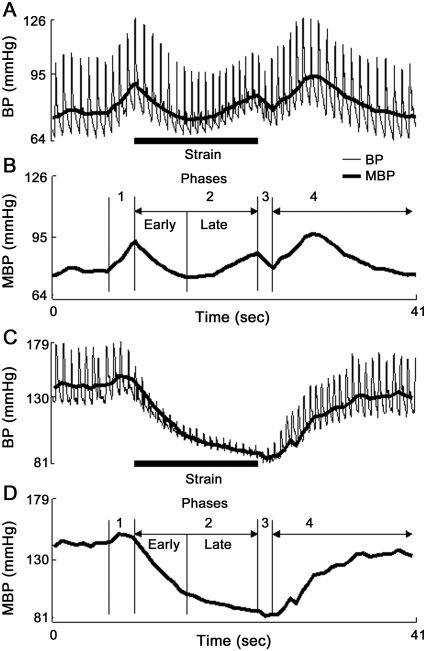
VM is forced expiration against a resistance. In a healthy subject, VM evokes characteristic hemodynamic BP responses. The division of VM into 4 phases (figure 1, figure e-1 on the Neurology® Web site at www.neurology.org) was proposed by Hamilton et al.14 Phases 1 and 3 are largely due to mechanical factors. Transient elevation of the BP during phase 1 is mainly due to compression of the aorta with passive transmit of elevated pressure into the peripheral circulation and an increase of stroke volume due to reduced afterload. Phase 1 starts at the onset of the initial deeper breath causing a breathing artifact. The duration of this phase is about 2–4 seconds. In our protocol, phase 2 starts when the expiratory pressure reaches 40 mm Hg and continues 15 seconds. The BP falls during early phase 2 because of the reduction in left atrial and left ventricular dimension, reduction of stroke volume, and cardiac output due to reduced venous return. The fall in BP activates sympathetic vasomotor nerves that increase the peripheral resistance. The BP response depends on the degree of sympathetic activation. In healthy subjects, BP recovers back to or above the baseline. In SF, BP recovery is reduced or absent. Phase 3 starts with the release of the strain and ends when the BP starts to rise. The BP falls during phase 3 due to the release of the expiratory pressure and related increase in left ventricular afterload and a sudden expansion of intrathoracic vessels. The BP rise during phase 4, “the overshoot,” is due to persistent vasoconstriction that started during phase 2. The duration of phase 4 is about 10–20 seconds.
Figure 1. Valsalva maneuver in a healthy subject and in severe sympathetic failure.
A typical 4-phase blood pressure (BP) profile evoked by Valsalva maneuver in a healthy subject (A, B). Local BP minimum during phase 2 separates the early phase from the late phase. Note absence of BP recovery during the late phase 2 in a subject with severe sympathetic failure (C, D). Clear border separating the early phase from the late phase 2 is missing in C and D. MBP = mean BP.
The fall in BP during phase 2 (figure e-1) is arrested early in healthy controls, resulting in the lowest BP at about 7 seconds after the onset of phase 2. This local minimum separates early phase from late phase 2. In more advanced SF, the BP fall is arrested later, effectively shifting the local minimum in BP toward late phase 2. Typically in severe SF, the local minimum in BP is shifted to the end of phase 2. Then there is no visible BP change that would help to separate the early from the late phase 2 as there is a progressive fall of BP without recovery. In our laboratory, location of minimal BP in time during phase 2 is obtained from diastolic BP.
Calculation of SIs.
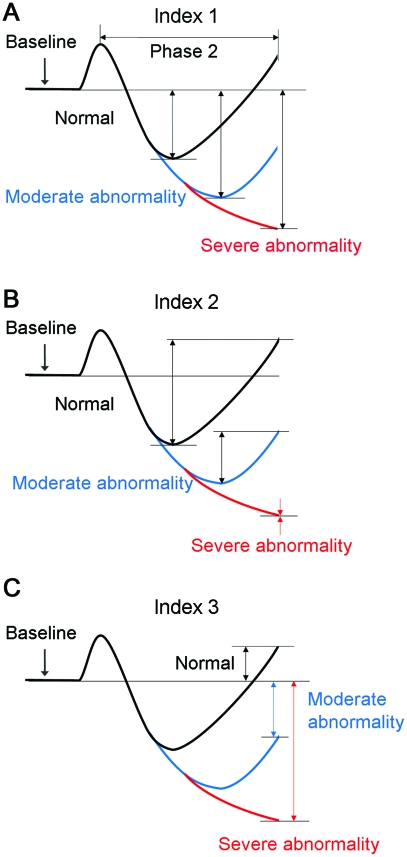
Table e-1 shows definitions of each method used to calculated SI. Indexes 1-3 (I1-3) utilizing phase 2 changes are also explained in figure 2. I1 and I3 converge in severe SF, but they differ in mild and moderate SF. I3 has a much greater dynamic range than does either I1 or I2. Systolic, mean, and diastolic BP, absolute values and percentage changes, were used in I1-4. Pressure recovery time (PRT, I5)10 and baroreflex sensitivity index, adrenergic (BRSa, I6)15 were calculated from systolic values only.
Figure 2. Schematic of calculation of the sympathetic indexes 1–3.
Indexes 1–3 are calculated from phase 2 of Valsalva maneuver. Note that indexes 1 (A) and 3 (C) merge in the case of severe sympathetic failure.
Statistical analyses.
One-way analysis of variance (ANOVA) was used to test overall differences between subject groups. The post hoc Tukey test was used for pairwise comparison if ANOVA showed overall significance. Pearson correlations were calculated between the systolic BP fall during the tilt and SIs (I1-I6). The significance level was set to p < 0.05. All statistical analysis was done using JMP 8.0 (SAS Institute, Inc., Cary, NC). Assuming the difference between the means equal to 20% and the average SD equal to 40%, than total sample size equal to 60 (that is, 15 subjects per group) is needed to obtain a power of 0.9 at significance level 0.05.
RESULTS
There were no differences in age, gender, or body mass index (BMI) among all groups. There was no correlation between subjects' age, gender, or BMI and fall in BP during the tilt. PRT and BRSa (since BRSa calculation requires PRT) could not be obtained in 12 subjects either because phase 3 remained above the baseline during VM or because BP never returned to the baseline during phase 4.
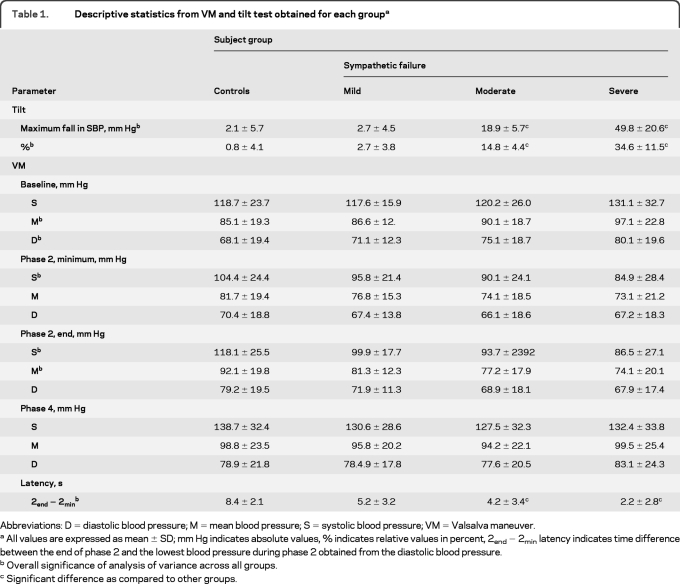
Descriptive statistics are shown in table 1. ANOVA showed overall difference in systolic BP drop during the tilt test. The post hoc analysis showed reduction of BP in the moderate and the severe SF groups. During VM, there was difference in baseline BP, minimal systolic BP during phase 2, systolic and mean BP at the end of phase 2. None of the post hoc comparisons showed difference between groups. The latency of the diastolic BP minimum during phase 2 (calculated from the end of phase 2, table 1) was not only overall different, but the latency was also shorter comparing the severe with the moderate SF groups.
Table 1.
Descriptive statistics from VM and tilt test obtained for each groupa
Abbreviations: D = diastolic blood pressure; M = mean blood pressure; S = systolic blood pressure; VM = Valsalva maneuver.
All values are expressed as mean ± SD; mm Hg indicates absolute values, % indicates relative values in percent, 2end − 2min latency indicates time difference between the end of phase 2 and the lowest blood pressure during phase 2 obtained from the diastolic blood pressure.
Overall significance of analysis of variance across all groups.
Significant difference as compared to other groups.
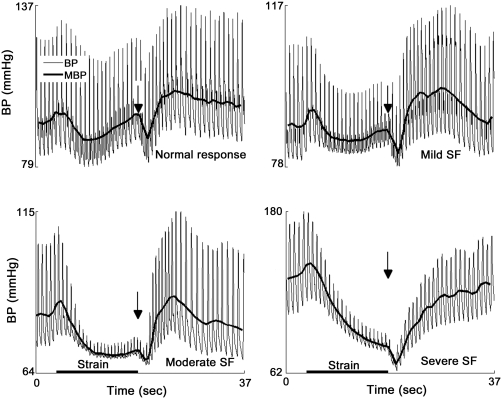
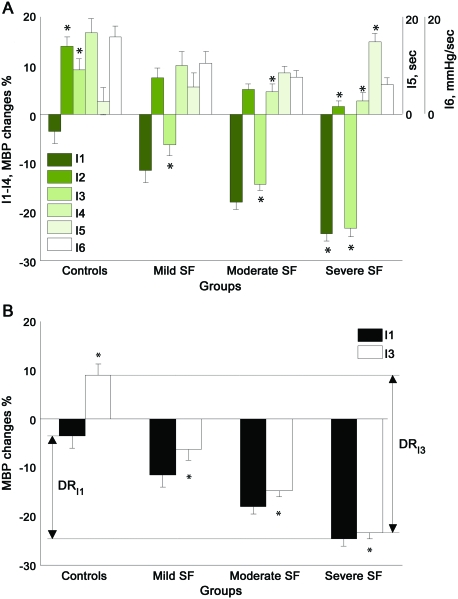
All indexes showed overall differences among tested groups. I1 and I5 (PRT) segregated only the severe SF group using the systolic and mean BP but not diastolic BP. I2, I4, and I6 (BRSa) were unable to segregate neighboring groups (controls from mild SF, mild SF from moderate SF, or moderate SF from severe SF). Only I3 segregated all groups from each other using both mean and diastolic BP and using both absolute values in mm Hg and relative values in percentages. The systolic BP using the I3 segregated only severe SF from moderate SF. Figure 3 shows a representative example from each group. Figure 4 shows comparison of I1–I4. I3, the best performer, has the greatest dynamic range (32.4 mm Hg, figure 4B), which was much higher than that of I1 (21.2 mm Hg).
Figure 3. Representative examples of Valsalva maneuver in graded sympathetic failure (SF).
MBP = mean blood pressure.
Figure 4. Performance of sympathetic indexes.
Comparison of sympathetic indexes I1–I6 (A). Comparison of dynamic ranges of indexes I3 and I1 (B). Dynamic range of I3 (DRI3) exceeds the dynamic range of I1 (DRI1). All values are expressed as mean ± standard error. MBP = mean blood pressure; SF = sympathetic failure.
Overall (using maximal BP drop anywhere during the tilt test) correlation analysis between BP fall during the tilt test and the I1-6 showed mild to moderate correlations (table e-2). The degree of correlation was decreased in the order of I3 > I1 > I2 > I5 > I4 > I6. The highest correlations were in the severe SF group, the lowest in the control group. Latency of the minimal BP during phase 2 correlated with the systolic BP fall during the tilt test. When correlation calculations were obtained for every minute of the tilt, the highest correlation was with the first minute of the tilt (table e-2).
DISCUSSION
This study directly compared several SIs obtained from VM in patients with graded SF. I3, which measures the difference between the baseline BP and the BP at the end of phase 2, had clear advantages over the other indexes, being the only index that separated all SF groups from each other. At the same time, I3 had the highest correlation with OH, a proxy for SF. Perhaps the main reasons why this index performed the best are that it represents the sympathetic vasoconstrictor responses due to the preceding drop in BP and at the same time has the highest dynamic range. I2, which theoretically reflects the “pure” vasoconstrictor response, could not differentiate between studied groups. The suboptimal performance of I2 is due to its low dynamic range. Although I1 segregated both moderate and severe SF, it was not sensitive enough to distinguish between the control and mild SF group or between the mild and moderate SF groups. With I1, the stimulus (BP fall) and the responses (BP recovery) are blended, and hence this method most likely reflects more complex mechanisms. For example, the initial drop in BP at the beginning of phase 2 depends on conditions other than sympathetic activity, such as volume status–venous capacitance, that could contribute to the limited performance of I1.
Methods focusing on the duration of BP changes evoked by VM were less sensitive than I3 in differentiating between studied groups. PRT (I5) separated the moderate from the severe SF group, but was unable to separate the other groups from each other. BRSa was even less sensitive, failing to differentiate between any groups. Without normalization, i.e., division by PRT, the BRSa is essentially a combined I1 with I2 method. The addition of normalization to the BRSa lessened its ability to differentiate between the study groups, thus suggesting that loss of BRSa sensitivity is due to PRT. PRT reflects changes of BP during phase 4 and phase 4 is under more complex influences. In addition to sympathetic vasoconstrictor activation, phase 4 also reflects cardiovagal and cardiac sympathetic functions.3 Surprisingly, simple latency of minimal BP during phase 2 either outperformed or matched all indexes except I3.
The I3 method correlated with the BP fall during the tilt test. The highest correlation was within the first minute of the tilt whereas the correlation later during the tilt was reduced. This observation is consistent with the time profile of sympathetic activation. In general, sympathetic-mediated responses occur within 5–15 seconds after the stimulus. The initial response to tilt (within the first 30 seconds) is biphasic and results in an initial fall in BP and then recovery due to generalized sympathetic-mediated peripheral vasoconstriction.16 Then increased correlation between VM and initial tilt responses indicates that both responses reflect sympathetic-mediated vasoconstriction. At the same time, VM does not provide the same information as the whole tilt test since the correlation between VM and tilt is reduced toward the end of the tilt. Therefore VM cannot replace the tilt test in detection of sympathetic impairment but both tests complement each other.
The I3 method segregated all SF groups using median and diastolic BP but not when using systolic BP. This finding may be related to the fact that diastolic BP (and median BP since it is more weighted by diastolic than by systolic BP) reflects primary the peripheral resistance as indicated by its association with the muscle sympathetic activity17 while systolic BP is under more complex influences that include sympathetic drive and cardiac output.
This study has several limitations. First, this is a retrospective study where the SIs were applied to selected patients and might not be applicable for other patients. However, all indexes were calculated using the same data covering a wide spectrum of SF. Second, sympathetic functions were not measured directly. Instead, the degree of SF was primarily graded according to the degree of OH. Neurogenic OH is a commonly accepted proxy of sympathetic dysfunction providing that there are no non-neurogenic causes of OH such as hypovolemia/dehydration, systemic infection, or cardiac dysfunction.18 None of the non-neurogenic causes of OH were observed in this study, suggesting that the VM-induced BP changes indeed reflected sympathetic functions. Furthermore, it would be impractical to measure invasively the sympathetic activity directly in such a large sample, especially in patients with severe autonomic failure.
An inherent limitation of VM is that a substantial number of patients had to be excluded from analysis. Common reasons for exclusion are inability to perform VM or use of medications that interfere with the BP response to VM. Frequently, it is unsafe to discontinue such medication before the testing. However, the most common reason for exclusion was frequent occurrence of a square wave response (SWR) or partial SWR that precludes calculations of SI. The SWR variant of VM can be indicative of congestive heart failure19 or be a normal variant.13 There are no established criteria for differentiation between partial SWR and abnormal VM due to SF. The partial SWR can mimic normal VM responses, and can result in normal-like VM-derived responses in patients with sympathetic failure. In this study, the SWR determination was made on a case-by-case basis.
The I3 is the optimal method for calculation of SI since it tracks the full spectrum of SF from mild to severe and it easily differentiates between healthy controls and those with SF.
Supplementary Material
ACKNOWLEDGMENT
The author thanks Dr. Lan Qin, Shane Stanek, Donald Chin, and Lina Garcia for their help in data collection.
Supplemental data at www.neurology.org
- ANOVA
- analysis of variance
- BMI
- body mass index
- BP
- blood pressure
- BRSa
- baroreflex sensitivity index, adrenergic
- OH
- orthostatic hypotension
- PRT
- pressure recovery time
- QSART
- quantitative sudomotor axon reflex test
- SF
- sympathetic failure
- SI
- sympathetic index
- SWR
- square wave response
- VM
- Valsalva maneuver.
DISCLOSURE
Dr. Novak receives research support from the NIH, Teva Pharmaceutical Industries Ltd., Chelsea Therapeutics, The Langer Family Charitable Foundation, Chirag Foundation Investment Trust, and Baker's MSA fund.
REFERENCES
- 1. Low PA. Composite autonomic scoring scale for laboratory quantification of generalized autonomic failure. Mayo Clin Proc 1993;68:748–752 [DOI] [PubMed] [Google Scholar]
- 2. Korner PI, Tonkin AM, Uther JB. Reflex and mechanical circulatory effects of graded Valsalva maneuvers in normal man. J Appl Physiol 1976;40:434–440 [DOI] [PubMed] [Google Scholar]
- 3. Sandroni P, Benarroch E, Low P. Pharmacological dissection of components of the Valsalva maneuver in adrenergic failure. J Appl Physiol 1991;71:1563–1567 [DOI] [PubMed] [Google Scholar]
- 4. Smith ML, Beightol LA, Fritsch-Yelle JM, et al. Valsalva's maneuver revisited: a quantitative method yielding insights into human autonomic control. Am J Physiol 1996;271:H1240–H1249 [DOI] [PubMed] [Google Scholar]
- 5. Hilz MJ, Dütsch M. Quantitative studies of autonomic function. Muscle Nerve 2006;33:6–20 [DOI] [PubMed] [Google Scholar]
- 6. Rudas L, Crossman AA, Morillo CA, et al. Sympathetic and vagal baroreflex responses to sequential nitroprusside and phenylephrine. Am J Physiol 1999;276:H1691–H1698 [DOI] [PubMed] [Google Scholar]
- 7. Eckberg DL, Rea RF, Andersson OK, et al. Baroreflex modulation of sympathetic activity and sympathetic neurotransmitters in humans. Acta Physiol Scand 1988;133:221–231 [DOI] [PubMed] [Google Scholar]
- 8. Ewing DJ. Which battery of cardiovascular autonomic function tests? Diabetologia 1990;33:180–181 [DOI] [PubMed] [Google Scholar]
- 9. Kirchheim HR. Systemic arterial baroreceptor reflexes. Physiol Rev 1976;56:100–177 [DOI] [PubMed] [Google Scholar]
- 10. Vogel ER, Sandroni P, Low PA. Blood pressure recovery from Valsalva maneuver in patients with autonomic failure. Neurology 2005;65:1533–1537 [DOI] [PubMed] [Google Scholar]
- 11. Sachs C, Berglund B, Kaijser L. Autonomic cardiovascular responses in parkinsonism: effect of levodopa with dopa-decarboxylase inhibition. Acta Neurol Scand 1985;71:37–42 [DOI] [PubMed] [Google Scholar]
- 12. Goldstein DS, Eldadah BA, Holmes C, et al. Neurocirculatory abnormalities in Parkinson disease with orthostatic hypotension: independence from levodopa treatment. Hypertension 2005;46:1333–1339 [DOI] [PubMed] [Google Scholar]
- 13. Low PA. Laboratory evaluation of autonomic failure. In: Low PA, ed. Clinical Autonomic Disorders. Philadelphia: Kluwer-Lippincott; 2008 [Google Scholar]
- 14. Hamilton WF, Woodbury RA, Harper HT., Jr Physiologic relationships between intrathoracic, intraspinal and arterial pressures. JAMA 1936;107:853–856 [Google Scholar]
- 15. Schrezenmaier C, Singer W, Swift NM, et al. Adrenergic and vagal baroreflex sensitivity in autonomic failure. Arch Neurol 2007;64:381–386 [DOI] [PubMed] [Google Scholar]
- 16. Rickards C, Newman D. A comparative assessment of two techniques for investigating initial cardiovascular reflexes under acute orthostatic stress. Eur J Appl Physiol 2003;90:449–457 [DOI] [PubMed] [Google Scholar]
- 17. Sundlöf G, Wallin BG. Human muscle nerve sympathetic activity at rest. Relationship to blood pressure and age J Physiol 1978;274:621–637 [DOI] [PMC free article] [PubMed] [Google Scholar]
- 18. Goldstein DS, Tack C. Non-invasive detection of sympathetic neurocirculatory failure. Clin Autonom Res 2000;10:285–291 [DOI] [PubMed] [Google Scholar]
- 19. Zema MJ, Restivo B, Sos T. Left ventricular dysfunction: bedside Valsalva manoeuvre. Br Heart J 1980;44:560–569 [DOI] [PMC free article] [PubMed] [Google Scholar]
Associated Data
This section collects any data citations, data availability statements, or supplementary materials included in this article.


