Abstract
A new technique for polymer microchannel surface modification, called in-channel atom-transfer radical polymerization, has been developed and applied in the surface derivatization of thermoset polyester (TPE) microdevices with poly(ethylene glycol) (PEG). X-ray photoelectron spectroscopy, electroosmotic flow (EOF), and contact angle measurements indicate that PEG has been grafted on the TPE surface. Moreover, PEG-modified microchannels have much lower and more pH-stable EOF, more hydrophilic surfaces and reduced nonspecific protein adsorption. Capillary electrophoresis separation of amino acid and peptide mixtures in these PEG-modified TPE microchips had good reproducibility. Phosducin-like protein and phosphorylated phosducin-like protein were also separated to measure the phosphorylation efficiency. Our results indicate that PEG-grafted TPE microchips have broad potential application in biomolecular analysis.
Introduction
Polymeric materials have become a common choice in the field of microfluidics [1], with an increasing number of microdevices being fabricated using polymers instead of glass [2, 3], as in earlier research. In addition to the general advantages of microfluidic devices for chemical analyses – reduced sample consumption, potential for integration of various operations, fast analysis times, multiplexing for high throughput, and portability – polymer microchips can reduce costs, making disposable devices more practical. Also, the polymers available for use offer a variety of inherent material properties to choose from (e.g., reversible sealing, resistance to selected solvents, etc.), and the associated fabrication techniques tend to be more flexible, in terms of making multilayer fluidic designs, and limiting the need for highly specialized equipment.
Common hard polymers used for the fabrication of microfluidic devices – including poly(methyl methacrylate) (PMMA) [4, 5], poly(carbonate) [6], cyclic olefin copolymer [7] and poly(ethylene terephthalate) [1] – are fabricated via the plastic machining techniques of embossing, injection molding, or laser ablation. The popular poly(dimethylsiloxane) (PDMS) [8, 9], a silicone elastomer that is microfabricated via replica molding, has been used widely in microfluidics research due to the speed and ease with which new fluidic designs can be created and then formed into devices, as well as the capability of fabricating complex three-dimensional assemblies and multilayer channel networks [10–12].
While the use of PDMS remains popular for certain applications, some undesirable characteristics, such as surface instability [9] and incompatibility with most nonpolar solvents [13], have established a need for analogous materials that address these issues. One such polymer is thermoset polyester (TPE), which has been introduced previously for the fabrication of microfluidic devices [14, 15]. Importantly, TPE microchips combine the benefits of rapid and easy fabrication along with several desirable characteristics in common with glass. Indeed, TPE can be shaped by a replica molding process similar to PDMS, allowing for rapid prototyping of fluidic designs, but TPE also exhibits surface stability and solvent resistance similar to glass. Also of note, TPE is not elastomeric like PDMS; it is a rigid material.
For bioanalysis applications, the surfaces of materials, whether glass or polymeric, are often modified to increase separation efficiency and reproducibility, since biological molecules often interact with surfaces, causing sample loss and peak broadening. Surface modification in both capillary electrophoresis (CE) and microchip CE is common, and a variety of techniques are available, including dynamic surface coating [16] and many forms of chemical modification [17, 18]. Atom-transfer radical polymerization (ATRP) [19–21] has been used for chemical derivatization of PDMS [22, 23] and PMMA [5] microchannels. ATRP modification of plastics involves activation of the surface via plasma oxidation, immobilization of the initiator, and subsequent grafting of the chosen polymer to the surface. In ATRP, the length of polymer tethered to the surface can be controlled readily. ATRP has been used to attach various polymers, including polyacrylamide [24], hydroxypropyl cellulose [25], methacrylate [26], poly(ethylene glycol) (PEG) [5], and peptidoglycans [27]. Typically, neutral polymers are used to eliminate the possibility of electrostatic interactions with analytes. PEG-modified PMMA devices have shown increased separation performance relative to unmodified microchips [5], so we were interested in applying this surface derivatization approach on different polymers.
Here we present a new approach for in-channel ATRP grafting of a thin film of PEG on the surface of TPE microchannels. These modified TPE microdevices showed reduced nonspecific analyte adsorption, and lower and more pH-stable electroosmotic flow (EOF). We have tested these PEG-grafted TPE microchips in CE analysis of amino acids and peptides. We have further demonstrated their utility in probing the phosphorylation efficiency for a model protein.
Experimental Section
Materials
2-Bromoisobutyryl bromide (98%), poly(ethylene glycol) methyl ether methacrylate (PEGMEMA, MW ~475), 2,2′-dipyridyl (99+%), copper(I) chloride (98+%), and copper(II) bromide (99%) were purchased from Aldrich (Milwaukee, WI) and used without further purification. Heptane, tetrahydrofuran, absolute methanol, and pyridine (all reagent grade) were obtained from Fisher Scientific (Fair Lawn, NJ). Fluorescein isothiocyanate (FITC), aspartic acid, glycine, asparagine, Phe-Ala (FA), Phe-Gly-Gly-Phe (FGGF) and angiotensin 1 were purchased from Sigma (St. Louis, MO). Phosducin-like protein (PhLP, Mw = 33 kDa, pI = 4.7) [28, 29] and phosphorylated PhLP (p-PhLP) were gifts from Dr. Craig Thulin in the Department of Chemistry and Biochemistry at Brigham Young University. Deionized water was from an EasyPURE UV/UF purification system (Barnstead, Dubuque, IA), and the buffer solution for CE experiments was 10 mM Trizma hydrochloride (Tris) at pH 8.7, which was filtered using 0.2-μm syringe filters (Pall Gelman Laboratory, Ann Arbor, MI).
Microfluidic Device Fabrication
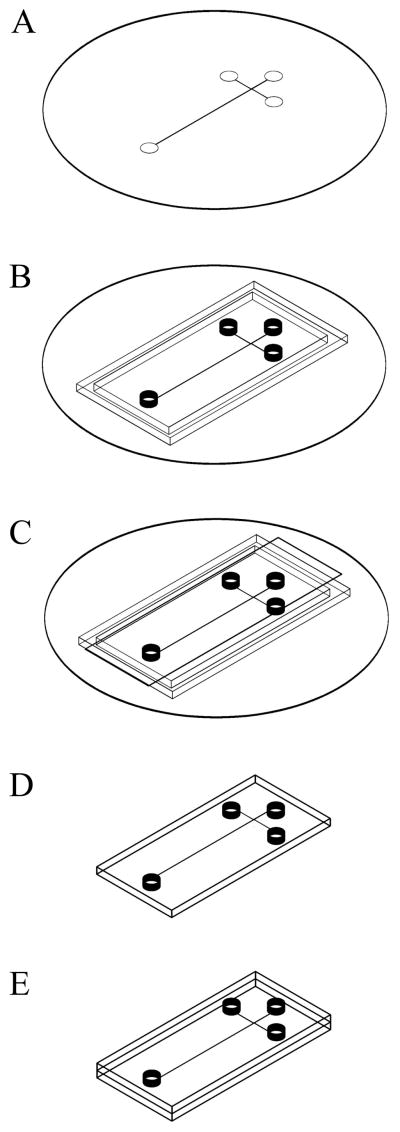
Figure 1 is a schematic of the TPE microdevice fabrication procedure. TPE microchips were constructed similarly to the protocol described previously [15], with a modified pretreatment of the masters. SU-8 patterned silicon masters were prepared using photolithography as described elsewhere [1]. In short, SU-8 50 (Microchem, Newton, MA) negative photoresist was spin-coated onto 3-in. silicon wafers (Montco Silicon Technologies, Royersford, PA) to a thickness of 50 μm. A phototransparency with a printed design of a double-T microchannel with a pattern width of 50 μm was used as the lithography mask. Following exposure, the wafers were baked and developed with propylene glycol methyl ether acetate (Sigma-Aldrich, Milwaukee, WI), yielding a SU-8 patterned silicon master (Figure 1A). Instead of sputter coating the master with SnO2 as before [1], in this work the SU-8 patterned silicon masters were treated by reaction with hexamethyldisilazane (HMDS, Sigma-Aldrich) prior to replica molding with TPE; masters and a minimal amount of HMDS were placed in a loosely covered container in a 60 °C oven overnight. The microchannels were designed to be 50 μm wide by ~50 μm tall, and the offset spacing of the injection arms was 50 μm. Each arm of the double-T section was 0.5 cm long, and the separation channel was 3 cm long. Circular areas for reservoirs were 5 mm in diameter (Figure 1).
Figure 1.
Schematic showing the procedure used for the fabrication of TPE microfluidic devices. (A) A SU-8 patterned silicon master is treated with HMDS vapor. (B) A PDMS mold surround and posts are placed on the master. (C) TPE resin containing UV photoinitiator and catalyst is poured into the master assembly; transparency film is used on the top. (D) Following exposure to UV radiation, the semicured TPE replicas are removed from the master, and (E) brought into contact. Additional UV exposure and heat are used to completely cure the TPE chip.
TPE was prepared by mixing the resin (Polylite 32030-10, Reichhold, Research Triangle, NC) with additional cross-linker (styrene, Sigma-Aldrich), UV photoinitiator (2,2-dimethoxyphenylacetophenone, Irgacure 651, Sigma-Aldrich), and methyl ethyl ketone peroxide (MEKP) catalyst (Crompton, Greenwich, CT). Approximately 0.10 g of the photoinitiator was dissolved in 0.25 g of styrene monomer and then added to 10 g of resin. Three drops of MEKP catalyst (~0.09 g) were added to the resin/styrene mixture, which was stirred and degassed to remove air bubbles. After degassing, the TPE mix was poured onto the patterned master. Cylindrical PDMS (Sylgard 184, Dow Corning, Midland, MI) posts were placed on the master to define access holes. In addition, a piece of PDMS was cut to form a mold surround, which was conformally sealed to the master to contain the resin in desired region (Figure 1B). A piece of transparency film (3M), cut to an appropriate size, was used as a top cover over the resin to ensure a flat surface (Figure 1C).
The cast TPE resin was exposed to radiation using a custom-built UV exposure box, which contained two long-wave UV bulbs with peak intensity at 365 nm (TLK 40W/10R, Philips). Samples were placed ~15 cm from the sources. TPE pieces (one patterned and one flat) were exposed for 3 min and peeled away from the masters (Figure 1D). The patterned substrate was brought into contact with the flat piece to form an enclosed chip (Figure 1E), which was then exposed to UV light for an additional 2 min, using four periods of 30-s exposures with 1.5-min intervals between exposures. Following UV curing, the TPE pieces were heated to 60 °C for 30 min and 120 °C for 1.5 h, before finally cooling to room temperature.
Immobilization of Initiator
The method of in-channel ATRP used here (Figure 2) is similar to our previously reported work [5]. A typical ATRP initiator, 2-bromoisobutyryl bromide, was immobilized on the channel surfaces of the TPE microdevice under a water-free environment. The immobilization solution was prepared by dissolving 2-bromoisobutyryl bromide (5 mM) and pyridine (5.5 mM) in a heptane/THF solution. Then the solution was pumped through the TPE microchannels at 2 μL/min using a syringe pump. After 6 h, heptane was rinsed through the microchannels to cease the initiator immobilization reaction. Lastly, vacuum was applied to dry the microchannels.
Figure 2.
Scheme for in-channel ATRP surface modification.
In-channel Grafting of PEG on TPE surfaces
The preparation of the PEG grafting solution and the assembly of the syringe and TPE microdevice were carried out in a glove box. First, CuCl (0.0424 g), CuBr2 (0.0287 g), 2,2′-dipyridyl (0.174 g), 4 mL of PEGMEMA, and 6 mL of DI water were mixed in the glove box for 15 min. 1 mL of this solution was transferred to a new container, and 9 mL of DI water was added to make the final diluted grafting solution. The syringe was filled with diluted grafting solution, and the fittings and TPE microdevice were assembled in the glove box and taken out. The grafting solution was pumped through the TPE microchannels at 2 μL/min for 6 h to accomplish ATRP grafting, and then DI water was used to flush the microchannels.
X-ray Photoelectron Spectroscopy (XPS) and Contact Angle Measurements
A SSX-100 X-ray photoelectron spectrometer (Service Physics, Bend, OR) with a monochromatic Al Kα source and a hemispherical analyzer was used to investigate the TPE surfaces before and after ATRP modification. The investigations were carried out similar to our previous work [15]. For the contact angle measurements, a NRL-100 goniometer (Ramé-Hart, Mountain Lakes, NJ) was used after 4 μL of DI water was placed on the surface with a syringe.
EOF Measurements
The EOF measurements in TPE microdevices were done as we have reported previously [5], using the current monitoring method [30]. The EOF rates in TPE microdevices were measured at five different pH values. The buffers (all 30 mM) included 4-morpholineethanesulfonic acid (pH 6), N-[Tris(hydroxymethyl)methyl]-2-aminoethanesulfonic acid (pH 7), Tris (pH 8), phosphate buffered saline (pH 9) and 3-(cyclohexylamino)-1-propane sulfonic acid (pH 10); the ionic strength of these buffers was adjusted to 30 mM with NaCl. For a typical EOF measurement, the TPE microchannels were rinsed with DI water thoroughly, followed by buffer. Before measurement, one reservoir was emptied, and a lower concentration (1.5 mM) of the same buffer was introduced to that reservoir. The high voltage used in EOF measurement was provided by a PS-350 high voltage supply unit (Stanford Research Systems, Sunnyvale, CA). The channel current signal was transferred to a computer through a PCI-1200 data acquisition board (National Instruments, Austin, TX), and was recorded using LabView 8i (National Instruments).
FITC Labeling of Amino Acids, Peptides and Proteins
The protocols for labeling amino acids, peptides and proteins with FITC were adapted from our previous work [5, 31, 32]. Briefly, each analyte was dissolved individually in filtered 10 mM carbonate buffer (pH 9.2). FITC was dissolved in absolute dimethyl sulfoxide to make a 6 mM solution. For amino acids, 600 μL of each 3 mM amino acid solution was mixed thoroughly with 200 μL of 6 mM FITC solution. For peptides, 50 μL of 6 mM FITC solution was added to 200 μL of a 2 mM solution of each individual peptide. The FITC labeling reaction was run for at least 24 h in the dark at room temperature; longer reaction times (up to 5 days) led to more complete labeling and elimination of the unreacted FITC peak.
For FITC labeling of PhLP and p-PhLP, the proteins were desalted and concentrated individually using Microsep 3K Omega centrifuge tubes (Pall, East Hills, NY), which have a molecular weight cutoff of 3000. The solution in the upper chamber of the tube was diluted with carbonate buffer (pH 9.2) to make a ~2 mg/mL protein solution. An appropriate volume of 6 mM FITC solution was added to this protein solution to make a 5:2 molar ratio of FITC to protein. The reaction time was the same as for FITC labeling of amino acids and peptides.
Protein Adsorption Tests
To study the protein adsorption in both untreated and PEG-grafted TPE channels, we flushed FITC-labeled bovine serum albumin (BSA) through TPE microdevices at 2 μL/min [5]. After 30 min, 20 mM Tris buffer was used to wash out unbound protein for 1 h at 10 μL/min. Then, the microchip was placed on the microscope stage, and a ~400-μm-diameter region of the channel was illuminated with 488 nm laser light. Fluorescence images were recorded with a Nikon Coolpix digital camera and analyzed using Digital V++ software (Digital Optics Limited, Auckland, New Zealand) as in earlier work [33].
Separation and Detection of Amino Acids, Peptides and Proteins
Our microchip CE and laser-induced fluorescence detection methods have been described previously [5, 32]. For these experiments, the injection voltage was 0.8 kV, the separation voltage was 2.0 kV, and the data sampling frequency was 100 Hz.
Results and Discussion
Surface Modification
The cross-linkage bonding of TPE devices is one of the advantages of this fabrication method. However, our previous ATRP procedures for unbonded PMMA surfaces [5] would interfere with the cross-linking process. Thus, we developed an in-channel ATRP modification approach. The ATRP process is typically carried in still (i.e., not flowing) solution, particularly for PEG grafting, which could cause problems for microchannel surface modification [22, 34]. We hypothesized that if the reaction solution was flushed through microchannels at a sufficiently slow flow rate, the reaction conditions would be close enough to “still” to allow ATRP functionalization. The method we report here, in-channel ATRP, uses slow flow of low-concentration reactant to carry out ATRP reactions inside the TPE channels. Importantly, since in-channel ATRP is done after the TPE microdevices have been bonded together, it does not interfere with device fabrication.
In the ATRP grafting of PMMA microdevices, the first step is plasma activation to form surface hydroxyl groups [5]. We expected TPE to have sufficient surface hydroxyl groups that we could omit the plasma oxidation step. Indeed, we obtained similar results with ATRP reactions on both plasma-activated and native TPE surfaces, so we skipped the plasma oxidation procedure in subsequent experiments. The second step for in-channel ATRP is the immobilization of initiator (2-bromoisobutyryl bromide) on the TPE channel surface. In this work, we used heptane/THF (v/v 4:1) as the solvent, since this mixture does not dissolve or swell TPE at room temperature. It was critical to optimize the concentrations of 2-bromoisobutyryl bromide and pyridine, because we found under some conditions that this reaction produced precipitates that could block the channels. The best results were obtained with 5 mM 2-bromoisobutyryl bromide and 5.5 mM pyridine in a heptane/THF solution. This mixture provided a uniform layer of initiator grafted on the TPE surface without blocking the channels. We also adjusted the PEG grafting solution composition and settled on a mixture that contained ten-fold lower PEG and catalyst concentrations compared to our earlier PMMA studies [5].
XPS and Contact Angle Measurements
XPS was used to determine the elemental composition of the TPE surfaces before and after modification, and the results are shown in Table 1. The XPS data indicate that the native TPE surface was composed of 75% carbon and 25% oxygen. After in-channel ATRP, the elemental composition changed to 69% carbon and 31% oxygen, reflecting increased oxygen content due to PEG grafting. To obtain more detailed information about the elemental composition of the TPE surface, we took high-resolution scans of the C1s binding energy, in a similar manner to prior studies [15]. After in-channel ATRP, the hydrocarbon (C-H) surface content decreased from 61% to 29%, the ester/acid (carboxyl) surface content decreased from 15% to 5%, and the ether/alcohol (C-O) surface content greatly increased from 24% to 66%.
Table 1.
XPS investigation of in-channel ATRP surface modification of TPE.
| Intact TPE surface | TPE surface after plasma treatment | TPE surface after ATRP | |
|---|---|---|---|
| C (%) | 75 | 67 | 69 |
| -carboxyl (%) | 15 | 23 | 5 |
| -C-O (%) | 24 | 27 | 66 |
| -C-H, C-C (%) | 61 | 51 | 29 |
| O (%) | 25 | 33 | 31 |
Water contact angles for both PEG-grafted and native TPE were obtained. The contact angle for the PEG-grafted TPE surface was 43°, while native TPE had a contact angle of 61°. Both results agree well with previous reports of the contact angles of PEG-grafted PMMA [5] and native TPE [15]. The change in the contact angle before and after surface modification indicates that the chemistry and hydrophilicity of the TPE surface were altered through ATRP treatment, which is also consistent with the XPS investigation.
EOF Measurements
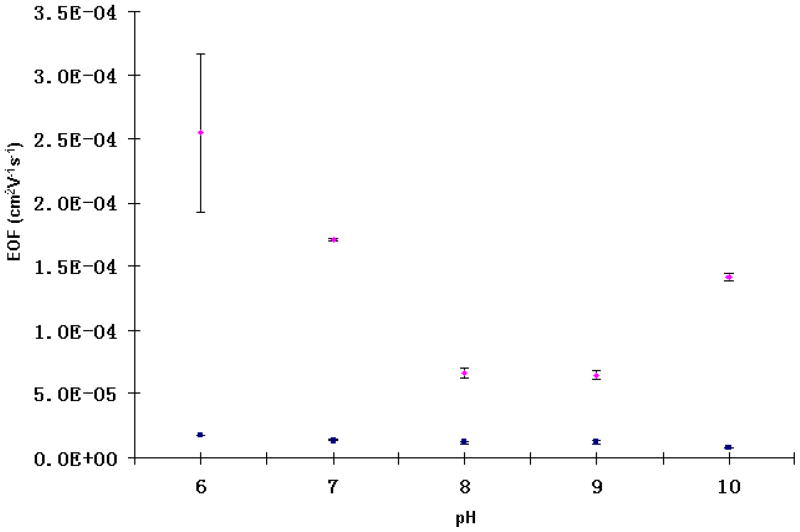
In PEG-grafted TPE microchips, the EOF goes from anode to cathode, which is similar to what we observed in untreated TPE devices. Figure 3 shows the EOF measurements in both PEG-grafted and untreated TPE microchannels at different pH values. Compared to the pH-variant EOF in untreated TPE microchannels, PEG-grafted TPE has very stable EOF (~1.0×10⁻⁵ cm2s−1V−1) in a wide pH range (6 – 10), which should help in high-performance biomolecule analysis. Also, the EOF values in PEG-grafted TPE channels are 5–10 times lower than the corresponding measurements in untreated ones.
Figure 3.
EOF measurements in untreated TPE microchannels (diamonds) and in-channel PEG-grafted TPE microchannels (squares). Each data point is the mean of three replicate measurements, and the errors bars depict the standard deviation.
Protein Adsorption Studies
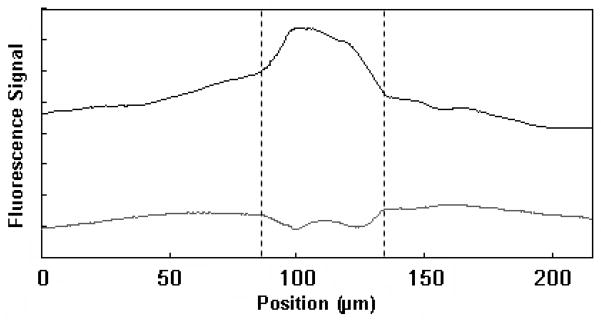
Although polymer microdevices are easy to fabricate and relatively cheap, they are not inherently the best choice for some bioanalytical applications. In untreated TPE devices, protein adsorption and unstable EOF are two major barriers that would limit the use of these microdevices. However, after ATRP modification, the PEG-grafted TPE surface is expected to have reduced protein adsorption compared to untreated devices. To test this, we carried out BSA adsorption experiments, as shown in Figure 4. We noticed much greater BSA adsorption on the untreated TPE channel surfaces, compared to PEG-grafted TPE channels, indicating that the ATRP process significantly reduces protein adsorption to the surface.
Figure 4.
FITC-BSA adsorption tests on TPE chips before (upper, offset) and after (lower) in-channel ATRP PEG grafting. The dashed lines define the channel borders. Scatter from channel walls and some non-uniformity in the source intensity over the illuminated area account for the minor background variations in the traces.
Electrophoresis of Amino Acids, Peptides and Proteins
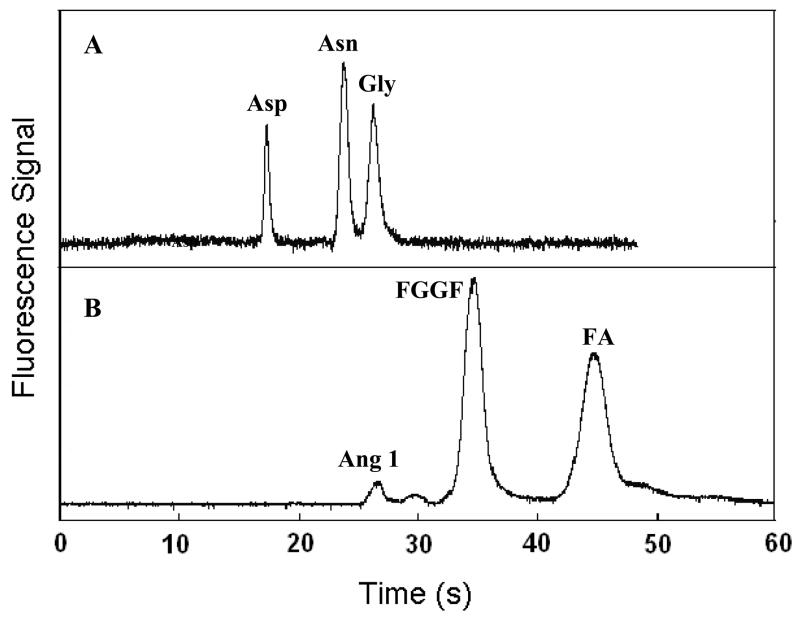
Figure 5 shows our CE results for the separation of amino acid and peptide mixtures. Both the amino acid and peptide mixtures were well resolved using PEG-grafted TPE microdevices. The glycine peak in Figure 5A was used to evaluate the CE performance of TPE microdevices, and 4.5 × 10³ plates for a 3.0-cm-long separation channel were obtained. Moreover, the relative standard deviation for the glycine migration time over 4 runs was 2.1%. In addition to amino acid analysis, PEG-grafted TPE microdevices offer good performance in peptide separation. The total theoretical plates for the FGGF peak in Figure 5B were 1.2 × 10³, and the relative standard deviation for the FGGF migration time in 4 runs was 4.4%. The theoretical plates for amino acid separations in PEG-grafted TPE microdevices are similar to those in native TPE [15], PMMA [32] and oxidized PDMS [9] in the absence of buffer additives. Plate counts are lower than those obtained in glass microchips [35], but the glass microfabrication process is less widely accessible, more expensive, and more involved. The PEG-grafted TPE microdevices provide ~5-fold faster amino acid separations than those in unmodified TPE [15] or oxidized PDMS [9], due to the lower EOF. The fluorescence background in TPE in these separations is about 2–3 times higher than in PMMA, but this should only have a small impact on the limit of detection. PEG-grafted TPE microchips displayed little change in CE performance over >50 runs, indicating good coating stability. These results indicate that in-channel ATRP is a robust surface modification method for TPE microdevices, leading to reduced EOF (relative to native TPE) and reproducible separations.
Figure 5.
Microchip CE separation of FITC-tagged (A) amino acids and (B) peptides. The concentrations of the amino acids and peptides were 50 μM.
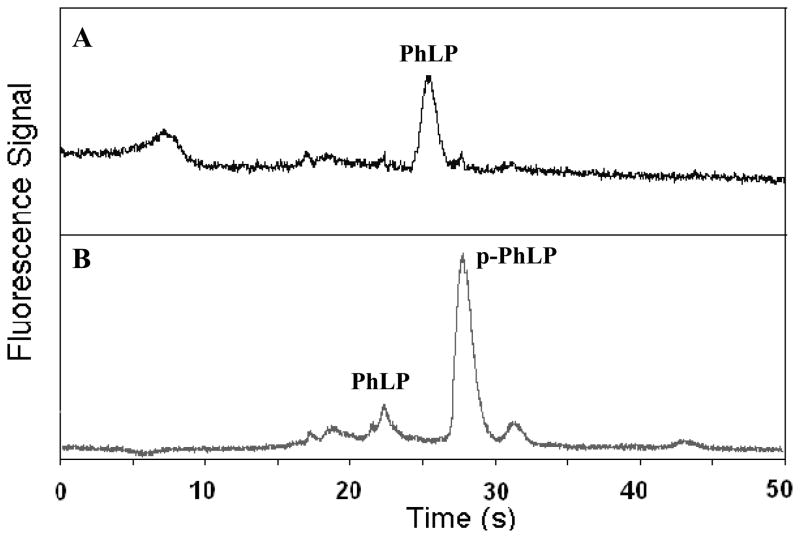
To evaluate a biological application of PEG-grafted TPE microdevices, we developed a simple experiment to test the phosphorylation efficiency of PhLP. A widely expressed ethanol-responsive gene, PhLP is a homologue of phosducin, a known major regulator of Gβγ signaling in the retina and pineal gland; however, as yet, the function of the PhLP remains unclear [36]. PhLP directly binds Gβγ in vitro, and phosphorylation of PhLP is important to its function, but the mechanism of phosphorylation is not yet known. In Chinese hamster ovary cells, the concentration of PhLP is ~0.15 μM, but after angiotensin II treatment, the PhLP concentration can exceed 1 μM [37]. We have performed microchip CE of PhLP and p-PhLP mixtures, as shown in Figure 6. From these results, we see that the phosphorylation efficiency is high, but a small PhLP peak is still seen in the CE analysis of the PhLP phosphorylation mixture (Figure 6B). This result has also been verified by conventional gel electrophoresis of PhLP proteins (data not shown). The time variation between the two PhLP peaks in Figure 6A–B is due to small differences in the detection position selected during each CE experiment. The relative standard deviations of migration times were 6.6% over 3 runs for PhLP and 4.1% over 4 runs for p-PhLP. Importantly, our results indicate that PEG-grafted TPE microdevices are suitable for reproducible protein analysis work, something that cannot be done in unmodified or uncoated TPE, glass, PDMS or PMMA microchips.
Figure 6.
Microchip CE of (A) PhLP and (B) p-PhLP. Proteins concentrations were ~1 μM.
Conclusion
In-channel ATRP has been developed and applied in the surface modification of TPE microdevices. XPS and contact angle measurements confirm the grafting of PEG to the TPE surface. Significantly reduced EOF and nonspecific protein adsorption were observed in PEG-grafted TPE microchannels. Rapid CE separations of amino acids, peptides and proteins have been obtained, indicating that PEG-grafted TPE microdevices should be broadly applicable in biomolecular analysis.
Acknowledgments
The work was funded in part by the National Institutes of Health (GM064547 and EB006124 -Woolley and GM065293 - Chiu) and the National Science Foundation (0135109 - Chiu). We acknowledge Dr. Gerald Watt for the use of a nitrogen glovebox and Dr. Matthew Linford for the use of a goniometer. We are grateful to Li Yang for the XPS analysis of TPE samples. We also thank Dr. Craig Thulin and Zhaoyuan Chen for the PhLP samples and helpful discussions of PhLP phosphorylation.
References
- 1.Fiorini GS, Chiu DT. BioTechniques. 2005;38:429–446. doi: 10.2144/05383RV02. [DOI] [PubMed] [Google Scholar]
- 2.Manz A, Harrison DJ, Verpoorte EMJ, Fettinger JC, et al. J Chromatogr. 1992;593:253–258. [Google Scholar]
- 3.Harrison DJ, Manz A, Fan Z, Lüdi H, Widmer HM. Anal Chem. 1992;64:1926–1932. [Google Scholar]
- 4.Henry AC, Tutt TJ, Galloway M, Davidson YY, et al. Anal Chem. 2000;72:5331–5337. doi: 10.1021/ac000685l. [DOI] [PubMed] [Google Scholar]
- 5.Liu J, Pan T, Woolley AT, Lee ML. Anal Chem. 2004;76:6948–6955. doi: 10.1021/ac040094l. [DOI] [PubMed] [Google Scholar]
- 6.Liu Y, Ganser D, Schneider A, Liu R, et al. Anal Chem. 2001;73:4196–4201. doi: 10.1021/ac010343v. [DOI] [PubMed] [Google Scholar]
- 7.Li C, Yang Y, Craighead HG, Lee KH. Electrophoresis. 2005;26:1800–1806. doi: 10.1002/elps.200410309. [DOI] [PubMed] [Google Scholar]
- 8.Effenhauser CS, Bruin GJM, Paulus A, Ehrat M. Anal Chem. 1997;69:3451–3457. doi: 10.1021/ac9703919. [DOI] [PubMed] [Google Scholar]
- 9.Duffy DC, McDonald JC, Schueller OJA, Whitesides GM. Anal Chem. 1998;70:4974–4984. doi: 10.1021/ac980656z. [DOI] [PubMed] [Google Scholar]
- 10.Unger MA, Chou HP, Thorsen T, Scherer A, Quake SR. Science. 2000;288:113–116. doi: 10.1126/science.288.5463.113. [DOI] [PubMed] [Google Scholar]
- 11.Thorsen T, Maerkl SJ, Quake SR. Science. 2002;298:580–584. doi: 10.1126/science.1076996. [DOI] [PubMed] [Google Scholar]
- 12.Anderson JR, Chiu DT, Jackman RJ, Cherniavskaya O, et al. Anal Chem. 2000;72:3158–3164. doi: 10.1021/ac9912294. [DOI] [PubMed] [Google Scholar]
- 13.Lee JN, Park C, Whitesides GM. Anal Chem. 2003;75:6544–6554. doi: 10.1021/ac0346712. [DOI] [PubMed] [Google Scholar]
- 14.Fiorini GS, Jeffries GDM, Lim DSW, Kuyper CL, Chiu DT. Lab Chip. 2003;3:158–163. doi: 10.1039/b305074m. [DOI] [PubMed] [Google Scholar]
- 15.Fiorini GS, Lorenz RM, Kuo JS, Chiu DT. Anal Chem. 2004;76:4697–4704. doi: 10.1021/ac0498922. [DOI] [PubMed] [Google Scholar]
- 16.Liu Y, Fanguy JC, Bledsoe JM, Henry CS. Anal Chem. 2000;72:5939–5944. doi: 10.1021/ac000932l. [DOI] [PubMed] [Google Scholar]
- 17.Doherty EAS, Meagher RJ, Albarghouthi MN, Barron AE. Electrophoresis. 2003;24:34–54. doi: 10.1002/elps.200390029. [DOI] [PubMed] [Google Scholar]
- 18.Dolník V. Electrophoresis. 2004;25:3589–3601. doi: 10.1002/elps.200406113. [DOI] [PubMed] [Google Scholar]
- 19.Wang JS, Matyjaszewski K. J Am Chem Soc. 1995;117:5614–5615. [Google Scholar]
- 20.Kato M, Kamigaito M, Sawamoto M, Higashimura T. Macromolecules. 1995;28:1721–1723. [Google Scholar]
- 21.Kamigaito M, Ando T, Sawamoto M. Chem Rev. 2001;101:3689–3745. doi: 10.1021/cr9901182. [DOI] [PubMed] [Google Scholar]
- 22.Xiao D, Zhang H, Wirth M. Langmuir. 2002;18:9971–9976. [Google Scholar]
- 23.Xiao D, Le TV, Wirth MJ. Anal Chem. 2004;76:2055–2061. doi: 10.1021/ac035254s. [DOI] [PubMed] [Google Scholar]
- 24.Smith EA, Coym JW, Cowell SM, Tokimoto T, et al. Langmuir. 2005;21:9644–9650. doi: 10.1021/la051116h. [DOI] [PMC free article] [PubMed] [Google Scholar]
- 25.Shen D, Yu H, Huang Y. Celluose. 2006;13:235–244. [Google Scholar]
- 26.Zhai G, Shi ZL, Kang ET, Neoh KG. Macromol Biosci. 2005;5:974–982. doi: 10.1002/mabi.200500079. [DOI] [PubMed] [Google Scholar]
- 27.Velter I, Ferla BL, Nicotra F. J Carbohydrate Chem. 2006;25:97–138. [Google Scholar]
- 28.Lazarov ME, Martin MM, Willardson BM, Elton TS. Biochim Biophys Acta. 1999;1446:253–264. doi: 10.1016/s0167-4781(99)00098-6. [DOI] [PubMed] [Google Scholar]
- 29.Carter MD, Southwick K, Lukov G, Willardson BM, Thulin CD. J Biomol Tech. 2004;15:257–264. [PMC free article] [PubMed] [Google Scholar]
- 30.Huang X, Gordon MJ, Zare RN. Anal Chem. 1988;60:1837–1838. [Google Scholar]
- 31.Kelly RT, Pan T, Woolley AT. Anal Chem. 2005;77:3536–3541. doi: 10.1021/ac0501083. [DOI] [PubMed] [Google Scholar]
- 32.Kelly RT, Woolley AT. Anal Chem. 2003;75:1941–1945. doi: 10.1021/ac0262964. [DOI] [PubMed] [Google Scholar]
- 33.Kelly RT, Li Y, Woolley AT. Anal Chem. 2006;78:2565–2570. doi: 10.1021/ac0521394. [DOI] [PubMed] [Google Scholar]
- 34.Matyjaszewski K, Xia J. Chem Rev. 2001;101:2921–2990. doi: 10.1021/cr940534g. [DOI] [PubMed] [Google Scholar]
- 35.Harrison DJ, Fluri K, Seiler K, Fan Z, et al. Science. 1993;261:895–897. doi: 10.1126/science.261.5123.895. [DOI] [PubMed] [Google Scholar]
- 36.Thibault C, Sganga MW, Miles MF. J Biol Chem. 1997;272:12253–12256. doi: 10.1074/jbc.272.19.12253. [DOI] [PubMed] [Google Scholar]
- 37.McLaughlin JN, Thulin CD, Hart SJ, Resing KA, et al. Proc Natl Acad Sci USA. 2002;99:7962–7967. doi: 10.1073/pnas.112075699. [DOI] [PMC free article] [PubMed] [Google Scholar]


