

Abstract
Background
Telerehabilitation allows rehabilitative training to continue remotely after discharge from acute care and can include complex tasks known to create rich conditions for neural change.
Objectives
The purposes of this study were: (1) to explore the feasibility of using telerehabilitation to improve ankle dorsiflexion during the swing phase of gait in people with stroke and (2) to compare complex versus simple movements of the ankle in promoting behavioral change and brain reorganization.
Design
This study was a pilot randomized controlled trial.
Setting
Training was done in the participant's home. Testing was done in separate research labs involving functional magnetic resonance imaging (fMRI) and multi-camera gait analysis.
Patients
Sixteen participants with chronic stroke and impaired ankle dorsiflexion were assigned randomly to receive 4 weeks of telerehabilitation of the paretic ankle.
Intervention
Participants received either computerized complex movement training (track group) or simple movement training (move group).
Measurements
Behavioral changes were measured with the 10-m walk test and gait analysis using a motion capture system. Brain reorganization was measured with ankle tracking during fMRI.
Results
Dorsiflexion during gait was significantly larger in the track group compared with the move group. For fMRI, although the volume, percent volume, and intensity of cortical activation failed to show significant changes, the frequency count of the number of participants showing an increase versus a decrease in these values from pretest to posttest measurements was significantly different between the 2 groups, with the track group decreasing and the move group increasing.
Limitations
Limitations of this study were that no follow-up test was conducted and that a small sample size was used.
Conclusions
The results suggest that telerehabilitation, emphasizing complex task training with the paretic limb, is feasible and can be effective in promoting further dorsiflexion in people with chronic stroke.
Amid an increasingly difficult health care economy, hospital lengths of stay for people with stroke have declined,1,2 which affects the intensity of their rehabilitation. This scenario compels clinicians and scientists to be creative in finding ways to promote better quality of life for these individuals, which, in terms of walking, would include safety, speed, and energy expenditure. As communication technology has advanced, a new method of rehabilitation is emerging that may allow rehabilitative training to continue remotely following discharge from acute care. This method is called telerehabilitation,3 defined here as therapy from a distance directed by a computer and telecommunication. A variety of studies exploring telerehabilitation in people with stroke have shown value for improving upper-limb function,3–8 and lower-limb function.9–11 None of these studies has explored whether telerehabilitation can improve the range of ankle dorsiflexion (DF) during the swing phase of gait, which is commonly impaired after stroke12 and can lead to increased tripping potential13 and energy expenditure.14 Thus, the first objective of this study was to explore the feasibility of using telerehabilitation to improve ankle DF during the swing phase of gait in people with stroke.
This study also explored an important topic related to the structuring of the telerehabilitation sessions (ie, complex versus simple movement training). Research suggests that complex task training has advantages over simple task training. In rodents, Kleim et al15 showed that rats undergoing repetitive movement training on a complex reaching task demonstrated greater functional and structural plasticity of relevant cortical regions compared with animals undergoing training on a simple reaching task. In primates, 2 combined studies16,17 have shown that repetitive training on a complex manual task produced functional reorganization of cortical maps, whereas repetitive training on a simple manual task did not. In humans who were healthy, Pascual-Leone et al18 showed that repetitive training on a complex piano task demonstrated greater motor learning and changes in cortical excitability than repetitive training on a simple piano task. Accordingly, our second objective was to compare the effects of movement complexity in 2 telerehabilitation training strategies: (1) repetitive, complex movements (tracking) of the ankle, requiring temporospatial processing to achieve accuracy, versus (2) repetitive simple movements of the ankle, requiring no attention to accuracy. We hypothesized that complex movements would yield greater improvements in ankle DF during gait than simple movements and that a different pattern of brain reorganization would emerge between the 2 training forms.
Method
Design Overview
This study was a pilot randomized controlled clinical trial comparing 2 treatment strategies: complex movement training and simple movement training.
Setting and Participants
Nineteen participants were assigned randomly to either a track group or a move group. Sixteen participants, 8 in each group, completed the study (Fig. 1). Inclusion criteria included poststroke duration of at least 5 months, at least 10 degrees of active dorsiflexion/plantar flexion (DF/PF) at the paretic ankle, ability to understand the tasks, and ability to ambulate 30 m. Exclusion criteria included indwelling devices incompatible with magnetic resonance imaging and currently receiving therapy. The Table summarizes the demographics of each group. All participants signed a statement of informed consent.
Figure 1.

Flow chart showing the number of participants at each stage of the study. MRI=magnetic resonance imaging.
Table.
Participant Characteristics by Groupa

Foot preference was defined by the Modified Lateral Preference Inventory.49 MMSE=Mini-Mental State Examination,50 M=male, F=female, R=right, L=left, NP=no preference, Q1=first quarter, Q3=third quarter. *=significant between-group difference (P=.026). **=significant between-group difference (P=.039).
Participant Orientation to Telerehabilitation
Before enrollment, a randomization listing of the 2 interventions was generated electronically. As participants enrolled in the study, they were assigned to the next intervention on the randomized list: track group or move group. This assignment occurred at the end of the pretest visit. Next, the investigator responsible for training modified the laptop computer (Dell VOSTRO 1,000, Round Rock, Texas) with the customized training software so that the proper program (track versus move) would be started automatically after pressing the power button. Then, the participant and a family member were oriented in how to set up the computer/camera and apply the customized electrogoniometer with an attached potentiometer (ETI Systems Inc, Carlsbad, California) to the paretic ankle. Several training trials then were observed to ensure that the participant could follow the procedures before being dismissed to repeat the setup at home. Figure 2 (left panel) shows the home setup for a participant in the track group.
Figure 2.

Left panel: Training at home for a participant in the track group. The training system consisted of a laptop computer (A) (in this instance, showing 1:17 min/s into a participant-selected pause from tracking), an ankle electrogoniometer brace (B), a web camera (C), a single-button control box (in participant's hands, not shown), and a wireless modem (D). Right panel: Telecommunication setup at therapist's location. The therapist could see the participant's tracking performance in one window. Simultaneously in another window, with the participant's camera directed on the ankle, the therapist also could see the actual ankle movement. With the therapist's camera directed on the therapist, the participant could see the therapist. Audio was transmitted in both directions.
Training: Track Group
After pressing the power button on the computer, the participant then followed prompts to record the active DF/PF range, which was used to set the amplitudes for the tracking waveforms. The electrogoniometer captured the movements of DF/PF only; inversion/eversion movements were not investigated in this initial study.
The program involved 60 training blocks per day, with 3 trials per block, for 20 days for a total of 3,600 trials. This dosage of training doubled the amount in our earlier telerehabilitation study.4 Participants selected their own daily schedule, but the program limited the participant to no more than the 180 trials per day to capitalize on offline consolidation processes occurring with sleep and the passage of time.19 To continually challenge participants, the 60 training blocks per day were randomly ordered from a host set of 100 blocks. Blocks varied across multiple parameters. Target waveforms included square, left sawtooth, right sawtooth, triangle, and sine. Frequencies were 0.2, 0.25, 0.6, and 1 Hz. Trial durations were 5, 10, 15, and 20 seconds. Thus, the number of movement cycles (repetitions) of DF/PF in a trial varied according to the waveform frequency and duration. For example, a 0.6-Hz waveform during a 10-second trial would generate 6 DF/PF movement repetitions. The PF amplitude (lower peaks) was set at 0%, 15%, 30%, 50%, or 85% of full range (0%=full PF) and the DF amplitude (upper peaks) was set at 50%, 70%, 85%, 100%, 110%, 120%, or 125% of full range (100%=full DF). The conditions of 110%, 120%, and 125% were included to promote further DF range. Because “attention” to the joint being trained has been shown to be important in stimulating brain reorganization,20 the training required that participants pay close attention to the task and occasionally problem-solve spatial conflict blocks. These blocks included a stimulus-response (S-R) noncompatibility condition in which upward DF movement produced downward cursor movement on the computer screen. Such noncompatibile spatial processing has been shown to be a potent factor influencing cortical excitability in primates.21 Stimulus-response noncompatibility blocks (interspersed randomly) comprised 15% of the total of 1,200 training blocks. Each participant's training position, prompted by the computer screen, varied between sitting (60% of training blocks) with the knee flexed or extended or standing (40% of training blocks) on the paretic or nonparetic leg.
During a trial, the cursor swept automatically from left to right across the screen at a constant rate while the participant adjusted the vertical position of the cursor to track the target as accurately as possible with DF/PF movements. At the end of a trial, a pause occurred for a time equal to the duration of the preceding trial.
Knowledge of results (KR)22 was provided at the end of each trial for the track group, with a computer-calculated score modified from the accuracy index (AI) described earlier.23 This modification was done so that participants would not experience any negative scores in describing their performance. Although Anderson et al24 found better retention of motor skill in participants who were healthy with a less frequent schedule of KR, we could not be certain that a reduced or faded feedback schedule would apply similarly for people with stroke. Thus, we chose to give KR after every trial because preliminary field testing on people with stroke indicated that they enjoyed competing with themselves for higher scores, and we believed this competition would help to keep our participants motivated as they trained independently at home.
Teleconferencing between the participant and the therapist occurred to reinforce human interaction and the therapeutic relationship (Fig. 2, right panel). A remote desktop application (LogMeIn) and a video conferencing application (Skype, Skype Ltd, Luxembourg, Belgium) were used for the communication, along with webcams (Logitech Webcam C905). The Internet connection was made using a cellular modem (USB720, Verizon Wireless, Verizon, New York, New York) communicating with a cellular phone network (Verizon). The therapist contacted the participant 2 times per week. In addition, the participant's computer automatically e-mailed daily performance records to the laboratory computer, allowing the therapist to monitor compliance.
Training: Move Group
The move group followed the same setup procedures. As much as possible, the dosing of the training was matched between groups. That is, both groups completed the same number of training blocks, training position within each block, number of trials per block, duration per trial, and number of telecommunication sessions. The main difference in conditions between groups was that the track group saw the command “track” on their computer screen along with the target waveform and their tracking response, whereas the move group saw only the command “move” with no target, no response line and no KR at the end of each trial. The move group was instructed at orientation to produce repetitive DF/PF movements through their full range at a comfortable, self-selected frequency. Although the participants could not see their movement record, investigators could see and confirm the movement through the performance files that the participant's computer automatically e-mailed to our laboratory regularly and through the telecommunication sessions.
We did not control for movement amplitude or frequency (ie, number of DF/PF movements per trial) in the move group, as we did for the track group, to eliminate the cognitive processing associated with producing complex movements, which formed the basis of our second objective. However, we did estimate the frequency in each group across all trials through an algorithm that analyzed the data after they were collected and counted the mean number of cursor band-crossings. For the track group, the band was the middle third of the ankle motion required to track each target. For the move group, it was the middle third of their full ankle motion. Then, for each trial, the algorithm counted the times that the cursor crossed the full band (ie, either the minimum band value followed by the maximum band value or vice versa). The algorithm also calculated the mean peak-to-peak DF/PF amplitude within each training trial. We deemed this analysis to be important to rule out amplitude and frequency of movement as possible confounders, as described further in the “Discussion” section.
Outcome Measures
As this was a pilot study exploring the feasibility of using telerehabilitation in stroke, our measurement points occurred at pretest and posttest. We did not include a follow-up test. The testers were blinded as to the treatment group for each participant.
Gait assessment.
Quantitative gait kinematic parameters were measured using surface markers and an 8-camera motion capture system (Vicon Inc, Los Angeles, California). A modified Helen Hayes marker arrangement was captured by the 4 megapixel cameras and analyzed using the dynamic Plug-in-Gait model for kinematic results. Lower-extremity retroreflective markers were affixed using the Helen Hayes convention25 and International Society of Biomechanics joint coordinate system descriptions.26 Participants were instructed to ambulate at their self-selected speed without wearing an ankle-foot orthosis (AFO). The 3-dimensional (3D) marker data were sampled at 120 Hz, smoothed with a forward/backward fourth-order low-pass Butterworth filter, and used to reconstruct limb segment motion and joint angle kinematics. Ten full gait cycles with complete data were analyzed with ensemble averaging for each pretest and posttest.
We analyzed ankle DF/PF angle, toe clearance, gait temporal symmetry ratio (GTSR), and stride length. These metrics have been shown to be critical for both predicting the risk of falls27,28 and the improvement of energy expenditure in patients with stroke.29–32 Maximum DF and PF were the peak and trough points of ankle angle during the swing phase, and toe clearance was defined as the minimum vertical displacement of the great toe during the swing phase.27 The GTSR, defined below, quantified the ratio of time spent in each phase of gait for each limb, with a value of 1.0 representing healthy symmetric gait.29
 |
Ten-meter walk tests.
Participants performed 2 trials of a 10-m walk at their self-selected (“comfortable”) speed and then 2 trials at maximum speed. If participants normally used a cane and AFO, they were allowed to use the cane, but not their AFO.
fMRI.
Functional magnetic resonance imaging (fMRI) occurred inside a 3-Tesla magnet (Magnetom Trio, Siemens, Munich, Germany). The task for both groups consisted of alternating phases of rest and paretic ankle DF/PF tracking. Electrogoniometers were attached to the paretic ankle to perform the tracking and to the nonparetic ankle to monitor for mirror movements. Data from participants who showed mirror movements or head movements greater than 3 mm were not included in the fMRI analysis. The possibility of mirror muscle activations below the threshold for producing movement is a limitation.
The functional task during fMRI consisted of seven 1-minute phases alternating between rest (4 phases) and track (3 phases) conditions. For all phases, the computer displayed a random sine wave target (0.4 Hz) along with the corresponding prompt, “Rest” or “Track,” at the bottom of the screen. The lower (PF) peaks were set at 15% of the participant's predetermined ankle active range of motion, with the participant's full DF defined as 100%. The upper (DF) peaks were set at 85%. For each track phase, the cursor swept from left to right across the screen and the participant attempted to track the target as accurately as possible with careful DF/PF movements. For each rest phase, the participant watched the cursor sweep across the screen but executed no ankle movements. Two 10-second practice trials occurred inside the magnet. Tracking accuracy was quantified with an AI.23 The maximum score is 100%.
Anatomical and functional images were acquired using a whole-body 3-Tesla magnet (Magnetom Trio, Siemens) equipped with a standard 12-channel head coil. A high-resolution (1-mm3), longitudinal relaxation time (T1)-weighted, 3D anatomical image data set (3D FLASH, repetition time [TR]=20 milliseconds, flip angle [FA]=30°, total acquisition time=5:00 minutes) was acquired over the entire brain to identify appropriate landmarks and serve as a template upon which functional images would be overlaid. Functional images were obtained while the participant performed the tracking test described above and consisted of T2*-weighted functional magnetic resonance images of the blood oxygen level–dependent (BOLD) signal with a slice thickness of 3 mm, which were obtained in the transverse plane using a gradient echo planar imaging sequence (echo time [TE]=30 milliseconds, TR=3,000 milliseconds, FA=80°, field of view=192 × 192 mm with a matrix size of 64 × 64 leading to a resolution of 3 × 3 × 3 mm). The total imaged volume extended from the superior pole of the cortex to a depth of 108 mm in 36 interleaved slices. A block fMRI design was used whereby 145 magnetic resonance scans were acquired, for a total scan time of 7:15 minutes, which covered the time for all the alternating rest/track phases.
Brain Voyager (Brain Innovation BV, Maastricht, the Netherlands) software was used for fMRI data preprocessing and analysis. Functional images were preprocessed to correct for head motion artifacts, differences in slice scan time acquisition, and temporal linear trends. The 3D functional volume was aligned with the corresponding 3D anatomical volume, and both were normalized to standard Talairach space.33
For each participant, regions of interest (ROIs) were drawn manually on anatomical images in each hemisphere for the primary motor area (M1), primary somatosensory area (S1), premotor cortex (PMC), and supplementary motor area (SMA) according to specified landmarks34 (Fig. 3). We used a general linear model (GLM) with 7 predictors to record the active voxel count (volume) and the average BOLD signal intensity, calculated as the average t statistic of the difference between the paretic ankle tracking and rest conditions for each participant in specified ROIs. One predictor was the track condition. Three predictors accounted for translational movement of the head in sagittal, coronal, and transverse planes, and the remaining 3 predictors accounted for rotational movement in the same 3 planes. These last 6 predictors were entered as covariates in the model and served to exclude the effect of any movement artifact in the variability of BOLD signal. The GLM analysis created an activation map showing active voxels with significantly different signal intensity between paretic ankle tracking and rest using a false discovery rate (FDR) of q (FDR)<0.01.35
Figure 3.

Regions of interest in sagittal, coronal, and transverse images of one participant's brain with left hemisphere stroke. A=anterior, P=posterior, R=right, L=left.
For each ROI, the number (volume) of active voxels, percentage of total ROI voxels (% volume), and average signal intensity of active voxels was recorded. Also, the volume and intensity were compared between hemispheres for each ROI by using the laterality index (LI)36 calculated as:
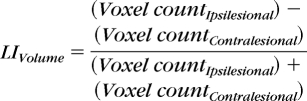 |
 |
Data Analysis
For data sets that were normally distributed (ie, AI), we used paired t tests to evaluate within-group differences from pretest to posttest and 2-sample t tests for between-group differences. For data sets that were not normally distributed (ie, DF, toe clearance, GTSR, stride length, 10-m walk speed, and fMRI variables), we used Wilcoxon signed rank tests to evaluate within-group differences and Wilcoxon rank sum tests for between-group differences. We also were interested in the number of participants (ie, frequency count) showing an increase or a decrease in each fMRI variable from pretest to posttest. We analyzed for a difference in these frequency counts between groups using the Fisher exact test. No adjustments to the significance level were made for the multiple comparisons because of small sample size. Accordingly, significant results should be considered with caution for possible spurious effects stemming from multiple comparisons. Beyond analyzing the testing data, we also analyzed all participants' training data to compute the mean number of movement repetitions per training trial and the mean peak-to-peak amplitude of movement. The alpha level was set at P<.05 (2-tailed). All analyses were conducted using SAS statistical software (version 9.2, 2008, SAS Institute, Cary, North Carolina).
Role of the Funding Source
This project was funded by the following National Institutes of Health grants: R03HD051615, P41 RR008079, and M01-RR00400. No US federal agencies provided funding for this study. The funding source had no involvement in the design, conduct, or reporting of information.
Results
Behavioral Outcomes
The data for the dependent measures below (except AI) were not normally distributed. Thus, we used the median (50th percentile) to describe the central tendency and the 1st quartile (Q1 or 25th percentile) and 3rd quartile (Q3 or 75th percentile) to describe the variability of the distribution. The primary outcome measure (ie, the paretic ankle DF during the swing phase of gait) showed a significant within-group increase in the median (Q1, Q3) from pretest at 6.75 (4.84, 8.99) degrees to posttest at 12.86 (8.20, 14.15) degrees for the track group (P=.008) and a trend toward an increase from pretest at 6.61 (5.80, 10.31) degrees to posttest at 8.99 (5.61, 10.95) degrees in the move group (P=.055) (Fig. 4A). Furthermore, whereas the between-group difference in DF at pretest was nonsignificant, the between-group difference in change in DF from pretest to posttest was significant (P=.017), favoring the track group, Toe clearance exhibited a trend toward a median increase in the track group (P=.055), whereas the move group showed no change (Fig. 4B). Also important, the average variance of toe clearance in the track group decreased from 0.48 mm at pretest to 0.29 mm at posttest (P=.014), whereas in the move group it decreased from 0.47 to 0.34 mm (P=.082). Median GTSR showed a significant decrease toward 1.0 in both the track (P=.008) and move (P=.008) groups (Fig. 4C), indicating improved symmetry between the paretic and nonparetic limbs. Median stride length increased significantly in both the track (P=.008) and move (P=.016) groups (Fig. 4D). Except for DF, as noted above, there were no statistically significant between-group differences.
Figure 4.

Median (first quartile, third quartile, minimum, maximum) values of gait variables: (A) dorsiflexion, (B) toe clearance, (C) gait temporal symmetry ratio (GTSR), and (D) stride length.
For the 10-m walk at comfortable speed, in the track group, the median was 0.91 (0.53, 1.00) m/s at pretest and 0.89 (0.71, 1.09) m/s at posttest. In the move group, it was 0.92 (0.62, 1.14) m/s at pretest, and 0.90 (0.55, 1.15) m/s at posttest. For the 10-m walk at maximum speed, in the track group the median was 1.09 (0.83, 1.26) m/s at pretest and 1.06 (0.95, 1.24) m/s at posttest. In the move group, it was 1.28 (0.74, 1.59) m/s at pretest and 1.22 (0.72, 1.52) m/s at posttest. All within- and between-group differences were nonsignificant.
The mean (SE) AI for the track group at pretest was 18.95% (7.35), increasing to 39.92% (±6.80) at posttest, and this change was significant (P=.041). The move group also improved from 34.37% (14.10) at pretest to 53.78% (7.20) at posttest. Although the magnitude of improvement was equivalent to that of the track group, the variance was higher in the move group and so this change was not significant. All of the tracking scores are considerably less than those reported by LaPointe et al37 for young men (72.0% [±2.49]) and women (73.6% [±1.54]) who were healthy using the same tracking protocol, which confirms the impaired ankle function in the current participants.
The mean (SD) number of movement repetitions per trial for the 3,600 training trials in the track group was 7.64 (1.36) compared with 11.61 (2.80) for the move group (P=.003). The peak-to-peak amplitude of DF/PF movements averaged 89.79 (0.69) degrees for the track group and 93.62 (1.25) for the move group (P=.018).
fMRI
The fMRI data for 2 participants in the track group were excluded because of excessive head motion. Also, several ROIs for some participants in both groups showed no active voxels at the specified threshold for activation, resulting in reduced sample sizes for signal intensity data of 4 to 6 for the track group and 6 to 8 for the move group. Because of the low sample sizes, only between-group analysis on median change from pretest to posttest was done on volume, percent volume, and signal intensity.
None of the ROIs showed a significant median change in these measures (eFig. 1). However, trends toward between-group differences in median change from pretest to posttest were observed for contralesional M1 volume (P=.067), contralesional M1% volume (P=.077), ipsilesional S1 intensity (P=.055), and contralesional PMC volume (P=.067). For each of these trends, the track group showed decreased values from pretest to posttest, whereas the move group showed increased values. A conspicuous pattern in the change of cortical activation from pretest to posttest between the 2 groups is shown in eFigure 1. Close inspection reveals that, for the track group, the direction of change for the median values of the fMRI variables nearly always showed decreases from pretest to posttest, whereas the move group nearly always showed increases. Of the 8 volume and the 8 percent volume measures (2 sides × 4 ROIs), all but one showed a median increase in the move group, whereas all values showed a median decrease in the track group (Fisher exact test, P=.0014). For the 8 intensity measures, 7 of 8 showed a median increase in the move group, whereas 7 of 8 showed a median decrease in the track group (Fisher exact test, P=.01). Figure 5 demonstrates these changes in the cortical activation from pretest to posttest for one participant from each group.
Figure 5.

Cortical activation at one coronal slice (Y=−30) and 3 transverse slices (Z=65, 60, and 55) for one participant in move group with right hemisphere stroke tracking with paretic left ankle and one participant in track group with left hemisphere stroke tracking with paretic right ankle. Change from pretest to posttest shows reduction in activation with greater focus to the ipsilesional hemisphere in the track group participant compared with the move group participant. R=right, L=left. FDR=false discovery rate.
Regarding laterality, the only significant between-group difference in the change from pretest to posttest was for the PMC in LI%Volume, which increased (shifted toward ipsilesional activation) in the track group and decreased (shifted toward contralesional activation) in the move group (P=.039) (eFig. 2). For LIvolume, there were no significant between-group differences; however, PMC demonstrated a trend (P=.053) toward a difference in the same direction as LI%Volume. The LIIntensity showed no significant changes or trends.
Training Adherence and Participant Feedback
Of the 19 participants who enrolled, 16 finished all the training trials, which were confirmed by data files automatically sent to the therapist daily from the participant's training computer. Three participants, 1 from the move group and 2 from the track group, dropped out of the study, citing fatigue during training as the reason. Beyond the report of fatigue in these 3 participants, there were no other adverse events.
Overall, participant feedback at the completion of the study was very favorable for telerehabilitation. The difficulty most frequently reported was donning the electrogoniometer; some participants required partial assistance from the primary caregiver, particularly at the beginning and less so toward the end. The teleconferencing connection was generally successful in allowing 2-way video and audio communication; however, for 4 participants the wireless signal was inadequate in their homes. In these cases, telephones were used for audio communication and data were retrieved from the computer's hard drive after they finished the training.
Discussion
The important findings of this study were that: (1) telerehabilitation to improve ankle dorsiflexion was feasible for people with chronic stroke, and (2) complex movement training (track group) produced greater improvement in ankle DF during the swing phase of gait than simple movement training (move group).
As described further below, we believe that the cognitive processing during the complex movement training of the track group was responsible for the greater improvement in the track group. However, potential confounders did exist. Greater cortical activation is associated with higher frequency movements38–40 and higher amplitude movements,41 but it was impossible for us to control these 2 factors in the training movements of the move group without giving them guiding feedback. They were instructed during orientation to produce repetitive DF/PF movements at a comfortable rate using their full range of motion. However, they could have self-selected a lower number of repetitions and lower amplitude of DF/PF movements within each training trial than what the training software directed for the track group. Thus, the greater improvement in DF during the swing phase of gait in the track group could have stemmed from either their cognitive processing of complex movements or greater cortical activation associated with greater repetitions and amplitude of their DF/PF movements within each training trial compared with the move group. We found that the move group produced more repetitions and amplitude of training movements per trial, indicating that the possible confounder did not materialize.
Another possible confounder was the difference in duration of stroke between groups (Table). However, as recovery potential is generally considered to be stronger early after stroke rather than later, we believe it is doubtful that the longer duration of stroke in the track group could account for their greater improvement in dorsiflexion compared with the move group.
We speculate that the larger increase in DF in the track group may stem from more focused cortical activation, involving an overall reduction in cortical activation and shifting toward the ipsilesional hemisphere.42 In our study, although the magnitude of volume, percent volume, and intensity values for the track group failed to show significant within-group decreases, the significant finding was that the direction of change for the median values of these variables showed a decrease for nearly all the ROIs for this group, compared with the increases observed for nearly all the ROIs in the move group. Thus, although the magnitude of individual fMRI changes may have been subtle, the direction of change (ie, decreased activation plus a shift toward the ipsilesional hemisphere) may be important and is consistent with other reports extolling the value of focused cortical activation.43,44 The mechanism by which cognitive processing of a complex movement task, which includes close attention to feedback and the associated internalized reward system, stimulates greater neuroplastic change above physical activity alone15–18 is uncertain, but studies suggest that the increased liberation and synaptic effects of neurotrophins during combined cognitive processing and physical activity could be important.45,46
The important criterion that defines motor learning is not improved performance on the training task but improvement on a transfer task.47 Indeed, the findings of improved dorsiflexion during gait as well as the improved ankle tracking in an altered environment (inside the MR scanner) in the track group, but not in the move group, indicate that the telerehabilitation tracking training was effective in promoting motor learning.
Our gait measurements assessed functions critical for predicting tripping potential27,28 and improvement of energy expenditure29–32 in people with stroke. Tripping potential is embedded within the ankle DF and toe clearance data, with both exhibiting improvements in the track group. Additionally, as increased toe clearance variance can predict falls in elderly adults,28 the significant decrease in variance found here in the track group suggests this group could be safer walkers. Energy expenditure is embedded within the temporal symmetry of gait, with symmetric gait patterns (ie, GTSRs approaching 1.0) being more energy efficient.30 Decreases in GTSR toward 1.0 were observed for both the track and move groups, suggesting decreased energy expenditure after engaging in both forms of training.
We did not observe improved walking speed, which is contrary to the findings of Mirelman and colleagues.10,11 They showed that improved walking speed could be accomplished in people with stroke with clinic-based virtual reality training of ankle movements in all planes. Their results suggest that for the next generation of telerehabilitation software and hardware, it may be beneficial to add tracking training in multiple ankle movement directions, rather than DF/PF only, to achieve even further gains marked by increased walking speed. Their results also invite further applications of virtual reality for the lower limb, beyond that of Holden et al5 for the upper limb, into telerehabilitation. Finally, with our low number of participants per group, our study was underpowered, and future studies would benefit from having more participants.
We believe that telerehabilitation offers a valuable method for promoting further recovery from stroke. Our earlier telerehabilitation study, which also involved track versus move groups, but using the paretic index finger,4 did not produce a clear advantage in the track group. However, the training in that study lasted only 2 weeks, compared with 4 weeks here, and so dosage of training likely is an important factor. This finding highlights a potentially important advantage of telerehabilitation. It avails extended training time so that a large number of movement repetitions, considered to be crucial for cortical reorganization,48 can occur. Because of health care economics and the declining length of inpatient rehabilitation stay,1 alternative forms of rehabilitation, including telerehabilitation, may become increasingly important to approach the dosage of training needed to promote neuroplasticity and a higher level of recovery. In this way, we do not envision telerehabilitation as a replacement for the hands-on interaction between patients and therapists so crucial for establishing trust, motivation, and guidance of therapy early on. Rather, it is envisioned as therapy at a less dependent stage in the recovery process that continues to emphasizes repetitive movements and cognitive processing, but with only periodic rather than continual therapist guidance and at a location, intensity, and schedule selected by the patients themselves. As the advancement of communication technology continues to accelerate, as the need for cost containment in health care economics continues to deepen, and as evidence continues to mount that recovery of function can occur even in the chronic stages of stroke, telerehabilitation offers hope for continued progress.
Conclusion
These results suggest that telerehabilitation emphasizing complex task training with the paretic limb can be effective in promoting brain reorganization and further recovery in people with chronic stroke. Further trials on a larger scale are needed to determine the cost, effectiveness, and the duration of retention of benefits associated with telerehabilitation.
The Bottom Line
What do we already know about this topic?
Telerehabilitation allows rehabilitation training to continue remotely after discharge from acute care and can include complex tasks that are known to create rich conditions for neural change. Research suggests that complex task training has advantages over simple task training.
What new information does this study offer?
According to this study, a telerehabilitation program that emphasizes complex task training with the paretic limb is feasible and can be effective in promoting further dorsiflexion. Improved dorsiflexion will help decrease tripping in people with chronic stroke.
If you're a patient, what might these findings mean for you?
After traditional one-on-one training, your physical therapist may provide you with a telerehabilitation program that will allow you to take more responsibility for completing designated tasks or exercises in your own home, with guidance from a computer and periodic check-in from your physical therapist.
Supplementary Material
Footnotes
Dr Durfee and Dr Carey provided concept/idea/research design. Dr Deng, Dr Durfee, Dr Skluzacek, Ms Davey, and Dr Carey provided writing. Dr Deng, Dr Durfee, Dr Nuckley, Dr Rheude, Dr Severson, Dr Skluzacek, Dr Spindler, and Dr Carey provided data collection. All authors provided data analysis. Dr Deng, Dr Durfee, and Dr Carey provided project management. Dr Deng and Dr Carey provided fund procurement and institutional liaisons. Dr Deng, Dr Durfee, Dr Nuckley, and Dr Carey provided facilities/equipment. Dr Skluzacek provided clerical support. Dr Deng, Dr Durfee, Dr Nuckley, Dr Skluzacek, and Dr Carey provided consultation (including review of manuscript before submission).
The authors acknowledge Brett Burgstahler, Dillon Hodapp, Dr Haitham Hussein, and Edison Lin for their valuable contributions to this study.
The study was approved by the University of Minnesota's Committee on the Use of Human Subjects in Research.
This project was funded by the following National Institutes of Health grants: R03HD051615, P41 RR008079, and M01-RR00400. No US federal agencies provided funding for this study.
This trial has been registered with ClinicalTrials.gov; registration number: NCT01298583.
References
- 1. Dobrez D, Heinemann AW, Deutsch A, et al. Impact of Medicare's prospective payment system for inpatient rehabilitation facilities on stroke patient outcomes. Am J Phys Med Rehabil. 2010;89:198–204 [DOI] [PubMed] [Google Scholar]
- 2. Granger CV, Markello SJ, Graham JE, et al. The uniform data system for medical rehabilitation: report of patients with stroke discharged from comprehensive medical programs in 2000–2007. Am J Phys Med Rehabil. 2009;88:961–972 [DOI] [PubMed] [Google Scholar]
- 3. Piron L, Turolla A, Agostini M, et al. Exercises for paretic upper limb after stroke: a combined virtual-reality and telemedicine approach. J Rehabil Med. 2009;41:1016–1102 [DOI] [PubMed] [Google Scholar]
- 4. Carey JR, Durfee WK, Bhatt E, et al. Comparison of finger tracking versus simple movement training via telerehabilitation to alter hand function and cortical reorganization after stroke. Neurorehabil Neural Repair. 2007;21:216–232 [DOI] [PubMed] [Google Scholar]
- 5. Holden MK, Dyar TA, Dayan-Cimadoro L. Telerehabilitation using a virtual environment improves upper extremity function in patients with stroke. IEEE Trans Neural Syst Rehabil Eng 2007;15:36–42 [DOI] [PubMed] [Google Scholar]
- 6. Huber M, Rabin B, Docan C, et al. Feasibility of modified remotely monitored in-home gaming technology for improving hand function in adolescents with cerebral palsy. IEEE Trans Inf Technol Biomed. 2010;14:526–534 [DOI] [PubMed] [Google Scholar]
- 7. Piron L, Tonin P, Trivello E, et al. Motor tele-rehabilitation in post-stroke patients. Med Informatics Internet Med. 2004;29:119–125 [DOI] [PubMed] [Google Scholar]
- 8. Piron L, Turolla A, Tonin P, et al. Satisfaction with care in post-stroke patients undergoing a telerehabilitation programme at home. J Telemed Telecare. 2008;14:257–260 [DOI] [PubMed] [Google Scholar]
- 9. Deutsch JE, Lewis JA, Burdea G. Technical and patient performance using a virtual reality-integrated telerehabilitation system: preliminary finding. IEEE Trans Neural Syst Rehabil Eng. 2007;15:30–35 [DOI] [PubMed] [Google Scholar]
- 10. Mirelman A, Bonato P, Deutsch JE. Effects of training with a robot-virtual reality system compared with a robot alone on the gait of individuals after stroke. Stroke. 2009;40:169–174 [DOI] [PubMed] [Google Scholar]
- 11. Mirelman A, Patritti BL, Bonato P, Deutsch JE. Effects of virtual reality training on gait biomechanics of individuals post-stroke. Gait Posture. 2010;31:433–437 [DOI] [PubMed] [Google Scholar]
- 12. Kesar TM, Perumal R, Jancosko A, et al. Novel patterns of functional electrical stimulation have an immediate effect on dorsiflexor muscle function during gait for people poststroke. Phys Ther. 2010;90:55–66 [DOI] [PMC free article] [PubMed] [Google Scholar]
- 13. Said CM, Goldie PA, Patla AE, Sparrow WA. Effect of stroke on step characteristics of obstacle crossing. Arch Phys Med Rehabil. 2001;82:1712–1719 [DOI] [PubMed] [Google Scholar]
- 14. Waters RL, Mulroy S. The energy expenditure of normal and pathologic gait. Gait Posture. 1999;9:207–231 [DOI] [PubMed] [Google Scholar]
- 15. Kleim JA, Barbay S, Cooper NR, et al. Motor learning-dependent synaptogenesis is localized to functionally reorganized motor cortex. Neurobiol Learn Mem. 2002;77:63–77 [DOI] [PubMed] [Google Scholar]
- 16. Nudo R, Milliken G, Jenkins W, Merzenich M. Use-dependent alterations of movement representations in primary motor cortex of adult squirrel monkeys. J Neurosci. 1996;16:785–807 [DOI] [PMC free article] [PubMed] [Google Scholar]
- 17. Plautz EJ, Milliken GW, Nudo RJ. Effects of repetitive motor training on movement representations in adult squirrel monkeys: role of use versus learning. Neurobiol Learn Mem. 2000;74:27–55 [DOI] [PubMed] [Google Scholar]
- 18. Pascual-Leone A, Nguyen KT, Cohen AD, et al. Modulation of muscle responses evoked by transcranial magnetic stimulation during the acquisition of new fine motor skills. J Neurophysiol. 1995;74:1037–1045 [DOI] [PubMed] [Google Scholar]
- 19. Doyon J, Korman M, Morin A, et al. Contribution of night and day sleep vs simple passage of time to the consolidation of motor sequence and visuomotor adaptation learning. Exp Brain Res. 2009;195:15–26 [DOI] [PMC free article] [PubMed] [Google Scholar]
- 20. Stefan K, Wycislo M, Classen J. Modulation of associative human motor cortical plasticity by attention. J Neurophysiol. 2004;92:66–72 [DOI] [PubMed] [Google Scholar]
- 21. Georgopoulos AP, Lurito JT, Petrides M, et al. Mental rotation of the neuronal population vector. Science. 1989;243:234–236 [DOI] [PubMed] [Google Scholar]
- 22. Schmidt RA, Lee TD. Motor Control and Learning: A Behavioral Emphasis. Champaign, IL: Human Kinetics Inc; 2005 [Google Scholar]
- 23. Carey JR. Manual stretch: Effect on finger movement control and force control in stroke subjects with spastic extrinsic finger flexor muscles. Arch Phys Med Rehabil. 1990;71:888–894 [PubMed] [Google Scholar]
- 24. Anderson DI, Magill RA, Sekiya H. Motor learning as a function of KR schedule and characteristics of task-intrinsic feedback. J Motor Behav. 2001;33:59. [DOI] [PubMed] [Google Scholar]
- 25. Kadaba MP, Ramakrishnan HK, Wootten ME. Measurement of lower extremity kinematics during level walking. J Orthop Res. 1990;8:383–392 [DOI] [PubMed] [Google Scholar]
- 26. Wu G, Siegler S, Allard P, et al. ; for the International Society of Biomechanics ISB recommendation on definitions of joint coordinate system of various joints for the reporting of human joint motion, part I: ankle, hip, and spine. J Biomech. 2002;35:543–548 [DOI] [PubMed] [Google Scholar]
- 27. Begg R, Best R, Dell'Oro L, Taylor S. Minimum foot clearance during walking: strategies for the minimisation of trip-related falls. Gait Posture. 2007;25:191–198 [DOI] [PubMed] [Google Scholar]
- 28. Mills PM, Barrett RS, Morrison S. Toe clearance variability during walking in young and elderly men. Gait Posture. 2008;28:101–107 [DOI] [PubMed] [Google Scholar]
- 29. Rotenberg A, Pascual-Leone A. Safety of 1 Hz repetitive transcranial magnetic stimulation (rTMS) in patients with titanium skull plates. Clin Neurophys. 2009;120:1417. [DOI] [PubMed] [Google Scholar]
- 30. Lin PY, Yang YR, Cheng SJ, Wang RY. The relation between ankle impairments and gait velocity and symmetry in people with stroke. Arch Phys Med Rehabil. 2006;87:562–568 [DOI] [PubMed] [Google Scholar]
- 31. Oken O, Yavuzer G, Ergocen S, et al. Repeatability and variation of quantitative gait data in subgroups of patients with stroke. Gait Posture. 2008;27:506–511 [DOI] [PubMed] [Google Scholar]
- 32. Patterson KK, Gage WH, Brooks D, et al. Evaluation of gait symmetry after stroke: a comparison of current methods and recommendations for standardization. Gait Posture. 2010;31:241–246 [DOI] [PubMed] [Google Scholar]
- 33. Talairach J, Tournoux P. Co-planar Stereotaxic Atlas of the Human Brain. New York, NY: Thieme Medical Publishers; 1988 [Google Scholar]
- 34. Dassonville P, Lewis SM, Zhu XH, et al. The effect of stimulus-response compatibility on cortical motor activation. Neuroimage. 2001;13:1–14 [DOI] [PubMed] [Google Scholar]
- 35. Genovese CR, Lazar NA, Nichols T. Thresholding of statistical maps in functional neuroimaging using the false discovery rate. Neuroimage. 2002;15:870–878 [DOI] [PubMed] [Google Scholar]
- 36. Cramer SC, Nelles G, Benson RR, et al. A functional MRI study of subjects recovered from hemiparetic stroke. Stroke. 1997;28:2518–2527 [DOI] [PubMed] [Google Scholar]
- 37. LaPointe KE, Klein JA, Konkol ML, et al. Cortical activation during finger tracking vs ankle tracking in healthy subjects. Restor Neurol Neurosci. 2009;27:253–264 [PubMed] [Google Scholar]
- 38. Rao SM, Bandettini PA, Binder JR, et al. Relationship between finger movement rate and functional magnetic resonance signal change in human primary motor cortex. J Cereb Blood Flow Metab. 1996;16:1250–1254 [DOI] [PubMed] [Google Scholar]
- 39. Sadato N, Ibanez V, Campbell G, et al. Frequency-dependent changes of regional cerebral blood flow during finger movements: functional MRI compared to PET. J Cereb Blood Flow Metab. 1997;17:670–679 [DOI] [PubMed] [Google Scholar]
- 40. Jenkins IH, Passingham RE, Brooks DJ. The effect of movement frequency on cerebral activation: a positron emission tomography study. J Neurol Sci. 1997;151:195–205 [DOI] [PubMed] [Google Scholar]
- 41. Waldvogel D, van Gelderen P, Ishii K, Hallett M. The effect of movement amplitude on activation in functional magnetic resonance imaging studies. J Cereb Blood Flow Metab. 1999;19:1209–1212 [DOI] [PubMed] [Google Scholar]
- 42. Feydy A, Carlier R, Roby-Brami A, et al. Longitudinal study of motor recovery after stroke: recruitment and focusing of brain activation. Stroke. 2002;33:1610–1617 [DOI] [PubMed] [Google Scholar]
- 43. Ward NS, Brown MM, Thompson AJ, Frackowiak RS. Neural correlates of motor recovery after stroke: a longitudinal fMRI study. Brain. 2003;126:2476–2496 [DOI] [PMC free article] [PubMed] [Google Scholar]
- 44. Muellbacher W, Richards C, Ziemann U, et al. Improving hand function in chronic stroke. Arch Neurol. 2002;59:1278–1282 [DOI] [PubMed] [Google Scholar]
- 45. Klintsova AY, Dickson E, Yoshida R, Greenough WT. Altered expression of BDNF and its high-affinity receptor TrkB in response to complex motor learning and moderate exercise. Brain Res. 2004;1028:92–104 [DOI] [PubMed] [Google Scholar]
- 46. Gomez-Pinilla F, So V, Kesslak JP. Spatial learning and physical activity contribute to the induction of fibroblast growth factor: neural substrates for increased cognition associated with exercise. Neuroscience. 1998;85:53–61 [DOI] [PubMed] [Google Scholar]
- 47. Schmidt RA, Lee TD. Motor Control and Learning: A Behavioral Emphasis. 3rd ed. Champaign, IL: Human Kinetics Inc; 1999 [Google Scholar]
- 48. Kimberley TJ, Samargia S, Moore LG, et al. Comparison of amounts and types of practice during rehabilitation for traumatic brain injury and stroke. J Rehabil Res Dev. 2010;47:851–862 [DOI] [PubMed] [Google Scholar]
- 49. Coren S. The lateral preference inventory for measurement of handedness, footedness, eyedness, and earedness: norms for young adults. Bull Psychonomic Soc. 1993;31:1–1 [Google Scholar]
- 50. Folstein MF, Folstein SE, McHugh PR. “Mini-mental state”: a practical method for grading the cognitive state of patients for the clinician. J Psychiatr Res. 1975;12:189–198 [DOI] [PubMed] [Google Scholar]
Associated Data
This section collects any data citations, data availability statements, or supplementary materials included in this article.