Abstract
We study the dynamics of a linear distributed line charge such as a single stranded DNA in a nanoscale, linear 2D Paul trap in vacuum. Using molecular dynamics simulations we show that a line charge can be trapped effectively in the trap within well defined range of stability parameters. We investigated (i) a flexible bounded string of charged beads, and (ii) a ssDNA polymer of variable length, for various trap parameters. A line charge undergoes oscillations or rotations as it moves depending on its initial angle, position of the center-of-mass and velocity. The stability region for a strongly bonded line of charged beads is similar to that of a single ion with the same charge over mass ratio. A single stranded DNA, as long as 40nm, does not fold or curl in the Paul trap, but could undergo rotations about the center of mass. To prevent the rotations, we show that a stretching field in the axial direction can effectively prevent the rotations and increase the confinement stability.
1. Introduction
A quadrupole Paul trap is commonly used either for trapping ions or for mass selective spectrometry. The trap appears in both linear (2D) and 3D varieties, and its dynamical confinement functions are in general characterized by a combination of a DC and an AC (rf) electric fields and rf frequency, by the trap dimensions and by mass and charge of the confined ions (Paul, 1990). The most known application of the linear Paul trap is for mass analysis of ions being a component of a quadrupole mass spectrometer. An excellent review of the functions and applications of the conventional Paul ion traps is given by Leibfried et al (Leibfried et al 2003). More recent applications of the Paul traps are for quantum information processing (Vant et al., 2006; Seidelin et al., 2006), for coherent quantum-state manipulation of trapped atomic ions (Wineland et al., 1998), for functional studies with fluorescent proteins (Rothbauer et al., 2008), for laser sideband cooling of the motion (Abich et al., 2004), for formation of ordered structures of trapped ions (Schiffer, 2003; Shi et al., 1999; Itano et al., 1995; Walther, 1995; Edwards et al., 1994), etc.
Currently there is considerable interest in studying properties of macromolecules and biomolecules. Approaches to a DNA sequencing using synthetic nanopores have been recently reviewed (Rhee and Burns, 2006, 2007; Branton et al 2008). Nanopores can be an effective tool for confinement of a DNA (Aksimentiev et al., 2004a; Aksimentiev et al., 2004b; Chen, 2005; Fredlake et al., 2006; Healy, 2007; Kricka et al., 2005; Nakane et al., 2003; Ryan et al., 2007, Zhao et al 2007, Payne et al 2008), while the translocating DNA efficiently mask ionic current through the pore, specific of a nucleotide instantaneously in the pore (Kasianowicz et al, 1996; Howorka et al, 2001). Alternatively, a tunneling current measured across the pore transversally to the translocating DNA varies with a base passing the pore (Zikic et al, 2006, Zhang et al, 2006, Lagerqvist et al., 2006). However, it has been realized that repeatable measurements of the base specific signature of each nucleotide depends critically on its difficult to control relative geometry to the pore during the DNA sequencing (Lagerqvist et al., 2007; Tabard-Cossa et al., 2007). For example, it is found that the variation in the conductance due to the geometry of the base relative the electrode can easily override the difference between different types of nucleotide (Zhang et al., 2006; Zikic et al., 2006). Therefore, a full control of the DNA translocation and localization as it threads the nanopore becomes a primary concern for the DNA sequencing techniques using synthetic nanopores (Trepagnier et al., 2007; Tsai and Chen, 2007; Chen and Peng, 2003). The novel idea of confinement of an ion in an aqueous environment within a Paul-type quadrupole trap (Zhao and Krstic 2008) offers increased electrical detection efficiency for heteropolymers confined within a nanopore regardless of detection scheme (Arnott et al., 1998; Oberacher et al., 2004). A ssDNA polymer is negatively charged along its phosphorous backbone, with one elementary charge per a monomer. Thus charged DNA can be stabilized by a combined static and rf quadrupole trapping electric fields in a linear Paul trap, which control its translocation through the device.
Though Paul trap has been generally used for trapping single ions in vacuum, recent molecular simulations have demonstrated that a nanoscale quadrupole Paul trap is capable of effectively confining ionic particles in both vacuum and in an aqueous environment (Zhao and Krstic, 2008). Such environment might be crucial for supporting the trap functions for bio-molecular ions like DNA. However, DNA appears more like a filamentous distribution of charge than a particle. The main goal of this work is to demonstrate, using a series of molecular dynamics simulations, confinement and dynamics of a linear bounded system of charges, ssDNA in particular, in a linear Paul nanotrap in vacuum, while aqueous environment is subject of our future work. The specific details of the Paul trap parameters and MD methods are given in Sections 2 and 3 respectively. The results of the simulations are presented in Section 4, We first study confinement of a line charge, constructed as a chain of charged beads bound by harmonic forces of various strengths, followed by the study of ssDNA of the various nucleotide types. Section 5 contains our conclusions.
2. System setup for 2D trap
In a quadrupole trap, the electric potential has the form (Leibfried et al., 2003)
| (1) |
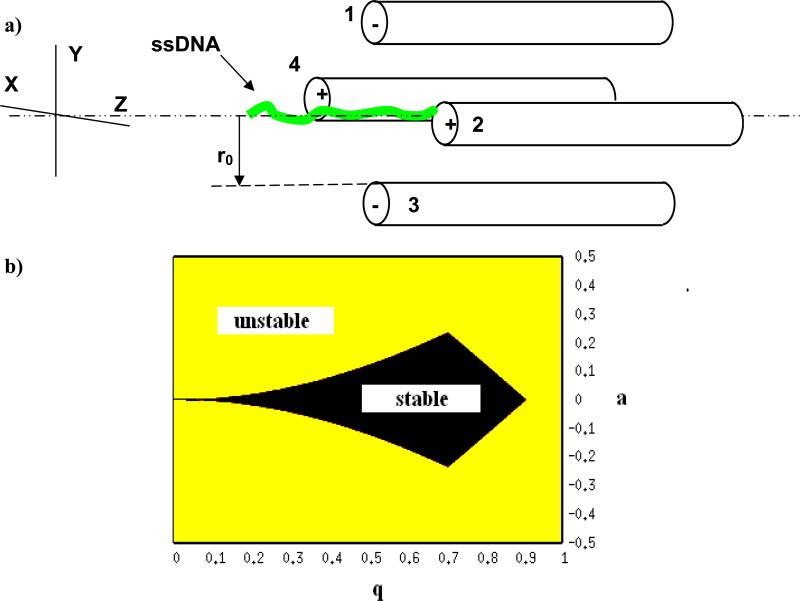
with the constraint α + β + γ = 0 to satisfy the Laplace equation Δ2Φ = 0 at all times. The 3D trap itself generally consists of two hyperbolic metal electrodes with their foci facing each other and a hyperbolic ring electrode halfway between the other two electrodes. The ions are trapped in the space between these three electrodes by a combination of AC and DC electric fields. A linear (2D) Paul trap is composed of four cylindrically shaped electrodes extended in the z direction as shown in the inset of Figure 1. In this case α = 1 = -β, γ = 0 (Paul, 1990; Leibfried et al., 2003). The electrodes are set at a potential of ±Φ0/2, where Φ0=2(Vdc +Vac cos wt). Thus, +Vdc is the DC component applied to the x pair of electrodes and –Vdc is the DC component applied to the y pair of electrodes. Vac is the zero to peak amplitude of the rf component oscillating with angular frequency ω.
Figure 1.
(a) Schematic sketch of a Paul trap, and (b), stability diagram for an ideal 2D Paul trap, showing the ranges of q and afor which the trap is stable.
The resulting electric field is given by its components (Paul, 1990)
| (2) |
The equations of motion of a particle of mass M and charge Q in this field is given by the Mathieu differential equations of motion (Paul, 1990).
| (3) |
where τ = wt / 2 and
| (4) |
The parameter 2r0 is the shortest distance between two non-adjacent electrode surfaces. The stability of the solution to the equations (3), defining the confining functions of the trap, is dependent on the values of parameters a andq , i.e. the stability depends on the magnitudes of both rf and static components of the applied bias, on the angular rf frequency ω, on the trap dimension r0, as well as on the ion charge Q over mass M ratio. Figure 1(b) shows the regions of stability for a linear Paul trap. For a nanoscale trap, the dimension r0 could range from tens of nanometers to a micrometer. As a result, to maintain stability according to Eq. (4), the other parameters have to adjust resulting in large values for the frequency ranging from a few GHz to a hundreds of MHz. The voltages are limited by the breakdown strength of the medium. As can be seen in Fig. 1(b), an ion can be stable with application of only AC potential, which has higher breakdown strength than a DC potential. In our modeling of the trap, we have considered potentials varying from 1-10V, frequencies ranging from 400 MHz to 10 GHz, and radius of the trap from 50-100 nm.
When q<<1 and a<<1, the approximate solution to Eqn. (3) is
| (5) |
Ω is the secular frequency and φ is a phase determined by the initial conditions of position and velocity of the particle. The motion corresponding to cos(ωt) term is the micro-motion, driven by the applied ac field. Higher order solutions in powers of q and a contain integer multiple of the frequencies in Eq. (5).
3. Simulation method
To study the behavior of a bonded line of charges as in a polymer chain or a single stranded DNA, we use a modified version of the molecular dynamics simulation package GROMACS 4.0.5 (Hess et al, 2008). The forces from the external potential of the quadrupole Paul trap given in Section 2 are implemented in GROMACS. The simulations are performed in vacuum with nonperiodic boundary conditions and we ensure that the motion of the center of mass was not removed. The MD simulations for DNA are performed within the NVT (constant number of particles, volume, and temperature) ensemble. The thermostat rescales the velocity with an exponential time constant τT but with a stochastic term which ensures a correct kinetic energy distribution (Bussi et al 2007).
We first model a linear line of charge by constructing a fictious chain of 267 bounded “atoms”, each of mass of 12 a.m.u and of charge of 1e. The total chain length is around 40 nm. As far as confinement functions are considered, ir turns out that this simplified structure illustrates main features of the realistic ssDNA. The bonds between adjacent atoms m-m+1 are assumed in a form of a harmonic potential where the bond strength was chosen to be kb= 38.76 eV/nm2, and the bond length blm=0.15 nm (the parameters of a C-C sp2 bond). The bond angle is defined between vectors connecting adjacent atoms (m,m-1) and ( m,m+1), while angular elastic forces are represented by a harmonic potential function where k was varied, k =0, 0.001 or 0.01 eV/rad2, with the equilibrium bond angle of rad.
For the ssDNA, a port (Sorin & Pande 2005) of the AMBER03 force field (Duan et al. 2003) is used. The number of charges on an N sequence DNA is N-1 because one of the phosphate end groups is hydrogen terminated, as follows form the force filed. Unlike in the chain above, the charges are not located on any one atom but are distributed as partial charges on the phosphate groups summing to -1e for each phosphate group (Duan et al. 2003). Most of our simulations are done for a 60 base ssDNA, though one case is performed with a 180 base ssDNA.
The electrostatic interactions are computed by introducing the Coulomb forces between all particles. This implies that the cut off length for electrostatic potential is larger than the length of the DNA or the chain in all studied cases, thus enabling long-range electrostatic interactions between all charged particles.
Before starting the molecular dynamics simulation the energy minimization of the system is performed with the steepest descent method. A time step in simulations is 1 fs. The neighbor list is updated every time step. For the model chain of beads, the initial velocity is assumed zero, while the initial position is defined with the center of mass of the chain at a fixed distance from the trap center. . For the ssDNA of different types and lengths the initial velocity of all atoms is random, obtained from the Maxwell's distribution at 300K, while the initial position is parallel to the trap axis at a distance (Δx, Δy) from the trap center.
We also tested cases with and without a thermostat for both DNAs and the model chain and found no noticeable difference in the trajectories. In the final simulations no thermostat is used for the chain of beads. However, in the DNA cases we use the velocity-rescaled thermostat (Bussi et al. 2007). The initial conditions such as center of mass velocity of the chain or DNA affect the amplitude of the trajectory but not the secular oscillation frequency. Visualization is done using the VMD software (Humphrey et al 1996). In most cases, for describing the confinement of a system in the trap, we analyze the radial distance of atoms and the center of mass of a group of atoms from the center of the trap as a function of time.
4. Results and Discussion
We compare confinement functions of the linear Paul trap for the cases of a model chain of beads and of ssDNA of different types. For the case of the ssDNA, we compare the trajectory with the standard trajectory of a single ion in the trap. For this reason we first repeat known features of the dynamics of a single particle ion in the Paul trap, which we later use for the comparisons
A. Single particle case
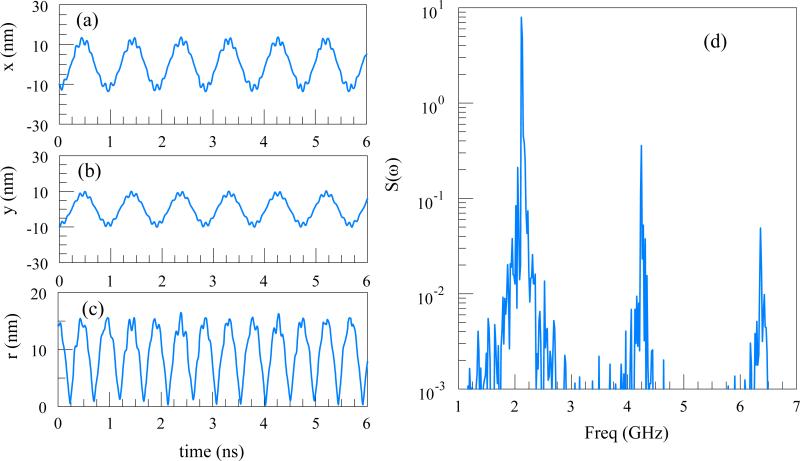
We consider a single charged particle in a Paul trap under the influence of an AC potential (a=0 in Eq. 4). The parameter q=0.2938 and frequency f=10 GHz are chosen to mimic the simulation parameters of DNA with the same q-factor in subsection C. The particle is initially with zero velocity, at (-9.98,-10.06) nm away from the trap center. The Eqn. (5) illustrates a trajectory dependence on the initial conditions. The initial conditions affect only the phase and amplitude of the trajectory. The computed trajectories are shown in Figure 2 (a-b). The Power Spectral Density (PSD) is computed using the radial distance from the trap axis, r(t), , defined here as the absolute value of the Fourier transform:
The PSD has several peaks, and the three most prominent ones are shown in Figure 2(d). From Eq. (5), the secular oscillation frequency for a=0, Ω ≈ ωq √2 =2.1 GHz. The first peak corresponds to the secular oscillation. Larger peaks are integer multiple ofΩ.
Figure 2.
(a) x-coordinate, (b) y-coordinate, (c) radial distance of a particle from the center of a linear Paul Trap. The trap parameters q=0.2938 and frequency f=10 GHz. (d) The PSD S(ω): The first peak at 2.1 GHz corresponds to the secular oscillation frequency.
B. Chain of charged beads
In order to understand the behavior of a line charge in comparison with a single charged particle in a linear Paul trap, we consider a chain of charged atom-like particles. Two different initial positions were considered: (i) with the chain initially parallel to the z-axis at a distance of (Δx,Δy)=(10,20) nm from the z-axis of the trap, (ii) the chain initially straight but slanted by an angle of 10 degrees to the z-axis. The applied parameters of the Paul trap are Vac=0.8V, Vdc =0, r0=100 nm, and f=10GHz, which yields for beads q ≈ 0.65.
Figure 3(a) shows the trajectory of a chain with k=0.01 eV/rad2. As long as the initial position of the chain is parallel to the z axis, the chain remains parallel regardless of the angular bond strength k. As a consequence, peaks of the PSD for various k have the same location and width (Figure 3(b)). The chain behaves as a rigid rod regardless of k. Only the range of frequences corresponding to the secular oscillation (≈ 5.1GHz ) is shown, and it is very close to the case of a single particle. The motions of the centers of mass of the chains with various angular force constants and with an initial orientation of 10 degrees about the x-axis is shown in Figure 3(c). The center of mass trajectories are almost the same for different bond strengths in Figure 3(a) with overlapping trajectories for all three cases but the fluctuations and oscillations are different such that the actual atom positions do not overlap for various k values. After about 4 ns from the start of the simulation, some of the atoms of the most rigid chain (k=0.01), went beyond the trap geometry (radial position > r0), pulling the others and leading to the unstable trajectory. The smaller k means larger flexibility of the chain, and each of the atoms try to confine independently. However, large k=0.01 eV/rad2 yields a high degree of correlation of atomic motion, and the chain behaves close to a rigid rod. Difference of the forces to the various atoms along the rod produces a torque that rotate the whole system and eventually the end atoms might leave the trap radius if the chain is long enough. Note that PSD for the unstable case is obtained by integration up to 4 ns only, leading to apparently broader peak as compared to the other two cases (Figure 3(d)). From Figures 3 b) and d) the secular frequency of the chain center of mass is Ω ≈ 5.1 GHz in Figure 3 is not too far form the estimated frequency Ω0 ≈ 4.65 GHz of the single ion in a trap with the same q factor (0.65).
Figure 3.
(a) The motion of the center of mass of a chain initially parallel to the z-axis for bond angle force constant of k=0.01 eV/rad2. (b) The power-spectral density of the center of mass trajectories for different harmonic bond angle force constants k=0, 0.001 and k=0.01 eV/rad2 for the trajectories in (a), showing overlapping trajectories. (c) The motion of the center of mass of the chains of various angular force constants with the initial orientation at an angle to the trap axis. The trajectories overlap except for k=0.01 eV/rad2 which becomes unstable after 4 ns. (d) The PSD of the center of mass trajectories for different harmonic bond angle strengths k=0, 0.001, 0.01 eV/rad2 for the trajectories in (c).
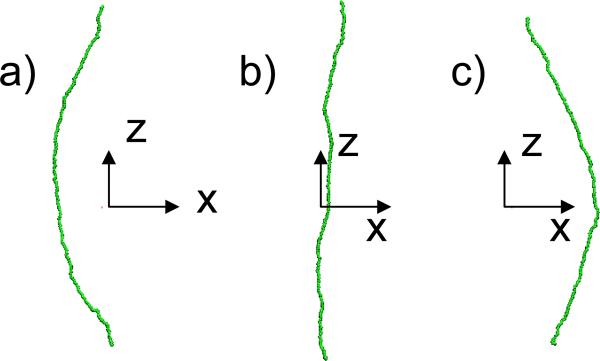
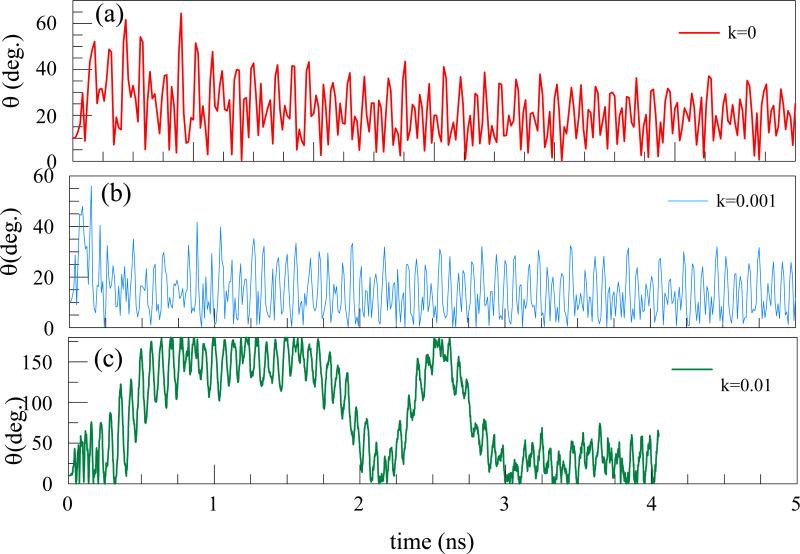
Furthermore, if the initial position of the chain is not parallel to the trap axis but is inclined by an angle, the chain fluctuates and bends (Figure 4), since various atoms, being at different distances form the trap axis are under different electrical forces of the trap In Figure 5, the rotations and oscillations of the chain are quantified by plotting the variation with time of the angle between a line joining the center atom of a chain and top end (at Fig. 4) with respect to the trap axis for various k. For the chain with weaker bond strength, the oscillations are relatively small, but when the tube is most rigid (k=0.01), the tube undergoes a few rotations, and even flipping the orientations, before becoming unstable (Fig. 5c). When the chain of atoms is most rigid (largest k) the chain undergoes complete rotation before one of the atoms exceeds r0 and the trajectory becomes unstable. We note that that the bond strength, kb , is kept the same in all cases because it does not influence the flexibility of the chain, critical for the stability in the trap. Size of kb rather modifies the stretching of the chain, which might modify its length but is not critical in the confinement.
Figure 4.
(a), (b) and (c) are different conformations of the chain as it oscillates in the trap. The z-axis is the trap axis. The bending is a result of the initial orientation, which is here 10°to the z-axis, while k=0.
Figure 5.
a),b),c)The variation of the angle between a line joining the center atom of a chain and one of the ends with respect to the trap axis for different flexibilities as a function of time.
C. Single stranded DNA
Unlike the chain of point charges considered in section B, an ssDNA is geometrically a more complex system. Thus, the atoms of the DNA bases extend about a nm from the axis, and could carry their own electrostatic charges. Besides, point charges are not distributed uniformly in the DNA but are rather distributed as partial charges. Finally, the bonding characteristics of a DNA are distributed and more complex than in the case of our modeled chain bonding. The following types of the ssDNA are considered: (i) 60 base ssDNA, with identical bases of G, A, T and C type, (ii) a 60 base ssDNA with mixed 15G-15A-15T-15C type, (iii) a 180 base single stranded DNA, by lining up 3 ssDNAs of case (ii) , and (iv) a 60 base ssDNA with randomly mixed bases.
The initial length of the 60-base ssDNA is approximately 40 nm. The DNA is constructed as a single strand of a helical DNA that retains a small pitch. Initially, the helical DNA axis is parallel to the trap axis. During the initial, preparation phase of the simulation the ssDNA straightens out from the initial helical coil, but not necessarily fully parallel to the trap axis. We note that due to the spatial, unaligned, distribution of the charges in a ssDNA , together with the described geometrical fluctuations leads to unequal trap electrical forces to various atoms and monomers of the ssDNA.
i) Comparison of DNA trajectory and a single particle trajectories
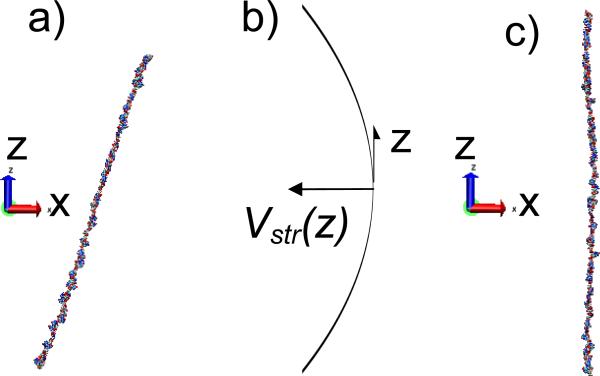
Under the conditions of Vac=10V, Vdc=0. f=10 GHz, r0=100 nm (q=0.2938, as in subsection A), a 60 base DNA with only G bases is stable. The initial position of the center-of-mass is (-9.98,-10.06) nm from the axis of the trap. The atoms of the DNA have a Maxwellian velocity distribution at 300K. Though the DNA is initially parallel to the trap axis, it undergoes rotations and can be inclined to the z-axis as illustrated in the snapshot in Figure 6. Though the DNA does not remain parallel to the z-axis, we note that the DNA does not curl up into a ball.
Figure 6.
(a) A snapshot of a 60 G base ssDNA as it oscillates in the trap. The z-axis denotes the trap axis. The DNA remains straight though it undergoes some oscillations and is not parallel to the z-axis. (b) A schematic of a parabolic stretching potential that could be applied in the z-direction to confine the DNA (c) DNA position after stretching potential is applied.
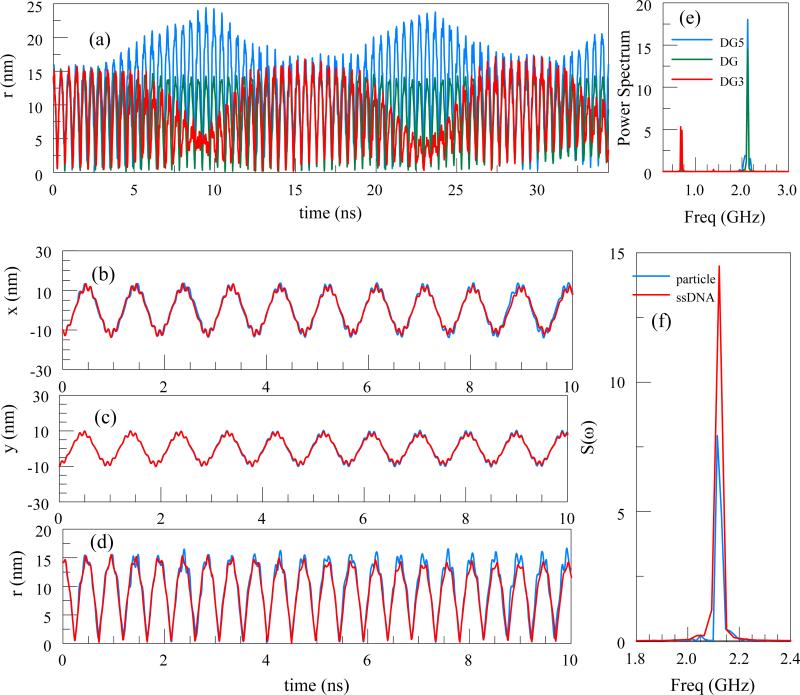
The charge-mass ratio Q/M for a ssDNA is calculated by dividing the total charge by the total mass. The stable trajectories of the DNA are shown in Figure 7 above. Figure 7(a) shows the trajectories of the end groups along with that of the center of mass. The figure shows that the oscillations of the end groups are in opposite phases. In Figures 7(b-d) the comparison of the center of mass DNA trajectory with that of particle having the same q-factor of 0.2938 is presented. It is remarkable that a single particle and a DNA with a complex structure with distributed charges have very similar trajectories, as is further illustrated by the overlapping PSDs in Figure 7(f).
Figure 7.
(a) r trajectory of the center of mass (green) as well as the center of mass of the end groups (red and blue) as a function of time. (b),(c), and (d) are x,y and r coordinates of the trajectories of a 60 G base ssDNA as a function of time, compared with the trajectory of a single particle. (e) PSD for the center of mass of the DNA as well as the center of mass of the end groups denoted by DG5 and DG3. (f) Comparison of the center of mass PSD for the ssDNA with that of a particle with the same q-factor.
ii) Comparison the trajectories of ssDNAs of various types
We compare the trajectories of 4 different 60 base ssDNA, definmed by G, A, T or C bases. Two cases are tested: with (Vdc=0.02 V, Vac=1 V, r0=50 nm, f=5 GHz) and without dc voltage (Vdc=0). The 50 ns sections of the r coordinate of the trajectories are shown in Figure 8(a),(b) and (c). The trajectories have similar features, yet they are not identical and do not overlap each other.
Figure 8.
(a) r(t) coordinate of trajectory of the center of mass of ssDNAs with different bases with Vdc=0.02 V, and (b) r(t) of the center of mass for Vdc=0 V. (c) The r(t) of center of masses of G, A, T, C of a 60 base ssDNA with 15 contiguous bases of G, A, T and C. (d) PSD of a 60 base, ssDNA in (a). (e) The PSD for case in (b). Also shown in dashed lines is the PSD of the r(t) for a single particle with different q-factors corresponding to different DNA bases (f) The PSD for case (c).
In order to capture the differences in the trajectories, we computed the Fourier transform of these trajectories, shown in Figure 8(d), (e) and (f). For the ssDNAs with identical bases throughout, the PSD peaks are clearly distinguishable when varying the type. The peaks are related to the secular oscillation frequency.. In Figure 8(e), the power spectrum for a single charged particle in the 2D Paul trap with the same q-factor for each DNA base is shown in dashed lines, showing a strong mutual correlation This implies that the DNA structure, charge distribution, bond parameters etc. do not significantly influence the power spectrum of the center-of-mass trajectory of the DNA. It is the charge-mass ratio that primarily determines the location of the peaks. In Figure 8(f), the power spectrum of the trajectory of an ssDNA with 15 contiguous bases of G, A, T, and C is shown. The main peak (secular frequency) at ~1.9 GHz of the C-segment (green) overlaps with the peak of the neighbouring T-segment (blue), and is not visible at the figure. The main peak of the A-segment, neighbouring T, is also approximately at 1.9 GHz. Thus, C, T and A segments show a strong motion correlation influencing a common secular frequency, different form the individual ones. The exception is the G segment, which tries to remain its own secular frequency (as in (e)), though broadened and split.
(iii) Mixed base DNA
We consider a 60 base DNA with a mixed sequence (15G, 15A, 15T, 15C). The r(t) coordinate of the trajectories of the center of mass of individual bases are plotted in Figure 9. The end bases motion are DC5 and DG3. Two interior chosen bases are also considered (the base DA is located towards the end of DNA with the end group DC5 and DC is located towards the end with base DG3). The trajectories and the PSD (Figure 9(b)) show that motion correlation caused by geometrical proximity of the various segments is a major factor in the similarity of the trajectories and the relevant spectral densities. For example DC5 and DC are both Cytosine bases but their spectral densities are markedly different. DC5 and DA have similar characteristics and DC and DG3 have common peaks arising from geometrical proximity.
Figure 9.
(a) r trajectory of the center of mass of two end bases (DC5 and DG3) and two interior bases (DA and DC) in a mixed base ssDNAs consisting of 60 bases; Vdc=0V, Vac=1V, r0=50 nm, f=5Ghz and (b) The PSD of the center of mass of the bases.
(iv) Application of the stretching potentials
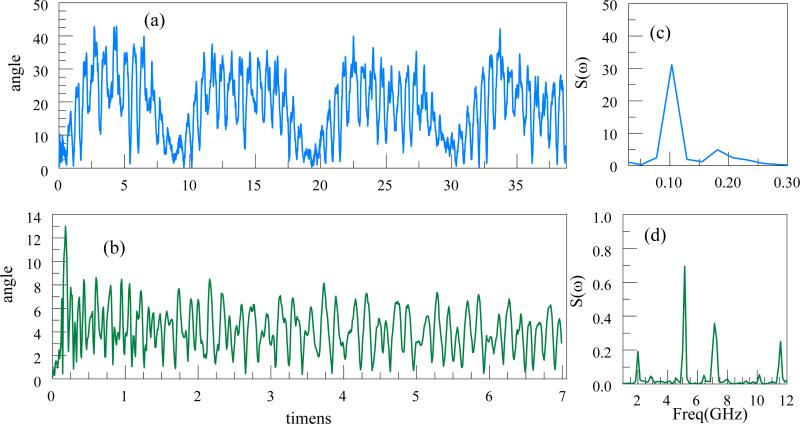
Just as in a chain of beads, ssDNA exhibits oscillations. In Figure 10 (a) we show the variation with time of the angle between the trap axis and the line connecting the center of mass of the end groups of a 60 base G ssDNA of the q-factor =0.47 (Vac=4V, r0=100 nm, f=5 GHz). The angle varies roughly between 0 and 45 degrees. In order to stabilize DNA translocation through the Paul trap, it is important to suppress these oscillations.
Figure 10.
Shown are the variations with time of the angle of the line connecting the end bases with the z-axis. (a): 15 bases of G, 15A, 15C, 15T. (b): The variation of the angle for an ssDNA with 180 bases (replicated the DNA above 3 times) but with the stretching field. Corresponding power spectral densities are shown at (c) and (d).
Here we propose a stretching field in the axial z direction, Estr=0.1((z-z0)/L) V/nm where L is the length of a DNA, z is the z coordinate of the atom, z0 is the mean z coordinate of all atoms. The electrostatic potential is parabolic as shown in Figure 6(b). Clearly from the figure the stretching field reduces the rotation around the z-axis such that the range of angles is reduced from 0-40 degrees to 0-8 degrees and orients the DNA parallel to the trap axis.
(iv) Stability range of an ssDNA
The center of mass motion can be used to define the stability of an ssDNA in the Paul nanotrap. From the considerations in this section it follows that the range of stability for an ssDNA for various q-a values is similar to that of a single ion shown in Figure 1(b). For a case of Vac= 1V, r0 =100nm, f=1GHz, q≈2.8, the ssDNA center-of-mass trajectory was unstable as is expected for a single ion for the same q factor. However in some cases, close to the boundaries of the range of stability in Figure 1(b), where one would find the stability for a single ion, the ssDNA is unstable. For example, we considered a case near the edge of the stable region in Figure 1(b) where q=0.47 and a=0.94. Although for a single ion this would give a stable trajectory, for a 60 G base DNA, with Vdc =0.08 V, Vac=1V, r0=50 nm, f=5 GHz we obtained an unstable trajectory already after about 0.3 ns (at least one atom had an r-coordinate greater than r0). This is caused by additional degrees of motion of the ssDNA, spatial distribution of its charges, as well as by a random nature of initial conditions of various atoms in the DNA, subject to the Maxwell distribution of velocities.
4. Conclusions
Using molecular dynamics simulations, we have studied the dynamics of a filamented structure with line-distributed charges such as a charged linear polymer and a single stranded DNA in a nanoscale 2D Paul trap, in vacuum. A line charge can be effectively trapped, with stability parameters defined similarly to the single charged particle in the trap. A line charge undergoes both oscillations and rotations in the trap depending on its initial angle, position and velocity, as well as of the angular bonding force of the adjacent atoms. A 40 nm long single stranded DNA does not fold or curl in the Paul trap, but could undergo rotations and oscillations about the center of mass, similarly to the chain of charges. Application of a stretching force by the gradient electric field suppresses the rotations, and stabilizes the DNA confinement in the linear trap.
Acknowledgments
This research was supported by the U.S. National Human Genome Research Institute of the National Institutes of Health under grant No. 1R21HG004764-01, and (SJ and PK) by U.S. Department of Energy (DOE) at ORNL managed by a UT-Battelle for the U.S. DOE under contract No. DEAC05-00OR22725, by the U.S. DOE. This research was supported by an allocation of advanced computing resources supported by the National Science Foundation. The computations were performed on Kraken (a Cray XT5) at the National Institute for Computational Sciences (http://www.nics.tennessee.edu/).
REFERENCES
- Abich K, Keil A, Reiss D, Wunderlich C, Neuhauser W, Toschek PE. Thermally activated hopping of two ions trapped in a bistable potential well. Journal of Optics B-Quantum and Semiclassical Optics. 2004;6:S18–S23. [Google Scholar]
- Aksimentiev A, Heng JB, Timp G, Schulten K. Microscopic kinetics of DNA translocation through synthetic nanopores. Biophysical Journal. 2004a;87:2086–97. doi: 10.1529/biophysj.104.042960. [DOI] [PMC free article] [PubMed] [Google Scholar]
- Aksimentiev A, Schulten K, Heng J, Ho C, Timp G. Molecular dynamics simulations of a nanopore device for DNA sequencing. Biophysical Journal. 2004b;86:480A–A. [Google Scholar]
- Arnott D, Henzel WJ, Stults JT. Rapid identification of comigrating gel-isolated proteins by ion trap mass spectrometry. Electrophoresis. 1998;19:968–80. doi: 10.1002/elps.1150190612. [DOI] [PubMed] [Google Scholar]
- Branton D, Deamer DW, Marziali A, Bayley H, Benner S, Butler T, et al. The potential and challenges of nanopore sequencing. Nature biotechnology. 2008 Oct;26(10):1146–53. doi: 10.1038/nbt.1495. [DOI] [PMC free article] [PubMed] [Google Scholar]
- Bussi G, Donadio D, Parrinello M. Canonical sampling through velocity rescaling. J. Chem. Phys. 2007;126:014101. doi: 10.1063/1.2408420. [DOI] [PubMed] [Google Scholar]
- Chen CM, Peng EH. Nanopore sequencing of polynucleotides assisted by a rotating electric field. Applied Physics Letters. 2003;82:1308–10. [Google Scholar]
- Chen CM. Driven translocation dynamics of polynucleotides through a nanopore: off-lattice Monte Carlo simulations. Physica A. 2005;350:95–107. [Google Scholar]
- Duan Y, et al. A point-charge force field for molecular mechanics simulations of proteins based on condensed-phase quantum mechanical calculations. J. Comp. Chem. 2003;24:1999–2012. doi: 10.1002/jcc.10349. [DOI] [PubMed] [Google Scholar]
- Edwards CS, Gill P, Klein HA, Levick AP, Rowley WRC. Laser-cooling effects in few-ion clouds of YB+ Applied Physics B-Lasers and Optics. 1994;59:179–85. [Google Scholar]
- Fredlake CP, Hert DG, Mardis ER, Barron AE. What is the future of electrophoresis in large-scale genomic sequencing? Electrophoresis. 2006;27:3689–702. doi: 10.1002/elps.200600408. [DOI] [PubMed] [Google Scholar]
- GHealy K. Nanopore-based single-molecule DNA analysis. Nanomedicine. 2007;2:459–81. doi: 10.2217/17435889.2.4.459. [DOI] [PubMed] [Google Scholar]
- Hess B, Kutzner C, van der Spoel D, Lindahl E. GROMACS 4: Algorithms for Highly Efficient, Load-Balanced, and Scalable Molecular Simulation. Journal of Chemical Theory and Computation. 2008;4:435–447. doi: 10.1021/ct700301q. [DOI] [PubMed] [Google Scholar]
- Howorka S, Cheley SS, Bayley H. Nat. Biotechnol. 2001;19:636. doi: 10.1038/90236. [DOI] [PubMed] [Google Scholar]
- Humphrey W, Dalke A, Schulten K. VMD: Visual molecular dynamics. Journal of Molecular Graphics. 1996;14:33. doi: 10.1016/0263-7855(96)00018-5. [DOI] [PubMed] [Google Scholar]
- Itano WM, Bergquist JC, Bollinger JJ, Wineland DJ. Cooling methods in ion traps. Physica Scripta. 1995;T59:106–20. [Google Scholar]
- Kasianowicz JJ, Brandin E, Branton D, Deamer DW. Proc. Natl. Acad. Sci. U.S.A. 1996;93:13770. doi: 10.1073/pnas.93.24.13770. [DOI] [PMC free article] [PubMed] [Google Scholar]
- Kricka LJ, Park JY, Li SFY, Fortina P. Miniaturized detection technology in molecular diagnostics. Expert Review of Molecular Diagnostics. 2005;5:549–59. doi: 10.1586/14737159.5.4.549. [DOI] [PMC free article] [PubMed] [Google Scholar]
- Lagerqvist J, Zwolak M, Di Ventra M. Fast DNA Sequencing via Transverse Electronic Transport. Nano Letters. 2006;6:779. doi: 10.1021/nl0601076. [DOI] [PMC free article] [PubMed] [Google Scholar]
- Lagerqvist J, Zwolak M, Di Ventra M. Influence of the environment and probes on rapid DNA sequencing via transverse electronic transport. Biophysical Journal. 2007;93:2384–90. doi: 10.1529/biophysj.106.102269. [DOI] [PMC free article] [PubMed] [Google Scholar]
- Leibfried D, Blatt R, Monroe C, Wineland D. Quantum dynamics of single trapped ions. Reviews of Modern Physics. 2003;75:281–324. [Google Scholar]
- Nakane JJ, Akeson M, Marziali A. Nanopore sensors for nucleic acid analysis. Journal of Physics-Condensed Matter. 2003;15:R1365–R93. [Google Scholar]
- Oberacher H, Parson W, Oefner PJ, Mayr BM, Huber CG. Applicability of tandem mass spectrometry to the automated comparative sequencing of long-chain oligonucleotides. Journal of the American Society for Mass Spectrometry. 2004;15:510–22. doi: 10.1016/j.jasms.2003.12.002. [DOI] [PubMed] [Google Scholar]
- Paul W. Electromagnetic traps for charged and neutral particles. Reviews of Modern Physics. 1990;62:531–40. [Google Scholar]
- Payne CM, Zhao XC, Vlcek L, Cummings PT. Molecular dynamics simulation of ss-DNA translocation between a copper nanoelectrode gap incorporating electrode charge dynamics. J. Phys. Chem. B. 2008;112:1712–7. doi: 10.1021/jp077483e. [DOI] [PubMed] [Google Scholar]
- Rhee M, Burns MA. Nanopore sequencing technology: research trends and applications. Trends in Biotechnology. 2006;24:580–6. doi: 10.1016/j.tibtech.2006.10.005. [DOI] [PubMed] [Google Scholar]
- Rhee M, Burns MA. Nanopore sequencing technology: nanopore preparations. Trends in Biotechnology. 2007;25:174–81. doi: 10.1016/j.tibtech.2007.02.008. [DOI] [PubMed] [Google Scholar]
- Rothbauer U, Zolghadr K, Muyldermans S, Schepers A, Cardoso MC, Leonhardt H. A versatile nanotrap for biochemical and functional studies with fluorescent fusion proteins. Molecular & Cellular Proteomics. 2008;7:282–289. doi: 10.1074/mcp.M700342-MCP200. [DOI] [PubMed] [Google Scholar]
- Ryan D, Rahimi M, Lund J, Mehta R, Parviz BA. Toward nanoscale genome sequencing. Trends in Biotechnology. 2007;25:385–9. doi: 10.1016/j.tibtech.2007.07.001. [DOI] [PubMed] [Google Scholar]
- Schiffer JP. Order in confined ions. Journal of Physics B-Atomic Molecular and Optical Physics. 2003;36:511–23. [Google Scholar]
- Seidelin S, Chiaverini J, Reichle R, Bollinger JJ, Leibfried D, Britton J, Wesenberg JH, Blakestad RB, Epstein RJ, Hume DB, Itano WM, Jost JD, Langer C, Ozeri R, Shiga N, Wineland DJ. Microfabricated surface-electrode ion trap for scalable quantum information processing. Physical Review Letters. 2006;96:253003. doi: 10.1103/PhysRevLett.96.253003. [DOI] [PubMed] [Google Scholar]
- Shi L, Zhu XW, Feng M, Fang XM. Ordered structures of a few ions in the Paul trap. Communications in Theoretical Physics. 1999;31:491–6. [Google Scholar]
- Sorin EJ, Pande VS. Exploring the Helix-Coil Transition via All-Atom Equilibrium Ensemble Simulations. Biophys. J. 2005;88(4):2472–2493. doi: 10.1529/biophysj.104.051938. [DOI] [PMC free article] [PubMed] [Google Scholar]
- Tabard-Cossa V, Trivedi D, Wiggin M, Jetha NN, Marziali A. Noise analysis and reduction in solid-state nanopores. Nanotechnology. 2007;18:305505. [Google Scholar]
- Trepagnier EH, Radenovic A, Sivak D, Geissler P, Liphardt J. Controlling DNA capture and propagation through artificial nanopores. Nano Letters. 2007;7:2824–30. doi: 10.1021/nl0714334. [DOI] [PubMed] [Google Scholar]
- Tsai YS, Chen CM. Driven polymer transport through a nanopore controlled by a rotating electric field: Off-lattice computer simulations. Journal of Chemical Physics. 2007;126:144910. doi: 10.1063/1.2717187. [DOI] [PubMed] [Google Scholar]
- Vant K, Chiaverini J, Lybarger W, Berkeland DJ. Photoionization of strontium for trapped-ion quantum information processing. arXiv:quant-ph. 2006:0607055. [Google Scholar]
- Walther H. From a single-ion to a mesoscopic system - crystallization of ions in Paul traps. Physica Scripta. 1995;T59:360–8. [Google Scholar]
- Wineland DJ, Monroe C, Itano WM, Leibfried D, King BE, Meekhof DM. Experimental issues in coherent quantum-state manipulation of trapped atomic ions. Journal of Research of the National Institute of Standards and Technology. 1998;103:259–328. doi: 10.6028/jres.103.019. [DOI] [PMC free article] [PubMed] [Google Scholar]
- Zhang XG, Krstic PS, Zikic R, Wells JC, Fuentes-Cabrera M. First-principles transversal DNA conductance deconstructed. Biophysical Journal. 2006;91:L4–L6. doi: 10.1529/biophysj.106.085548. [DOI] [PMC free article] [PubMed] [Google Scholar]
- Zhao XC, Payne CM, Cummings PT, Lee JW. Single-strand DNA molecule translocation through nanoelectrode gaps. Nanotechnology. 2007;18:424018. doi: 10.1088/0957-4484/18/42/424018. [DOI] [PubMed] [Google Scholar]
- Zhao XC, Krstic PS. Molecular dynamics simulation study on trapping ions in a nanoscale Paul trap. Nanotechnology. 2008;19:195702. doi: 10.1088/0957-4484/19/19/195702. [DOI] [PMC free article] [PubMed] [Google Scholar]
- Zikic R, Krstic PS, Zhang XG, Fuentes-Cabrera M, Wells J, Zhao XC. Characterization of the tunneling conductance across DNA bases. Physical Review E. 2006;74:011916. doi: 10.1103/PhysRevE.74.011919. [DOI] [PubMed] [Google Scholar]
- Zwolak M, Di Ventra M. Electronic Signature of DNA Nucleotides via Transverse Transport. Nano Letters. 2005;5:421. doi: 10.1021/nl048289w. [DOI] [PubMed] [Google Scholar]


