

Abstract
Many important regulatory functions are performed by dynamic multiprotein complexes that adapt their composition and activity in response to different stimuli. Here we employ quantitative affinity purification coupled with mass spectrometry to efficiently separate background from specific interactors but add an additional quantitative dimension to explicitly characterize stimulus-dependent interactions. This is accomplished by SILAC in a triple-labeling format, in which pull-downs with bait, with bait and stimulus, and without bait are quantified against each other. As baits, we use full-length proteins fused to the green fluorescent protein and expressed under endogenous control. We applied this technology to Wnt signaling, which is important in development, tissue homeostasis, and cancer, and investigated interactions of the key components APC, Axin-1, DVL2, and CtBP2 with differential pathway activation. Our screens identify many known Wnt signaling complex components and link novel candidates to Wnt signaling, including FAM83B and Girdin, which we found as interactors to multiple Wnt pathway players. Girdin binds to DVL2 independent of stimulation with the ligand Wnt3a but to Axin-1 and APC in a stimulus-dependent manner. The core destruction complex itself, which regulates beta-catenin stability as the key step in canonical Wnt signaling, remained essentially unchanged.
Keywords: protein interaction, interactome, signaling pathways, SILAC, dynamic interactions, Wnt3a, APC, Axin-1, DVL2, CTBP2
Short abstract
Protein interactions are often regulated depending on the cellular context but are generally studied in a static format. Here we develop a triple-SILAC based dynamic interaction screen and apply it to the Wnt signaling pathway. Our screens identify many known Wnt signaling complex components and link novel candidates to Wnt signaling, including FAM83B and Girdin, which we found as interactors to multiple Wnt pathway players.
Introduction
The study of protein-protein interactions is of pivotal importance because most biological functions are mediated by protein complexes. In contrast to most other techniques, affinity purification coupled with mass spectrometry (AP-MS) is unbiased in that it does not require knowledge of potential interaction partners and it can be used for systems-wide analysis of protein-protein interaction networks.1 AP-MS has often been performed with the goal of a high degree of purification of protein complexes using tandem affinity purification (TAP) tagging approaches.2 However, this requires large amounts of starting material because of the two purification steps. Furthermore, the stringent washing conditions involved in TAP purifications often lead to loss of weakly bound protein complex members. Quantitative mass spectrometry can overcome these limitations by distinguishing specific interactors from unspecific background binders by the ratios of proteins in bait versus control pull-downs.3−5 This allows single step low stringent purification and high confidence interaction mapping including weak interactors.
There are many different formats for performing AP-MS in a qualitative, semiquantitative and quantitative fashion.6−22 Recently our laboratory has established an integrated quantitative workflow for AP-MS using bacterial artificial chromosomes (BACs) containing the gene of interest fused to the green fluorescent protein (GFP), which leads to expression of the full-length, GFP-tagged proteins from their endogenous promoters.23 This system, termed QUBIC for QUantitative BAC InteraCtomics, has several advantages. Most importantly the bait protein is expressed close to endogenous levels because the entire gene encoding the bait protein, including up- and downstream regulatory elements, is stably integrated into the genome of the cell.24−27 As tagged transcripts and proteins are processed by the cell equally to the endogenous counterpart, different splice isoforms can be expressed and proteins are post-translationally modified in the correct manner. Furthermore, cell lines expressing tagged versions of very large proteins can be created. In contrast to APs of the endogenous proteins, the QUBIC strategy does not rely on the availability of highly specific and immunoprecipiating antibodies for each protein of interest.
Most protein complexes, especially those with regulatory functions, are dynamic structures that form or change their composition and activity in response to cellular perturbations.28 Stimulation-dependent changes in protein conformation, subcellular localization or modification determine the interaction properties of the different complex members. AP-MS using stable isotope labeling with amino acids in cell culture (SILAC)29,30 in a double-labeling format is frequently employed for the characterization of protein interactions. SILAC with three isotope states has previously mainly been used to study the time dimension of the proteome31−33 but has also enabled comparison of bead proteomes,34 differentiation of isoform specific interactors6 and the change in composition of RNA polymerase upon inhibition of transcription.35
Here we wished to establish and characterize a general method for characterizing constitutive and stimulation-dependent dynamic interaction partners of regulatory protein complexes. We combined the QUBIC approach with triple SILAC labeling to differentiate background binders from specific binders and, in the same experiment, constitutive interactors from those that associate with a complex in a stimulus-dependent manner. We applied this method to the analysis of complexes in the Wnt signaling pathway and investigated differential complex formation dependent on stimulation of cells with the Wnt ligand Wnt3a.
The canonical Wnt pathway regulates cell fate, proliferation and self-renewal of adult stem and progenitor cells during the entire lifespan of metazoan organisms.36−40 Aberrant regulation of this pathway leads to different diseases, most prominently sporadic colon cancer. The key step in canonical Wnt signaling is the regulation of β-catenin. In the absence of Wnt ligands, β-catenin levels are low as a result of its continuous phosphorylation by the destruction complex, which triggers ubiquitylation and subsequent proteasomal degradation. Core components of the destruction complex are APC (Adenomatous Polyposis Coli) and Axin-1, which both function as scaffolds, and the kinases glycogen synthase kinase-3β (GSK-3β) and casein kinase I-α (CKI-α). Upon Wnt ligand binding to the receptors Frizzled and LRP5/6, the destruction complex function is attenuated, at least in part through relocalization to the plasma membrane and interactions with Dishevelled (DVL).36−40 Levels of β-catenin then accumulate in the cytoplasm and β-catenin translocates to the nucleus where it binds to TCF/LEF transcription factors and coactivates transcription of target genes.
Because of its central importance, the Wnt pathway is intensively studied and new pathway players that may be potential therapeutic targets are still found using a variety of approaches.41−43 Although canonical Wnt signaling has been investigated in depth, the exact mechanism by which the destruction complex is inhibited and β-catenin is stabilized is still not fully understood. Our Wnt pathway interactome study identifies potential novel Wnt pathway members and sheds light on the dynamics of the complexes involved.
Experimental Procedures
Cell Culture
HeLa cells stably expressing BACs with human GFP-tagged APC, Axin-1, DVL2 or CtBP2 were grown at 37 °C and 5% CO2 for at least five passages in SILAC media (Dulbecco’s modified eagle medium minus l-arginine and l-lysine (Invitrogen) with 10% dialyzed fetal bovine serum (Invitrogen) and 100 U/mL penicillin/streptomycin (Invitrogen)) containing 49 mg/mL l-arginine (Arg0) and l-lysine (Lys0) (light), 13C614N4-l-arginine (Arg6) (Euriso-top) and 4,4,5,5-D4-l-lysine (Lys4) (medium) or 13C615N4-l-arginine (Arg10) and 13C615N2-l-Lysine (Lys8) (heavy) each supplemented with 400 μg/mL Geneticin (Invitrogen). The untransfected control HeLa Kyoto cells were only light or heavy SILAC labeled. Cells were expanded to four, 80% confluent 15 cm dishes per affinity purification and per SILAC label (in total 12 dishes for one triple SILAC experiment). The cell lines were generated by the BAC recombineering technology24,25 and used as transgenic cell pools.
Wnt Stimulation and Cell Harvest
In the “forward” experiment, heavy labeled transgenic cell lines were stimulated for 2 h with 200 ng/mL recombinant mouse Wnt3a (RD Systems), dissolved in carrier solution (0.1% BSA in PBS) (Suppl. Figure 1, Supporting Information). The corresponding medium labeled transgenic cells and light labeled untransfected control cells were incubated with the carrier solution for two hours. In the “reverse” experiment, the labels in the previous “heavy” and “light” conditions were interchanged, whereas the medium labeled condition was unchanged. Subsequently, cells were trypsinized, pelleted, resuspended in PBS and counted. Equal cell numbers of each SILAC condition were separately pelleted, snap frozen and stored at −80 °C.
Preparation of Cell Extract
Cell pellets were thawed on ice and resuspended in 2 mL ice-cold lysis buffer (basic buffer (150 mM NaCl, 50 mM Tris-HCl (pH 7.5), 5% glycerol), 1% IGPAL-CA-630 (Sigma), 1 mM MgCl2, 1% Benzonase (Merck) and 1x EDTA-free complete protease inhibitors (Roche)). After incubation for 40 min on a rotation wheel at 4 °C lysates were centrifuged at 4000× g for 15 min at 4 °C. Supernatants were subjected to affinity purification.
Affinity Purification
Each cleared SILAC extract was incubated separately with 100 μL of μMACS mouse monoclonal anti-GFP antibody coupled magnetic microbeads (Miltenyi Biotech) for 15 min. One μColumn (Miltenyi Biotech) per SILAC extract was equilibrated with 250 μL basic buffer containing 1% IGPAL-CA-630 (Sigma) using a hand magnet (Miltenyi Biotech). After incubation with the beads, lysates were applied to the columns. Subsequently columns were rinsed four times with 1 mL basic buffer containing 0.05% IGPAL-CA-630 (Sigma). For unspecific protein elution 25 μL of preheated (95 °C) SDS gel loading buffer (50 mM Tris HCl (pH 8), 50 mM DTT, 1% SDS, 0.005% bromophenol blue, 10% glycerol) were added and incubated for 5 min. Eluates were collected by adding additional 30 μL preheated SDS gel loading buffer to each column. Corresponding eluates of the triple SILAC experiment and 30 μL NuPAGE LDS sample buffer (Invitrogen) were combined.
Protein Digestion
Combined eluates were separated by 1D-SDS-PAGE (4–12% Novex mini-gel) (Invitrogen) and visualized by colloidal Coomassie staining (Invitrogen). Proteins were separated in three adjacent lanes that were subsequently cut into 8 slices. All gel slices were subjected to in-gel digestion with trypsin (Promega).44,45 Resulting peptides were extracted with 30% ACN in 3% TFA, concentrated until full evaporation of organic solvent and further concentrated and desalted on reversed phase C18 StageTips.46,47 Shortly prior to high resolution liquid chromatography tandem mass spectrometry (LC-MS/MS) analysis peptides were eluted twice from the StageTips with 20 μL buffer B (80% ACN in 0.5% acetic acid) solution into a 96 sample well plate (Abgene), concentrated in a SpeedVac concentrator until removal of the organic solvent and reconstituted with buffer A* (2% ACN in 0.1% TFA).
LC-MS/MS Analysis
Eluted peptides were analyzed by a nanoflow HPLC (Proxeon Biosystems) coupled online via a nanoelectrospray ion source (Proxeon Biosystems) to a linear trap quadrupole (LTQ)-Orbitrap Velos mass spectrometer (Thermo Fisher Scientific). Peptide mixtures were loaded with an IntelliFlow of maximal 500 nL/min onto a C18-reversed phase column (15 cm long, 75 μm inner diameter, packed in-house with ReproSil-Pur C18-AQ 3 μm resin (Dr. Maisch)) in buffer A (0.5% acetic acid). Peptides were eluted with a multisegment linear gradient of 5–60% buffer B (80% ACN and 0.5% acetic acid) at a constant flow rate of 250 nL/min over 107 min. Mass spectra were acquired in the positive ion mode applying a data-dependent automatic switch between survey scan and tandem mass spectra (MS/MS) acquisition. A “top 10” method was applied that acquires one Orbitrap survey scan in the mass range of m/z 300–1650 followed by MS/MS of the ten most intense ions in the LTQ. The target value in the LTQ-Orbitrap was 1000000 for survey scan at a resolution of 60000 at m/z 400. Fragmentation in the LTQ was performed by collision-induced dissociation with a target value of 5000 ions. The ion selection threshold was 500 counts. Selected sequenced ions were dynamically excluded for 90 s.
Data Analysis
Raw mass spectrometric data were analyzed with the MaxQuant software (version 1.0.14.9).48,49 A false discovery rate (FDR) of 0.01 for proteins and peptides and a minimum peptide length of 6 amino acids were required. A time-dependent mass recalibration algorithm was used instead of lock masses for recalibration to improve the mass accuracy of precursor ions. MS/MS spectra were searched by Mascot (version 2.2.04, Matrix Science) against the IPI human database (version 3.62) (containing 83947 entries) combined with 262 common contaminants and concatenated with the reversed versions of all sequences. For the Mascot search trypsin allowing for cleavage N-terminal to proline was chosen as enzyme specificity. Cysteine carbamidomethylation was selected as a fixed modification, while protein N-terminal acetylation and methionine oxidation were selected as variable modifications. MaxQuant was used for scoring of the peptides for identification. It also determined the SILAC state of peptides by the mass differences between SILAC peptide pairs and this information was used to perform searches with fixed Arg6 and Lys4 or Arg10 and Lys8 modifications as appropriate. Maximally two missed cleavages and three labeled amino acids were allowed. Initial mass deviation of precursor ion was up to 7 ppm, mass deviation for fragment ions was 0.5 units on the m/z scale. Protein identification required two peptides one of which had to be unique to the protein group.
Quantification in MaxQuant was performed as described.48 The “Match between runs” option was selected, which enabled the transfer of identifications between the MS analysis of the same and the adjacent gel slices of all replicates and their quantification across the replicates. The “Requantify” option was enabled, which in effect integrates noise levels for undetected SILAC partners in order to estimate a lower bound on the SILAC ratio. Data analysis plots were either performed in the MaxQuant environment (Perseus) or in the R environment.50 The label swap of the control cell line to light SILAC label was additionally used to filter out nonassigned contaminants such as rare keratins not contained in the contaminant database (Suppl. Figure 4, Supporting Information). Gene Ontology (GO) analysis was performed with AMIGO.51 STRING 9.0 analyses on the detected interactomes retrieved known interactors (Suppl. Table 1, Supporting Information). Cytoscape52,53 was used to visualize APC and Axin-1 interactome overlap. All protein group files, containing the information of all protein pull-downs, are uploaded to TRANCHE (see instructions for supporting information).
Fluorescence Microscopy
HeLa cells stably expressing BACs with human GFP-tagged FAM73A were grown in 35 mm glass bottom dishes (MatTek). After staining cells with MitoTracker Red CM-H2XRos (Molecular Probes, Invitrogen) cells were imaged with a spinning-disk confocal microscope (TiLL iMIC CSU22; Andor) using a back-illuminated EM charge-coupled device camera (iXonEM 897; Andor) and a 60× 1.4 NA oil immersion objective (Olympus). Sixteen-bit images were collected using Image iQ (version 1.9; Andor) in the linear range of the camera. They were deconvoluted with Huygens Software and cropped with ImageJ (http://rsbweb.nih.gov/ij/).
Western Blot
Input material for affinity purifications (1/1000 of the protein lysate) was boiled with 5 μL LDS sample buffer (Invitrogen) for 5 min at 95 °C and separated on a 4–12% Novex mini-gel using MOPS buffer (Invitrogen). Proteins were transferred to a PVDF membrane in a wet chamber (Biorad) at 300 mA for 1.25 h. The membrane was blocked with PBST + 1% BSA for 1 h at room temperature and subsequently incubated with Anti- β-Tubulin antibody (1:20000) (Sigma) and Anti-β-catenin antibody (1:2000) (BD) in PBST + 1% BSA for 1 h at room temperature. The membrane was washed with PBST three times and subsequently incubated with HRP-anti-mouse (Amersham) (1:10000) in PBST + 1% BSA for 1 h at room temperature. The membrane was washed with PBST three times prior to detection with the ECL Western blotting detection reagent (Amersham) according to manufacturer’s instruction. Chemiluminescence screens (GE Healthcare) were used to visualize the band patterns.
Results and Discussion
Triple SILAC Enables Detection of Constitutive and Dynamic Interactions
We established QUBIC54 in a triple-encoding SILAC format to allow analysis of both constitutive and dynamic interactions of bait proteins that belong to diverse levels of canonical Wnt signaling under differential pathway activation. These encompassed APC and Axin-1 scaffold components of the destruction complex, DVL2, a mediator of the Wnt signal from the membrane to the destruction complex, as well as CtBP, a coregulator of Wnt target gene transcription.36−40 We chose a SILAC-based approach, because a precise quantification strategy was mandatory to resolve interaction dynamics. SILAC is known to allow highly accurate and reproducible quantification and to be superior of label-free quantification methods for complex and dynamic experiments where small fold-changes in binding are expected.
The cells expressing GFP-tagged protein were light (L) and medium (M) SILAC labeled, while the control cell line without BAC transgene was heavy (H) SILAC labeled (Figure 1A). The light labeled transgenic cells were stimulated with Wnt3a for two hours. Wnt stimulation was controlled by detection of β-catenin protein levels of the input material via Western blot (Suppl. Figure 1, Supporting Information). To prevent light to heavy or medium to heavy exchange of specific interaction partners during the immunopurification procedure,16,55 GFP pull-downs were performed separately for each SILAC condition and eluates were mixed afterward. For in-depth interactome characterization we reduced the sample complexity by one-dimensional gel separation into eight slices. Eluates were characterized at high sensitivity on the high-resolution LTQ-Orbitrap Velos instrument.56 Detected peptides can be classified according to their SILAC triplet peak patterns (Figure 1B). For unspecific background binders to either beads or GFP-antibody, this pattern shows no change between the three states (“one to one to one”). A specific interactor with the GFP-bait will have peptide ratios between the pull-down with the nonstimulated cell population and the untransfected control cell population (M/H ratio in this case) and/or between the stimulated cell population and the control (L/H ratio). A stimulus-dependent interactor has a significant ratio for the peptide intensity of the GFP-bait pull-down from the stimulated cell population compared to the GFP-bait pull-down from the nonstimulated cell population (L/M ratio).
Figure 1.


Analysis of interaction dynamics by QUBIC triple SILAC based quantitative mass spectrometry. (A) Experimental workflow for triple SILAC pull-downs to determine Wnt3a-dependent interaction dynamics. The cell line expressing the GFP-tagged protein of interest is light and medium SILAC labeled, the untransfected wild-type control cell line is heavy SILAC labeled. Cells are lysed after two hour treatment with Wnt3a (200 ng/mL) or vehicle solution respectively. GFP-pull-downs are performed separately for each SILAC state. Eluates are combined, separated on a one-dimensional gel into eight slices and in-gel digested. Resulting peptide mixtures are analyzed by high resolution LC-MS/MS on an LTQ-Orbitrap Velos. SILAC ratios are automatically quantified by MaxQuant. (B) SILAC peptide triplets representing peak profiles characteristic of background, constitutive and dynamic binders. (C) Data analysis plot of the ratio representing interaction specificity versus the ratio representing stimulus specificity of the interaction. Filled dots represent significant interactors and of these, constitutive interactors are depicted in blue. Dynamic interactors with enhanced binding to the bait protein are shown in red and those with reduced binding to the bait protein in green.
Via a two-dimensional plot proteins can be grouped into constitutive interactors and dynamic interactors according to the ratios of GFP-bait to control cells (here M/H) and GFP-bait with stimulus to GFP-bait without stimulus (L/M). Figure 1C illustrates this principle in cartoon form, with outliers in the positive x-direction (M/H) representing specific binding to the bait protein. This dimension contains the information of a standard SILAC interaction experiment. Plotting the ratio between stimulated and nonstimulated cell populations (L/M) on the y-axis adds the stimulus-dependent dimension. Outliers in the positive y-direction bind more strongly upon Wnt stimulus, whereas outliers in the negative direction selectively dissociate from the complex upon stimulation. The three main protein classes are therefore proteins that bind specifically to the bait but not in a signal-dependent manner (blue oval in Figure 1C), proteins that increase their binding upon stimulation (green oval) and proteins that decrease their binding (red oval).
While two of the three possible ratios of the triplets are in principle sufficient to represent the constitutive and stimulus-dependent aspects of interaction, in practice all three dimensions are often needed. This is because the third ratio can be more accurately determined directly rather than estimated from the other two. Furthermore, proteins that only bind specifically in one stimulus state are not optimally represented in the graph plotting the specificity ratio for the other state on the x-axis. They are only separated from background binding proteins in one dimension (positive outlier on the y-axis).
Heat maps turned out to be a very valuable additional visualization method, combining all the information from triple SILAC pull-downs into a single picture. This was particularly true for integrating the data from reverse labeling experiments (see below). To generate these heat maps, we placed all pull-down ratios between the triplet states on the horizontal axis and performed one-dimensional hierarchical clustering of the multiple ratios of each quantified prey protein in the vertical dimension.
We typically detected about 1200 proteins per pull-down experiment of which about 1100 proteins were quantified with at least two ratio counts. These large numbers reflect the single step purification procedure and our low stringency washing conditions. However, the quantitative information encoded in the SILAC ratios immediately excluded the vast majority of these proteins from consideration (typically more than 95% of all quantified proteins).
For each bait, experiments were repeated after swapping the SILAC labels between the control and the stimulated cell populations. This introduced an additional dimension of specificity and provided a minimum of two biological replicates. Because we required at least two peptides and two ratio counts, there was a minimum of four data points for quantitation per protein. “Forward” and “reverse” experiments together took 1.5 days of measurement time.
For an initial check of the results of our screen after filtering for significant and reproducible SILAC ratios, we inspected the interactomes of the different baits. These range in size from four to 28. According to STRING database analysis they contained 33–75% of already known interactors (Suppl. Table 1, Supporting Information), a high value considering the diversity of systems in which Wnt signaling has been studied.
APC is an Interaction Scaffold that is Altered by Wnt3a Stimulation
Adenomatous polyposis coli (APC) is a large (∼310 kDa) tumor suppressor protein that is mutated in most sporadic colorectal cancers in early tumorigenesis. Apart from its role in Wnt signaling as a member of the β-catenin destruction complex, APC is involved in various other cellular processes such as cell migration, cell division, transcriptional regulation and DNA repair.57 Consequently it has been reported to be localized in many different compartments of the cell, including the nucleus, mitochondria, mitotic spindle, centrosome, microtubules and the plasma membrane. Determination of interactors would help to further elucidate these diverse APC functions. Previous AP-MS of this protein has provided important information.41,42 However, systematic study of its interactions has been challenging due to its large size (necessitating the use of cDNA fragments instead of full-length cDNA) and to the difficulty in distinguishing specific from nonspecific proteins in the absence of quantitative methods.
We analyzed the Wnt3a stimulation-dependent and independent APC interactome with the triple SILAC strategy described above and show the results of one experiment in Figure 2A. More than 1000 quantified proteins are plotted according to their interaction specificity (x-axis) against their stimulus specificity (y-axis). Unassigned contaminants are not metabolically labeled and are therefore readily apparent by their pattern after the label-swapping experiment and were removed (Suppl. Figure 4, Supporting Information). A large majority of proteins cluster around the origin, indicating that they bound equally well in the presence or absence of the bait and stimulus. We extracted the fold-change distribution of the background binders (Suppl. Figure 2, Supporting Information) and determined significant outliers with box plot statistics (Suppl. Figure 3, Supporting Information). Many proteins are clearly separated from this background in the x-direction (specific interactors) but not in the stimulus-dependent dimension. These proteins cluster around the x-axis and are colored in blue. Eight proteins are in the upper right quadrant, indicating that they bound specifically to APC and that this binding was increased upon Wnt stimulation (colored in green). Conversely, there were nine proteins whose binding to APC decreased upon Wnt stimulation (colored in red, lower right quadrant). Interestingly, several proteins showed no specific binding to APC without stimulus at all but were recruited upon Wnt stimulation. As explained above, these proteins are more easily visualized when using the ratio of binding to GFP-APC with Wnt stimulation against control as the x-axis (Figure 2B). In that plot, APC binders that are recruited in a stimulus-dependent manner are located in the upper right quadrant (colored in green).
Figure 2.

Dynamic APC interactome. (A) Results from a triple SILAC pull-down as described in Figure 1 using Wnt3a as the stimulus and GFP-APC as bait protein, plotted as explained in Figure 1C. Annotated filled circles represent specific interactors determined by box plot statistics of the fold-change distribution of unstimulated pull-down against control. Specific dynamic interactors with enhanced binding to APC upon Wnt stimulation are depicted in green; the ones with decreased binding are depicted in red. Significance thresholds for dynamic changes were obtained from a box plot of fold-change distribution of stimulated pull-down against unstimulated pull-down. Constitutive, specific interactors are shown in blue. (B) Same experiment as in (A) but with the fold-change distribution of stimulated pull-down against control on the x-axis. In this plot dynamic interactors move to the upper right-hand quadrant as can be seen for the proteins shown in bold.
In total we performed four biological replicates, two of these with swaped heavy and light labels (Experimental Procedures). To statistically assess the biological reproducibility of the APC interactions, we employed a one sample t-test and separately plotted the median of all protein ratios from the four replicates in volcano plots for the cases without and with Wnt stimulation (Figure 3A and B). This revealed 28 reproducible APC interactors (p-value < 0.1 combined with a minimum ratio of 4). Inspecting the corresponding region in the left-hand side of the graph revealed no and one protein for the stimulated and unstimulated case, respectively (Figure 3), consistent with a false-positive rate of a few percent. Next, we created a heat map of the median ratios of all proteins (Suppl. Figure 6, Supporting Information). The 28 reproducible APC interactors clustered together in two subgroups (Figure 4). We also visualized the p-values determined from the t-tests as a heat map (Figure 4). Together, these two heat maps conveniently combine the information obtained from the replicate triple pull-down experiments.
Figure 3.

Volcano plot to determine reproducible APC interactors. (A) Log2 ratios of the median of four pull-downs of GFP-APC against control (x-axis) are plotted versus −log10 of the p-values derived from a t-test. Proteins with a minimum 4-fold change combined with a p-value smaller than 0.1 are considered significant (red lines). (B) Same as (A) but for simulated pull-downs against controls.
Figure 4.

Dynamic APC interactome visualized by a heat map and one-way hierarchical clustering. The three ratios of the triple SILAC pull-down (median of four experiments) are used to cluster the reproducible APC interactors (determined in Figure 3) by one-way hierarchical clustering. A green color value signifies specific binding to APC without Wnt stimulation (first column) or with Wnt stimulation (second column) in the heat map. The third column depicts the SILAC ratio of stimulated against unstimulated bait pull-down. In this column, a green color value represents enhanced binding to APC upon Wnt activation and a red color represents reduced binding. Constitutive interactors have no significant ratio and therefore appear in black. All ratio intensities are shown in log scale. Note that only those parts of the cluster that contain significant binders are depicted. Refer to Suppl. Figure 6 for the complete clustering (Supporting Information). Additionally, t-test results for the ratio reproducibility (Figure 3) were visualized in the right panel after the clustering process. Proteins with reproducible ratios (p-value < 0.1) are in blue and those above the threshold in yellow. KIFC3 does not meet the significance criteria for specific and reproducible APC binding (minimum ratio of 4 and p-value < 0.1) both without and with stimulus and is therefore greyed out in the figure.
Our APC interactome includes well-known binders such as β-catenin and the transcription regulator CtBP2. It covers proteins with GO cellular component annotation of all described APC localizations (Suppl. Table 1, Supporting Information). For example, the novel APC interactor Cep170 localizes to the centrosome58 and another novel interactor, the kinesin family member KIF2A, localizes to microtubules.59 The novel protein FAM73A had no known compartmental localization. Microscopy of a GFP-BAC line of this protein showed costaining with mitochondrial outer membranes (Suppl. Figure 5, Supporting Information).
Significant APC binders also include Axin-1, CKI-α and Wtx, the known binding partners of APC in the cytoplasmic β-catenin destruction complex. This complex is usually thought to partly disassemble upon Wnt stimulation, although evidence against this has also been reported.60 Interestingly, in our triple SILAC experiments, we did not detect dynamic APC interaction changes for members of this complex upon Wnt pathway activation with Wnt3a, at least not after two hours of stimulation.
While most specific interactors showed stimulus-independent binding to APC, we also identified dynamic interaction changes upon Wnt3a activation (Figures 2 and 4) such as the enhanced binding of APC to β-catenin. Since the major mechanism of Wnt activation is stabilization of β-catenin leading to its accumulation, this could simply be the result of more available β-catenin. We likewise observed increased binding of α-catenin to APC. α-Catenin is reported to indirectly associate with APC via β-catenin,61 these three proteins contact each other at microtubule ends.62 Cytosolic complexes of α- and β-catenin have also been described.63 Thus dynamic α-catenin binding to APC is most likely due to its association with increased levels of β-catenin. Furthermore, APC binds β-catenin not only within the destruction complex but also in the nucleus to enhance β-catenin nuclear export in the non-Wnt activated cell.64
Additional dynamic interactors of APC with increased binding upon Wnt3a stimulation included ATAD3A and ATAD3B. These paralogs have been reported to be localized in mitochondria, but they expose a cytosolic AAA domain.65,66 ERBB2-interacting protein (Erbin) is a novel interactor, which potentially links APC and ERBB2 signaling. Furthermore, there is evidence that Erbin binds to β-catenin and negatively regulates Wnt induced gene expression.67,68
We identified Girdin as a novel APC interactor that exclusively binds upon Wnt3a activation (compare Figure 2 A and B). Girdin is a known substrate and regulator of Akt signaling.69 Furthermore, Girdin is a paralog of Daple, which has been reported to interact with the central Wnt signal mediator DVL, through its Gly-Cys-Val C-terminal motif.69 Interestingly, however, Girdin does not have this motif and therefore at least it must bind DVL in a different manner.
In the nucleus APC competes with the transcription factor TCF for β-catenin and the APC- β-catenin complex is then thought to bind CtBP2.70 The APC-β-catenin-CtBP2 complex reduces the pool of β-catenin that can bind to TCF factors and thereby represses Wnt-dependent gene expression. The transcriptional regulator CtBP2 displays the exact opposite APC binding dynamics to Girdin. Upon Wnt3a activation, this protein is released from its association with APC. Colorectal cell lines with truncated APC have diminished binding of APC to CtBP2,70 which therefore contributes to increased expression of Wnt target genes. Our observation that the APC-CtBP2 interaction is lost upon Wnt activation demonstrates that the truncation of APC is mechanistically equivalent to stimulation by the Wnt ligand in abolishing CtBP2 binding to the C-terminal part of APC.
Our APC interactome also contained WDR26 and MAEA, whose binding was diminished upon pathway activation. These proteins had previously been found in an Axin-1 interaction screen.41 Because APC and Axin-1 each have important roles in the destruction complex, binders to both proteins are more likely to also have Wnt-related functions. This motivated us to investigate if more APC interactors might be linked to Wnt signaling in the same way. We therefore performed dynamic interaction screens for other Wnt signaling components with the aim of integrating their interactomes.
Dynamic Axin-1 Interactome Reveals Shared APC and Axin-1 Interactors Linking Them to Wnt Signaling
We determined dynamic Axin-1 interactors by triple SILAC pull-downs with and without two hour Wnt3a activation (Figure 1A). Experiments were done in biological duplicates with swapped SILAC labeling (Suppl. Table 1 and Suppl. Figure 7, Supporting Information). We required a minimum ratio of four for significant interactors, which was determined from box plot statistics. Results are summarized in Figure 5A in the heat map format. In total we identified 18 specific Axin-1 interactors that were present in both duplicates. We extensively cover β-catenin destruction complex component members such as APC, CKI-α, Wtx, GSK-3β and PP2A, all of which turned out to bind constitutively to Axin-1, in agreement with a recent report.60 Additionally, we found moderately increased Axin-1 interaction of SKP1 and β-TrCP2. Both of these proteins are members of the ubiquitin ligase complex that targets β-catenin for proteasomal degradation.71 CDK1δ is known to phosphorylate and activate DVL after Wnt3a activation72,73 and our data show that its binding to Axin-1 does not depend on Wnt activation. Rho GTPase activating protein 21 (RhoGAP21) was reported as a β-catenin interactor on the basis of TAP pull-downs41 and as α-catenin interactor that is required for α-catenin recruitment to adherens junctions.74 We identify this protein as a dynamic interactor to Axin-1, whose binding is markedly enhanced by Wnt activation. Further supporting its role in Wnt signaling is the observation that RhoGAP21 is also a dynamic interactor of APC (Suppl. Table 2, Supporting Information). However, because of our stringent identification criteria it only appears in the final Axin-1 and not the APC interactome results.
Figure 5.

(A) Dynamic Axin-1, (B) CtBP2 and (C) DVL2 interactomes. Heat map and one-way hierarchical clustering of SILAC ratios from biological duplicates of triple SILAC experiments performed with label swap (FWD and REV experiment). Only those parts of the cluster with significant ratio intensities are depicted. Proteins that do not fulfilling the significance criteria of reproducible detection with a minimum ratio of 4 in the forward and reverse pull-down for at least one stimulus state were greyed out. For color coding of the heat map see Figure 4. All ratio intensities are shown in log scale.
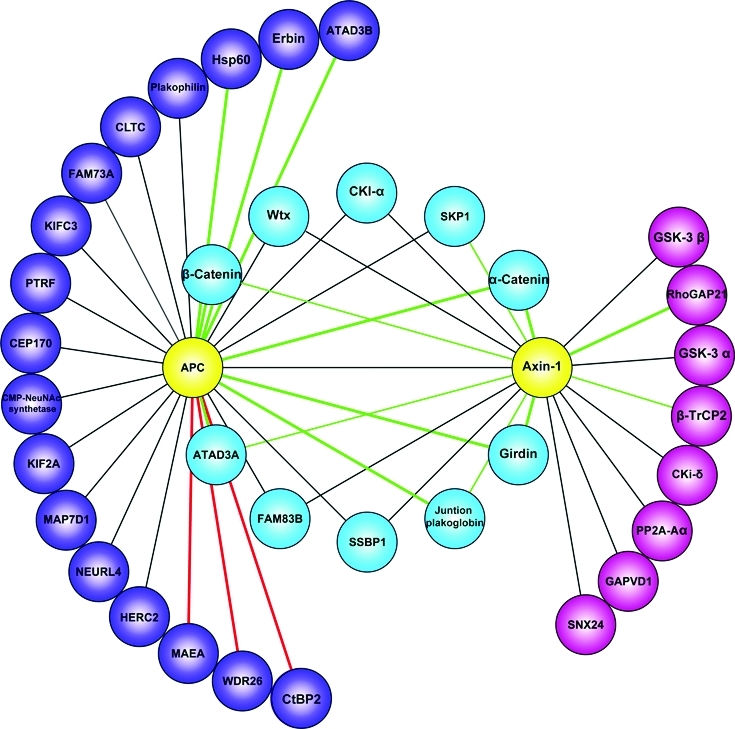
Comparing the Axin-1 and APC interactomes revealed ten shared interactors (Figure 6). Remarkably, the interaction dynamics of each shared component with either of these proteins was highly similar, which suggests that they interact with an APC-Axin-1 complex. Among the shared interactors are the known destruction complex members CKI-α and Wtx as well as the ubiquitin ligase component SKP1. We detect enhanced binding of β-catenin to APC and Axin-1, which as noted above may partly reflect β-catenin accumulation upon stimulation. Moreover a complex of these three proteins has been reported to localize at the membrane after Wnt3a activation.75 The interaction of Axin-1 with α-catenin was greatly enhanced by Wnt3a stimulation, similar to its binding to APC. Intriguingly Girdin is also a highly significant dynamic interactor of Axin-1 and APC upon Wnt3a activation. The novel protein FAM83B interacts constitutively with both Axin-1 and APC like other destruction complex members (and may therefore be a novel member) and is very likely involved in Wnt signaling.
Figure 6.

Overlap of APC and Axin-1 interactomes. Protein-protein interactions were drawn in Cytoscape, after importing the pull-down data from Figures 4 and 5A. Baits are depicted in yellow, shared APC and Axin-1 interactors in blue and unique interactors for APC and Axin-1 in purple and pink, respectively. Lines represent detected interactions. Green lines indicate enhanced interaction upon Wnt3a activation while red lines indicate reduced interactions upon Wnt3a activation. Line width reflects the SILAC ratio intensity for the dynamic interactors.
DVL2 Interactome Reveals Constitutive Binding of Girdin Independent of Wnt Activation
Disheveled (DVL) proteins are important Wnt signal mediators that counteract destruction complex action upon Wnt3a stimulation. The exact mechanism by which the Wnt signal is transduced–including the complex formation at the membrane, which involves phosphorylated DVL–is still not fully understood.38 Furthermore, DVL proteins integrate different branches of Wnt signaling including the planar cell polarity (PCP) pathway. Triple SILAC DVL2 pull-downs covered known DVL2 binder such as DVL3 and the positive Wnt regulator CKI-ε.76 The negative Wnt PCP regulator Vang-like protein 1/Strabismus 277,78 was also a significant interactor of DVL2. None of the 10 identified interactions were modulated by the Wnt signal (Figure 5B, Suppl. Figure 8, Supporting Information). Among the newly discovered interactors, we found the three members of the BTB/POZ domain-containing protein family KCTD10/KCTD13/TNFAIP1.79 We detect Girdin as a novel and specific interactor for DVL2. In contrast to its dynamically increased binding to APC and Axin-1 upon Wnt3a stimulation, Girdin binds constitutively to DVL2.
CtBP2 Binds to β-Catenin in a Nonstimulus-Dependent Manner
We determined the dynamic CtBP2 interactome to characterize a potentially dynamic nuclear regulator of Wnt signaling. We detected 4 specific interactors of CtBP2 but none of them with significant stimulus-dependent changes (Figure 5C, Suppl. Figure 8, Supporting Information). Among these was β-catenin, which is known to interact with CtBP2 as well as with APC to repress transcription of Wnt target genes (see also above). Upon Wnt stimulation β-catenin interacts with CtBP2 and TCF to contribute to transcriptional activation.80 Our observation that the β-catenin–CtBP2 interaction is not dynamically regulated by Wnt, agrees with suggestions that these two proteins function in both repression70 and activation of gene expression.80
Conclusion and Outlook
Here we have described a three-state quantitative proteomics approach to study the dynamics of protein-protein interactions. We used the SILAC technology because of its simplicity and accuracy of quantification when coupled to a high resolution mass spectrometric readout. Proteins were expressed as GFP fusions from bacterial artificial chromosomes that had been integrated into the host cell genome, ensuring close to endogenous expression levels, correct modification state and compartmentalization of the bait proteins. This is especially important for studying a signaling pathway such as Wnt, in which the regulation of protein amount is critical and in which the signal propagates through different cellular locations. The approach described here is generic as BAC-GFP cell lines can be produced in a streamlined procedure.27 We employed one-dimensional gel separation using somewhat more material (four 15 cm dishes per condition) than in single run analyses.23 Analysis of the results was more complex than double-labeling SILAC because three states are compared. However, these analysis steps have now been incorporated into the freely available MaxQuant environment or as R-scripts. Consequently, dynamic analysis of interaction partners is relatively streamlined and it can now be used routinely for pathways of interest or as a follow up on initial high-throughput protein interaction screens.
There are several obvious extensions of the workflow described here. For example, dynamic interaction measurements can be repeated at different time points to investigate the changing composition of signaling complexes over time. In this experiment the three SILAC states can each represent different time points because the specificity of the binders has already been established.
Here we have applied the QUBIC triple SILAC dynamic interaction screen to the challenging case of Wnt signaling. We performed pull-downs on central members of the pathway from the destruction complex and from other different pathway levels. The SILAC ratios efficiently filtered out nonspecific binders, reducing an initial set of about 1000 identified proteins to a relatively small number (10–50). These proteins contained many positive controls that were either known interaction partners or that already had some other connection to Wnt signaling. Among the novel interaction partners those shared by APC and Axin-1 are most likely to be functional members of the Wnt pathway. Interestingly, almost all of these interaction partners turned out to have similar interaction dynamics, consistent with a role in a shared complex with APC and Axin-1. Other dynamic interaction partners of APC or Axin-1 are also good candidates for functional roles in this pathway by virtue of their Wnt-dependent interaction modulation.
One example is Girdin (CCDC88A), which we separately found as a novel interactor of APC, Axin-1 and Disheveled 2 (DVL2). Intriguingly, interaction with APC and Axin-1 are contingent on Wnt-stimulation, whereas interaction with DVL2 is not. This raises the possibility that Girdin and DVL2 are in a preformed complex, which may then recruit destruction complex members to the membrane receptors upon Wnt pathway stimulation. In this context, we observed that interaction of APC and Axin-1 with other destruction complex members did not change upon Wnt3a activation. This finding sheds some light on the unresolved mechanism of destruction complex dynamics at the plasma membrane. In concordance with recent observations,60 our data is consistent with a potential translocation of a relatively intact destruction complex, at least after two hours of Wnt stimulation.
In conclusion, we have described a streamlined interaction screen, which accurately discriminates constitutive from dynamic, signal-dependent interactions. In contrast to targeted techniques, such as Western blotting, it can both discover and characterize such dynamic interactors in the same experiment.
Acknowledgments
We thank Bianca Splettstoesser and Anja Wehner for technical help and Markus Räschle and Nina C. Hubner for critical reading of the manuscript and helpful discussions. Juergen Cox advised on the data analysis. Natalie Krahmer from the group of Organelle Architecture and Dynamics helped with the microscopy. We also thank Ina Poser and Anthony A. Hyman from the Max Planck Institute of Molecular Cell Biology and Genetics for kindly providing the GFP-tagged cell lines. This work was supported by Munich Center for Integrated Protein Science (CIPSM) and by European Commission’s seventh Framework Program PROteomics SPECification in Time and Space (PROSPECTS, HEALTH-F4-2008-021648).
Glossary
Abbreviations
- AP-MS
affinity purification coupled with mass spectrometry
- BAC
bacterial artificial chromosome
- FDR
false discovery rate
- GFP
green fluorescent protein
- GO
Gene Ontology
- LTQ
linear trap quadrupole
- QUBIC
quantitative BAC interactomics
- SILAC
stable isotope labeling by amino acids in cell culture
- TAP
tandem affinity purification
Supporting Information Available
Suppl. Figures 1-8 and Suppl. Tables 1 and 2. This material is available free of charge via the Internet at http://pubs.acs.org. Link to Suppl. Data at TRANCHE: https://proteomecommons.org/tranche/, using the following hash: lGMv8OB/574FanvAfNNlAaB7Iuksi91OAYRdyGfV6bqLqfUD/v6/ZGiiG/GniA7caNksWmUwR7PJrve6Yd9xo9pmwzgAAAAAAAADLg== and the passphrase:1 MaxiTriple SILAC.
Author Present Address
‡ Pharma Research and Early Development, Roche Diagnostics GmbH, Nonnenwald 2, D-82372 Penzberg, Germany
Supplementary Material
References
- Gingras A. C.; Gstaiger M.; Raught B.; Aebersold R. Analysis of protein complexes using mass spectrometry. Nat. Rev.: Mol. Cell Biol. 2007, 8 (8), 645–54. [DOI] [PubMed] [Google Scholar]
- Rigaut G.; Shevchenko A.; Rutz B.; Wilm M.; Mann M.; Seraphin B. A generic protein purification method for protein complex characterization and proteome exploration. Nat. Biotechnol. 1999, 17 (10), 1030–2. [DOI] [PubMed] [Google Scholar]
- Ranish J. A.; Yi E. C.; Leslie D. M.; Purvine S. O.; Goodlett D. R.; Eng J.; Aebersold R. The study of macromolecular complexes by quantitative proteomics. Nat. Genetics 2003, 33 (3), 349–55. [DOI] [PubMed] [Google Scholar]
- Blagoev B.; Kratchmarova I.; Ong S. E.; Nielsen M.; Foster L. J.; Mann M. A proteomics strategy to elucidate functional protein-protein interactions applied to EGF signaling. Nat. Biotechnol. 2003, 21 (3), 315–8. [DOI] [PubMed] [Google Scholar]
- Vermeulen M.; Hubner N. C.; Mann M. High confidence determination of specific protein-protein interactions using quantitative mass spectrometry. Curr. Opin. Biotechnol. 2008, 19 (4), 331–7. [DOI] [PubMed] [Google Scholar]
- Trinkle-Mulcahy L.; Andersen J.; Lam Y. W.; Moorhead G.; Mann M.; Lamond A. I. Repo-Man recruits PP1 gamma to chromatin and is essential for cell viability. J. Cell Biol. 2006, 172 (5), 679–92. [DOI] [PMC free article] [PubMed] [Google Scholar]
- Gavin A. C.; Aloy P.; Grandi P.; Krause R.; Boesche M.; Marzioch M.; Rau C.; Jensen L. J.; Bastuck S.; Dumpelfeld B.; Edelmann A.; Heurtier M. A.; Hoffman V.; Hoefert C.; Klein K.; Hudak M.; Michon A. M.; Schelder M.; Schirle M.; Remor M.; Rudi T.; Hooper S.; Bauer A.; Bouwmeester T.; Casari G.; Drewes G.; Neubauer G.; Rick J. M.; Kuster B.; Bork P.; Russell R. B.; Superti-Furga G. Proteome survey reveals modularity of the yeast cell machinery. Nature 2006, 440 (7084), 631–6. [DOI] [PubMed] [Google Scholar]
- Kocher T.; Superti-Furga G. Mass spectrometry-based functional proteomics: from molecular machines to protein networks. Nat. Methods 2007, 4 (10), 807–15. [DOI] [PubMed] [Google Scholar]
- Sowa M. E.; Bennett E. J.; Gygi S. P.; Harper J. W. Defining the human deubiquitinating enzyme interaction landscape. Cell 2009, 138 (2), 389–403. [DOI] [PMC free article] [PubMed] [Google Scholar]
- Wepf A.; Glatter T.; Schmidt A.; Aebersold R.; Gstaiger M. Quantitative interaction proteomics using mass spectrometry. Nat. Methods 2009, 6 (3), 203–5. [DOI] [PubMed] [Google Scholar]
- Mak A. B.; Ni Z.; Hewel J. A; Chen G. I.; Zhong G.; Karamboulas K.; Blakely K.; Smiley S.; Marcon E.; Roudeva D.; Li J.; Olsen J. B.; Punna T.; Isserlin R.; Chetyrkin S.; Gingras A. C.; Emili A.; Greenblatt J; Moffat J.. A lentiviral-based functional proteomics approach identifies chromatin remodelling complexes important for the induction of pluripotency. Mol. Cell. Proteomics 2010, in press. [DOI] [PMC free article] [PubMed]
- Paul F. E.; Hosp F.; Selbach M. Analyzing protein-protein interactions by quantitative mass spectrometry. Methods 2011, 54 (4), 387–95. [DOI] [PubMed] [Google Scholar]
- Paoletti A. C.; Parmely T. J.; Tomomori-Sato C.; Sato S.; Zhu D.; Conaway R. C.; Conaway J. W.; Florens L.; Washburn M. P. Quantitative proteomic analysis of distinct mammalian Mediator complexes using normalized spectral abundance factors. Proc. Natl. Acad. Sci. U.S.A. 2006, 103 (50), 18928–33. [DOI] [PMC free article] [PubMed] [Google Scholar]
- Rinner O.; Mueller L. N.; Hubalek M.; Muller M.; Gstaiger M.; Aebersold R. An integrated mass spectrometric and computational framework for the analysis of protein interaction networks. Nat. Biotechnol. 2007, 25 (3), 345–52. [DOI] [PubMed] [Google Scholar]
- Wang T.; Gu S.; Ronni T.; Du Y. C.; Chen X. In vivo dual-tagging proteomic approach in studying signaling pathways in immune response. J. Proteome Res. 2005, 4 (3), 941–9. [DOI] [PubMed] [Google Scholar]
- Mousson F.; Kolkman A.; Pijnappel W. W.; Timmers H. T.; Heck A. J. Quantitative proteomics reveals regulation of dynamic components within TATA-binding protein (TBP) transcription complexes. Mol. Cell. Proteomics 2008, 7 (5), 845–52. [DOI] [PubMed] [Google Scholar]
- Bantscheff M.; Eberhard D.; Abraham Y.; Bastuck S.; Boesche M.; Hobson S.; Mathieson T.; Perrin J.; Raida M.; Rau C.; Reader V.; Sweetman G.; Bauer A.; Bouwmeester T.; Hopf C.; Kruse U.; Neubauer G.; Ramsden N.; Rick J.; Kuster B.; Drewes G. Quantitative chemical proteomics reveals mechanisms of action of clinical ABL kinase inhibitors. Nat. Biotechnol. 2007, 25 (9), 1035–44. [DOI] [PubMed] [Google Scholar]
- Selbach M.; Mann M. Protein interaction screening by quantitative immunoprecipitation combined with knockdown (QUICK). Nat. Methods 2006, 3 (12), 981–3. [DOI] [PubMed] [Google Scholar]
- Selbach M.; Paul F. E.; Brandt S.; Guye P.; Daumke O.; Backert S.; Dehio C.; Mann M. Host cell interactome of tyrosine-phosphorylated bacterial proteins. Cell Host Microbe 2009, 5 (4), 397–403. [DOI] [PubMed] [Google Scholar]
- Vermeulen M.; Eberl H. C.; Matarese F.; Marks H.; Denissov S.; Butter F.; Lee K. K.; Olsen J. V.; Hyman A. A.; Stunnenberg H. G.; Mann M. Quantitative interaction proteomics and genome-wide profiling of epigenetic histone marks and their readers. Cell 2010, 142 (6), 967–80. [DOI] [PubMed] [Google Scholar]
- Breitkreutz A.; Choi H.; Sharom J. R.; Boucher L.; Neduva V.; Larsen B.; Lin Z. Y.; Breitkreutz B. J.; Stark C.; Liu G.; Ahn J.; Dewar-Darch D.; Reguly T.; Tang X.; Almeida R.; Qin Z. S.; Pawson T.; Gingras A. C.; Nesvizhskii A. I.; Tyers M. A global protein kinase and phosphatase interaction network in yeast. Science 2010, 328 (5981), 1043–6. [DOI] [PMC free article] [PubMed] [Google Scholar]
- Choi H.; Larsen B.; Lin Z. Y.; Breitkreutz A.; Mellacheruvu D.; Fermin D.; Qin Z. S.; Tyers M.; Gingras A. C.; Nesvizhskii A. I. SAINT: probabilistic scoring of affinity purification-mass spectrometry data. Nature Methods 2011, 8 (1), 70–3. [DOI] [PMC free article] [PubMed] [Google Scholar]
- Hubner N. C.; Bird A. W.; Cox J.; Splettstoesser B.; Bandilla P.; Poser I.; Hyman A.; Mann M.. Quantitative proteomics combined with BAC TransgeneOmics reveals in-vivo protein interactions. J. Cell Biol. 2010, in press. [DOI] [PMC free article] [PubMed]
- Zhang Y.; Buchholz F.; Muyrers J. P.; Stewart A. F. A new logic for DNA engineering using recombination in Escherichia coli. Nat. Genet. 1998, 20 (2), 123–8. [DOI] [PubMed] [Google Scholar]
- Kittler R.; Pelletier L.; Ma C.; Poser I.; Fischer S.; Hyman A. A.; Buchholz F. RNA interference rescue by bacterial artificial chromosome transgenesis in mammalian tissue culture cells. Proc. Natl. Acad. Sci. U.S.A. 2005, 102 (7), 2396–401. [DOI] [PMC free article] [PubMed] [Google Scholar]
- Sarov M.; Schneider S.; Pozniakovski A.; Roguev A.; Ernst S.; Zhang Y.; Hyman A. A.; Stewart A. F. A recombineering pipeline for functional genomics applied to Caenorhabditis elegans. Nat. Methods 2006, 3 (10), 839–44. [DOI] [PubMed] [Google Scholar]
- Poser I.; Sarov M.; Hutchins J. R.; Heriche J. K.; Toyoda Y.; Pozniakovsky A.; Weigl D.; Nitzsche A.; Hegemann B.; Bird A. W.; Pelletier L.; Kittler R.; Hua S.; Naumann R.; Augsburg M.; Sykora M. M.; Hofemeister H.; Zhang Y.; Nasmyth K.; White K. P.; Dietzel S.; Mechtler K.; Durbin R.; Stewart A. F.; Peters J. M.; Buchholz F.; Hyman A. A. BAC TransgeneOmics: a high-throughput method for exploration of protein function in mammals. Nat. Methods 2008, 5 (5), 409–15. [DOI] [PMC free article] [PubMed] [Google Scholar]
- Charbonnier S.; Gallego O.; Gavin A. C. The social network of a cell: recent advances in interactome mapping. Biotechnol. Annu. Rev. 2008, 14, 1–28. [DOI] [PubMed] [Google Scholar]
- Ong S. E.; Blagoev B.; Kratchmarova I.; Kristensen D. B.; Steen H.; Pandey A.; Mann M. Stable isotope labeling by amino acids in cell culture, SILAC, as a simple and accurate approach to expression proteomics. Mol. Cell. Proteomics 2002, 1 (5), 376–86. [DOI] [PubMed] [Google Scholar]
- Mann M. Functional and quantitative proteomics using SILAC. Nat. Rev. Mol. Cell. Biol. 2006, 7 (12), 952–8. [DOI] [PubMed] [Google Scholar]
- Blagoev B.; Ong S. E.; Kratchmarova I.; Mann M. Temporal analysis of phosphotyrosine-dependent signaling networks by quantitative proteomics. Nat. Biotechnol. 2004, 22 (9), 1139–45. [DOI] [PubMed] [Google Scholar]
- Andersen J. S.; Lam Y. W.; Leung A. K.; Ong S. E.; Lyon C. E.; Lamond A. I.; Mann M. Nucleolar proteome dynamics. Nature 2005, 433 (7021), 77–83. [DOI] [PubMed] [Google Scholar]
- Olsen J. V.; Blagoev B.; Gnad F.; Macek B.; Kumar C.; Mortensen P.; Mann M. Global, in vivo, and site-specific phosphorylation dynamics in signaling networks. Cell 2006, 127 (3), 635–48. [DOI] [PubMed] [Google Scholar]
- Trinkle-Mulcahy L.; Boulon S.; Lam Y. W.; Urcia R.; Boisvert F. M.; Vandermoere F.; Morrice N. A.; Swift S.; Rothbauer U.; Leonhardt H.; Lamond A. Identifying specific protein interaction partners using quantitative mass spectrometry and bead proteomes. J. Cell Biol. 2008, 183 (2), 223–39. [DOI] [PMC free article] [PubMed] [Google Scholar]
- Boulon S.; Ahmad Y.; Trinkle-Mulcahy L.; Verheggen C.; Cobley A.; Gregor P.; Bertrand E.; Whitehorn M.; Lamond A. I.. Establishment of a protein frequency library and its application in the reliable identification of specific protein interaction partners. Mol. Cell. Proteomics 2009, not supplied. [DOI] [PMC free article] [PubMed]
- Clevers H. Wnt/beta-catenin signaling in development and disease. Cell 2006, 127 (3), 469–80. [DOI] [PubMed] [Google Scholar]
- Klaus A.; Birchmeier W. Wnt signalling and its impact on development and cancer. Nat. Rev. Cancer 2008, 8 (5), 387–98. [DOI] [PubMed] [Google Scholar]
- Angers S.; Moon R. T. Proximal events in Wnt signal transduction. Nat. Rev. 2009, 10 (7), 468–77. [DOI] [PubMed] [Google Scholar]
- MacDonald B. T.; Tamai K.; He X. Wnt/beta-catenin signaling: components, mechanisms, and diseases. Developmental Cell 2009, 17 (1), 9–26. [DOI] [PMC free article] [PubMed] [Google Scholar]
- van Amerongen R.; Nusse R. Towards an integrated view of Wnt signaling in development. Development 2009, 136 (19), 3205–14. [DOI] [PubMed] [Google Scholar]
- Major M. B.; Camp N. D.; Berndt J. D.; Yi X.; Goldenberg S. J.; Hubbert C.; Biechele T. L.; Gingras A. C.; Zheng N.; Maccoss M. J.; Angers S.; Moon R. T. Wilms tumor suppressor WTX negatively regulates WNT/beta-catenin signaling. Science 2007, 316 (5827), 1043–6. [DOI] [PubMed] [Google Scholar]
- Major M. B.; Roberts B. S.; Berndt J. D.; Marine S.; Anastas J.; Chung N.; Ferrer M.; Yi X.; Stoick-Cooper C. L.; von Haller P. D.; Kategaya L.; Chien A.; Angers S.; MacCoss M.; Cleary M. A.; Arthur W. T.; Moon R. T. New regulators of Wnt/beta-catenin signaling revealed by integrative molecular screening. Sci. Signal. 2008, 1 (45), ra12. [DOI] [PubMed] [Google Scholar]
- Sue Ng, S.; Mahmoudi T.; Li V. S.; Hatzis P.; Boersema P. J.; Mohammed S.; Heck A. J.; Clevers H. MAP3K1 functionally interacts with Axin1 in the canonical Wnt signalling pathway. Biol. Chem. 2010, 391 (2–3), 171–80. [DOI] [PubMed] [Google Scholar]
- Shevchenko A.; Wilm M.; Vorm O.; Mann M. Mass spectrometric sequencing of proteins silver-stained polyacrylamide gels. Anal. Chem. 1996, 68 (5), 850–8. [DOI] [PubMed] [Google Scholar]
- Shevchenko A.; Tomas H.; Havlis J.; Olsen J. V.; Mann M. In-gel digestion for mass spectrometric characterization of proteins and proteomes. Nat. Protoc. 2006, 1 (6), 2856–60. [DOI] [PubMed] [Google Scholar]
- Rappsilber J.; Ishihama Y.; Mann M. Stop and go extraction tips for matrix-assisted laser desorption/ionization, nanoelectrospray, and LC/MS sample pretreatment in proteomics. Anal. Chem. 2003, 75 (3), 663–70. [DOI] [PubMed] [Google Scholar]
- Rappsilber J.; Mann M.; Ishihama Y. Protocol for micro-purification, enrichment, pre-fractionation and storage of peptides for proteomics using StageTips. Nat. Protoc. 2007, 2 (8), 1896–906. [DOI] [PubMed] [Google Scholar]
- Cox J.; Mann M. MaxQuant enables high peptide identification rates, individualized p.p.b.-range mass accuracies and proteome-wide protein quantification. Nat. Biotechnol. 2008, 26 (12), 1367–72. [DOI] [PubMed] [Google Scholar]
- Cox J.; Matic I.; Hilger M.; Nagaraj N.; Selbach M.; Olsen J. V.; Mann M. A practical guide to the MaxQuant computational platform for SILAC-based quantitative proteomics. Nat. Protoc. 2009, 4 (5), 698–705. [DOI] [PubMed] [Google Scholar]
- Team R. D. C.R: a language and environment for statistical computing; R Foundation for Statistical Computing: Vienna, Austria, 2008. [Google Scholar]
- Carbon S.; Ireland A.; Mungall C. J.; Shu S.; Marshall B.; Lewis S. AmiGO: online access to ontology and annotation data. Bioinformatics 2009, 25 (2), 288–9. [DOI] [PMC free article] [PubMed] [Google Scholar]
- Cline M. S.; Smoot M.; Cerami E.; Kuchinsky A.; Landys N.; Workman C.; Christmas R.; Avila-Campilo I.; Creech M.; Gross B.; Hanspers K.; Isserlin R.; Kelley R.; Killcoyne S.; Lotia S.; Maere S.; Morris J.; Ono K.; Pavlovic V.; Pico A. R.; Vailaya A.; Wang P. L.; Adler A.; Conklin B. R.; Hood L.; Kuiper M.; Sander C.; Schmulevich I.; Schwikowski B.; Warner G. J.; Ideker T.; Bader G. D. Integration of biological networks and gene expression data using Cytoscape. Nat. Protoc. 2007, 2 (10), 2366–82. [DOI] [PMC free article] [PubMed] [Google Scholar]
- Shannon P.; Markiel A.; Ozier O.; Baliga N. S.; Wang J. T.; Ramage D.; Amin N.; Schwikowski B.; Ideker T. Cytoscape: a software environment for integrated models of biomolecular interaction networks. Genome Res. 2003, 13 (11), 2498–504. [DOI] [PMC free article] [PubMed] [Google Scholar]
- Hubner N. C.; Bird A. W.; Cox J.; Splettstoesser B.; Bandilla P.; Poser I.; Hyman A.; Mann M. Quantitative proteomics combined with BAC TransgeneOmics reveals in vivo protein interactions. J. Cell Biol. 2010, 189 (4), 739–54. [DOI] [PMC free article] [PubMed] [Google Scholar]
- Wang X.; Huang L. Identifying dynamic interactors of protein complexes by quantitative mass spectrometry. Mol. Cell. Proteomics 2008, 7 (1), 46–57. [DOI] [PubMed] [Google Scholar]
- Olsen J. V.; Schwartz J. C.; Griep-Raming J.; Nielsen M. L.; Damoc E.; Denisov E.; Lange O.; Remes P.; Taylor D.; Splendore M.; Wouters E. R.; Senko M.; Makarov A.; Mann M.; Horning S. A dual pressure linear ion trap orbitrap instrument with very high sequencing speed. Mol. Cell. Proteomics 2009, 8 (12), 2759–69. [DOI] [PMC free article] [PubMed] [Google Scholar]
- Brocardo M.; Henderson B. R. APC shuttling to the membrane, nucleus and beyond. Trends Cell Biol. 2008, 18 (12), 587–96. [DOI] [PubMed] [Google Scholar]
- Guarguaglini G.; Duncan P. I.; Stierhof Y. D.; Holmstrom T.; Duensing S.; Nigg E. A. The forkhead-associated domain protein Cep170 interacts with Polo-like kinase 1 and serves as a marker for mature centrioles. Mol. Biol. Cell 2005, 16 (3), 1095–107. [DOI] [PMC free article] [PubMed] [Google Scholar]
- Ganem N. J.; Compton D. A. The KinI kinesin Kif2a is required for bipolar spindle assembly through a functional relationship with MCAK. J. Cell Biol. 2004, 166 (4), 473–8. [DOI] [PMC free article] [PubMed] [Google Scholar]
- Yokoyama N.; Yin D.; Malbon C. C. Abundance, complexation, and trafficking of Wnt/beta-catenin signaling elements in response to Wnt3a. J. Mol. Signal. 2007, 2, 11. [DOI] [PMC free article] [PubMed] [Google Scholar]
- Rubinfeld B.; Souza B.; Albert I.; Munemitsu S.; Polakis P. The APC protein and E-cadherin form similar but independent complexes with alpha-catenin, beta-catenin, and plakoglobin. J. Biol. Chem. 1995, 270 (10), 5549–55. [DOI] [PubMed] [Google Scholar]
- Harris T. J.; Peifer M. Decisions, decisions: beta-catenin chooses between adhesion and transcription. Trends Cell Biol. 2005, 15 (5), 234–7. [DOI] [PubMed] [Google Scholar]
- Bienz M. beta-Catenin: a pivot between cell adhesion and Wnt signalling. Curr. Biol. 2005, 15 (2), R64–7. [DOI] [PubMed] [Google Scholar]
- Henderson B. R. Nuclear-cytoplasmic shuttling of APC regulates beta-catenin subcellular localization and turnover. Nat. Cell Biol. 2000, 2 (9), 653–60. [DOI] [PubMed] [Google Scholar]
- Bogenhagen D. F.; Rousseau D.; Burke S. The layered structure of human mitochondrial DNA nucleoids. J. Biol. Chem. 2008, 283 (6), 3665–75. [DOI] [PubMed] [Google Scholar]
- He J.; Mao C. C.; Reyes A.; Sembongi H.; Di Re M.; Granycome C.; Clippingdale A. B.; Fearnley I. M.; Harbour M.; Robinson A. J.; Reichelt S.; Spelbrink J. N.; Walker J. E.; Holt I. J. The AAA+ protein ATAD3 has displacement loop binding properties and is involved in mitochondrial nucleoid organization. J. Cell Biol. 2007, 176 (2), 141–6. [DOI] [PMC free article] [PubMed] [Google Scholar]
- Ress A.; Moelling K. The PDZ protein erbin modulates beta-catenin-dependent transcription. Eur. Surg. Res. 2008, 41 (3), 284–9. [DOI] [PubMed] [Google Scholar]
- Ress A.; Moelling K. Interaction partners of the PDZ domain of erbin. Protein Peptide Lett. 2006, 13 (9), 877–81. [DOI] [PubMed] [Google Scholar]
- Enomoto A.; Ping J.; Takahashi M. Girdin, a novel actin-binding protein, and its family of proteins possess versatile functions in the Akt and Wnt signaling pathways. Ann. N.Y. Acad. Sci. 2006, 1086, 169–84. [DOI] [PubMed] [Google Scholar]
- Hamada F.; Bienz M. The APC tumor suppressor binds to C-terminal binding protein to divert nuclear beta-catenin from TCF. Develop. Cell 2004, 7 (5), 677–85. [DOI] [PubMed] [Google Scholar]
- Liu C.; Kato Y.; Zhang Z.; Do V. M.; Yankner B. A.; He X. beta-Trcp couples beta-catenin phosphorylation-degradation and regulates Xenopus axis formation. Proc. Natl. Acad. Sci. U.S.A. 1999, 96 (11), 6273–8. [DOI] [PMC free article] [PubMed] [Google Scholar]
- Bryja V.; Schulte G.; Arenas E. Wnt-3a utilizes a novel low dose and rapid pathway that does not require casein kinase 1-mediated phosphorylation of Dvl to activate beta-catenin. Cell. Signal. 2007, 19 (3), 610–6. [DOI] [PubMed] [Google Scholar]
- Peters J. M.; McKay R. M.; McKay J. P.; Graff J. M. Casein kinase I transduces Wnt signals. Nature 1999, 401 (6751), 345–50. [DOI] [PubMed] [Google Scholar]
- Sousa S.; Cabanes D.; Archambaud C.; Colland F.; Lemichez E.; Popoff M.; Boisson-Dupuis S.; Gouin E.; Lecuit M.; Legrain P.; Cossart P. ARHGAP10 is necessary for alpha-catenin recruitment at adherens junctions and for Listeria invasion. Nat. Cell Biol. 2005, 7 (10), 954–60. [DOI] [PubMed] [Google Scholar]
- Hendriksen J.; Jansen M.; Brown C. M.; van der Velde H.; van Ham M.; Galjart N.; Offerhaus G. J.; Fagotto F.; Fornerod M. Plasma membrane recruitment of dephosphorylated beta-catenin upon activation of the Wnt pathway. J. Cell Sci. 2008, 121 (Pt 11), 1793–802. [DOI] [PubMed] [Google Scholar]
- Sakanaka C.; Leong P.; Xu L.; Harrison S. D.; Williams L. T. Casein kinase iepsilon in the wnt pathway: regulation of beta-catenin function. Proc. Natl. Acad. Sci. U.S.A. 1999, 96 (22), 12548–52. [DOI] [PMC free article] [PubMed] [Google Scholar]
- Park M.; Moon R. T. The planar cell-polarity gene stbm regulates cell behaviour and cell fate in vertebrate embryos. Nat. Cell Biol. 2002, 4 (1), 20–5. [DOI] [PubMed] [Google Scholar]
- Angers S.; Thorpe C. J.; Biechele T. L.; Goldenberg S. J.; Zheng N.; MacCoss M. J.; Moon R. T. The KLHL12-Cullin-3 ubiquitin ligase negatively regulates the Wnt-beta-catenin pathway by targeting Dishevelled for degradation. Nat. Cell Biol. 2006, 8 (4), 348–57. [DOI] [PubMed] [Google Scholar]
- Van Bogaert P.; Azizieh R.; Desir J.; Aeby A.; De Meirleir L.; Laes J. F.; Christiaens F.; Abramowicz M. J. Mutation of a potassium channel-related gene in progressive myoclonic epilepsy. Ann. Neurol. 2007, 61 (6), 579–86. [DOI] [PubMed] [Google Scholar]
- Fang M.; Li J.; Blauwkamp T.; Bhambhani C.; Campbell N.; Cadigan K. M. C-terminal-binding protein directly activates and represses Wnt transcriptional targets in Drosophila. EMBO J. 2006, 25 (12), 2735–45. [DOI] [PMC free article] [PubMed] [Google Scholar]
Associated Data
This section collects any data citations, data availability statements, or supplementary materials included in this article.