Abstract
The equilibrium folding of the catalytic domain of Bacillus subtilis RNase P RNA is investigated by single-molecule fluorescence resonance energy transfer (FRET). Previous ensemble studies of this 255-nucleotide ribozyme described the equilibrium folding with two transitions, U-to-Ieq-to-N, and focused on the Ieq-to-N transition. The present study focuses on the U-to-Ieq transition. Comparative ensemble measurements of the ribozyme construct labeled with fluorescein at the 5′ end and Cy3 at the 3′ end show that modifications required for labeling do not interfere with folding and help to define the Mg2+ concentration range for the U-to-Ieq transition. Histogram analysis of the Mg2+-dependent single-molecule FRET efficiency reveals two previously undetermined folding intermediates. The single-molecule FRET trajectories exhibit non-two-state and nonergodic behaviors at intermediate Mg2+ concentrations on the time scale of seconds. The trajectories at intermediate Mg2+ concentrations are classified into five classes based on three FRET levels and their dynamics of interconversion within the measured time range. This heterogeneity, together with the observation of “nonsudden jump” FRET transitions, indicates that the early folding steps of this ribozyme involve a series of intermediates with different degrees of kinetic isolation and that folding occurs under kinetic control and involves many “local” conformational switches. A free energy contour is constructed to illustrate the complex folding surface.
The relationship between primary sequence and 3D structure is a fundamental issue in macromolecular folding (1, 2). Compared with the two-state folding behavior generally seen with small proteins (3, 4), RNA folding often involves metastable intermediates (5–9). This difference is attributed, in part, to the weakness of the protein interactions relative to the nucleic acid interactions, such as base pairing and stacking. Therefore, the free energy landscape for RNA folding is punctuated with deeper basins with populated folding intermediates (10–12). These intermediates can be populated under equilibrium, governed by thermodynamic (solvent and temperature) conditions, or transiently populated during nonequilibrium folding (13).
The catalytic domain (C-domain) of Bacillus subtilis P RNA is a good model system to address RNA folding because it folds without kinetic traps and is large enough to exhibit the folding phenomenology of large RNAs (14). A minimalist folding pathway, derived from ensemble experiments performed as a function of Mg2+ concentration, includes an unfolded state (U), a populated intermediate state (Ieq), and a native state (N). Ieq is the thermodynamic reference state that establishes the stability of N; it represents the most populated species preceding N. The U-to-Ieq transition, occurring at Mg2+ concentrations ≈10-fold lower than that required for the Ieq-to-N transition, has been proposed to consist of multiple transitions that were not resolved in ensemble measurements (14). Elucidation of the structural and dynamic characteristics of these intermediates is crucial for understanding the folding of large RNA in general.
Single-molecule measurements look beyond ensemble averages to obtain novel and complementary information, as first demonstrated for ion channels (15). With rapidly advancing fluorescence detection and microscopy capabilities, single-molecule studies are expanding to address questions related to structure and function in many biological systems, including enzymes (16), molecular motors (17, 18), transcription (19, 20), and protein and RNA dynamics (21–24). Fluorescence resonance energy transfer (FRET) measurements have been used to track the conformational changes of single RNA or protein molecules, identify intermediates in RNA folding, and examine RNA–protein interactions (25–29).
The objective of the present single-molecule FRET study is to further elucidate the U-to-Ieq transition in the equilibrium folding of the C-domain of P RNA. Folding intermediates are revealed by investigating the single-molecule FRET efficiency (EFRET) distributions as a function of Mg2+ concentration. Single-molecule FRET trajectories are collected and analyzed to study the dynamics and further resolve the folding of intermediate states. The trajectories show considerable variation over the range of equilibrium folding conditions explored (0–5 mM Mg2+ at 18 ± 1°C). Analysis allows construction of a minimalist set of Mg2+-dependent free energy basins, which illustrate states and connectivities relevant to folding.
Materials and Methods
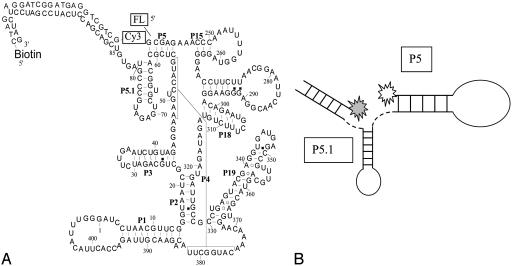
Sample Preparation. The FRET construct is shown in Fig. 1A. The 5′ end of the C-domain was labeled with fluorescein (donor) by in vitro transcription with ≈20% efficiency. It is technically difficult to purify the 5′-labeled C-domain RNA from nonlabeled RNA. However, the acceptor-only-labeled RNA with direct excitation of Cy3 is effectively discriminated from the double-labeled RNA with the acquisition routine. To incorporate the FRET acceptor and biotin, the latter for immobilization to a streptavidin-coated coverslip (30), the 3′ end of the C-domain was extended by 24 nucleotides. The extension was then hybridized with a complementary DNA oligonucleotide covalently linked with biotin and Cy3 at its 5′ and 3′ ends. The hybridization efficiency was verified to be >90% by nondenaturing gel electrophoresis. The specificity of the avidin–biotinylated RNA attachment was verified to be better than 200:1. Surface-bound single molecules were kept in a flow chamber so that buffer conditions could be changed readily. The base buffer for all experiments was 10 mM Tris·HCl (pH 8)/50 mM NaCl.
Fig. 1.
(A) The secondary structure of C-domain P RNA with fluorescein–Cy3 as the FRET pair and biotinylated DNA tether for surface immobilization. (B) Schematics of three possible conformational changes sampled by single-molecule FRET experiments. Change 1 involves motions in a single-stranded region that is unlikely to be affected by Mg2+. Change 2 is a shift in the orientation of the duplexes P5 and P5.1, and change 3 represents the formation of a tertiary contact found in the native structure.
Ensemble Measurements. Ensemble fluorescence measurements were performed with a fluorimeter (RF-5301PC, Shimadzu) using a 488-nm excitation. Ensemble CD measurements were performed with a Jasco 715 CD/absorption spectrometer interfaced with a titrator (Hamilton) (31). Catalytic-activity measurements (32) were carried out by using the C-domain FRET construct shown in Fig. 1A.
Single-Molecule Measurements. Single-molecule fluorescence excitation and detection were achieved with the 488-nm line of an Ar+ laser (532-R, Melles Griot, Irvine, CA) and a high-numerical-aperture (1.4) confocal microscope (×60 magnification; Olympus, Melville, NY), based on a Zeiss Axiovert S100. The apparatus has two avalanche photodiode detectors (SPCM-AQR-15, EG & G, Salem, MA) and a 3D nano–piezo stage (E710 PI). Donor and acceptor fluorescence emissions were defined with bandpass filters (500–550 and 585–635, Chroma Technology, Brattleboro, VT) after color separation with a dichroic mirror (DC560, Chroma Technology) and collected simultaneously with a single-photon counting board (SPC600, Becker Hickel, Berlin). The coverslips were raster-scanned at 5 ms per defined pixel (50 × 50-nm increments) until a 200 × 200-pixel image was obtained. The background threshold and positions of the single molecules were determined by a gradient search of the image, allowing automated collection of FRET trajectories with a labview (National Instruments, Austin, TX) routine. The 20 μW/μm2 laser intensity gave adequate counting statistics in a 5-ms acquisition window and minimized photobleaching.
Results
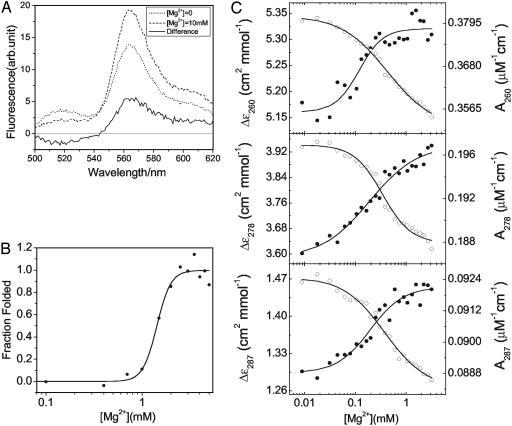
Ensemble Studies. Ensemble Mg2+ titration experiments are performed on the FRET construct of Fig. 1 to (i) establish whether the FRET labeling scheme interferes with ribozyme folding, (ii) verify the Mg2+ concentration range associated with early stages of folding, and (iii) provide results to compare with the single-molecule experiments. Donor-only ensemble experiments (i.e., with the DNA oligonucleotide but without Cy3) show no change in the fluorescence signal in the range of [Mg2+] = 0–1 mM (data not shown). This insensitivity is likely due to the presence of 50 mM NaCl in the base buffer, whereas the quantum yield for fluorescein does exhibit a Mg2+ dependence in the absence of Na+ (32). Because the Förster transfer distance, R0 = 5.3 nm, for the fluorescein–Cy3 pair lies within the range of the hydrodynamic radii of the C-domain (≈4 nm for folded structures to ≈18 nm for unfolded structures) (33), the EFRET should exhibit a strong dependence on folding, assuming that the appropriate sites are labeled. The fluorescein-emission decrease shown in Fig. 2A is accompanied by an increase in Cy3 emission on changing [Mg2+] from 0 mM (U) to 10 mM (N). This finding verifies that the FRET signature is sensitive to Mg2+-induced conformational changes of the ribozyme. The considerable Cy3 “background” emission is primarily due to an excessive amount of Cy3-labeled oligonucleotide added to optimize the hybridization reaction. In single-molecule experiments the fluorescence from direct excitation of individual Cy3 is effectively rejected with the acquisition described in Materials and Methods.
Fig. 2.
(A) Ensemble fluorescence measurement of the FRET construct at [Mg2+] = 0 mM (dotted line), [Mg2+] = 10 mM (dashed line), and the differential (solid line). (B) Fraction of folded RNA monitored by catalytic activity. The transition to N occurs with a Mg2+ midpoint of 1.5 mM and a Hill constant of 6. (C) Equilibrium folding monitored by CD (•) and UV absorbance (○).
The 3′ extension and its complementary DNA oligonucleotide do not interfere greatly with the C-domain folding to its catalytically active native structure (Fig. 2B). The Mg2+ midpoint, where 50% of the ribozymes show catalytic activity (KMg ≈ 1.5 mM), is almost identical to the value for the C-domain that lacks the 3′ extension and DNA oligonucleotide (≈1.3 mM) (32). The Hill constant, n, of the folding transition of the construct is, however, larger than that of the C-domain that lacks both the 3′ extension and DNA oligonucleotide; n increases from 3 to 6 ± 2. The larger Hill constant of the ribozyme construct is likely to result from a shift in the thermodynamic reference state on the addition of the 3′ extension and its complementary DNA oligonucleotide (34). These results establish that the Ieq-to-N transition occurs at [Mg2+] = 1.5 mM and that, therefore, the U-to-Ieq transition occurs below that concentration.
The CD and UV absorbance measurements shown in Fig. 2C indicate that at least one early folding transition occurs between [Mg2+] = 0.1 and 1 mM. Fitting the 260-, 278-, and 287-nm data with a three-state model gives KMg values of 0.1–0.4 mM for the U-to-Ieq transition and values of 1–2 for the corresponding Hill constant. The fact that the CD and UV data at 260, 278, and 287 nm give different KMg and Hill values suggests that multiple intermediate species may be populated between [Mg2+] = 0.1 and 1 mM. The KMg for Ieq-to-N is difficult to identify because of the very small change in the CD and UV signals in the [Mg2+] = 1 to 5 mM range. However, the activity assay clearly places this transition at 1.5 mM.
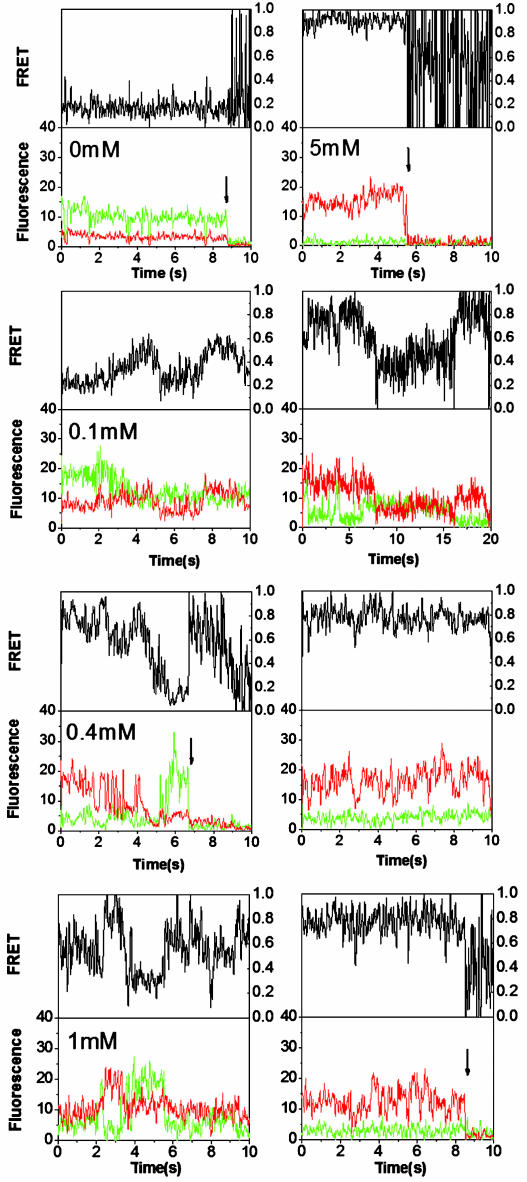
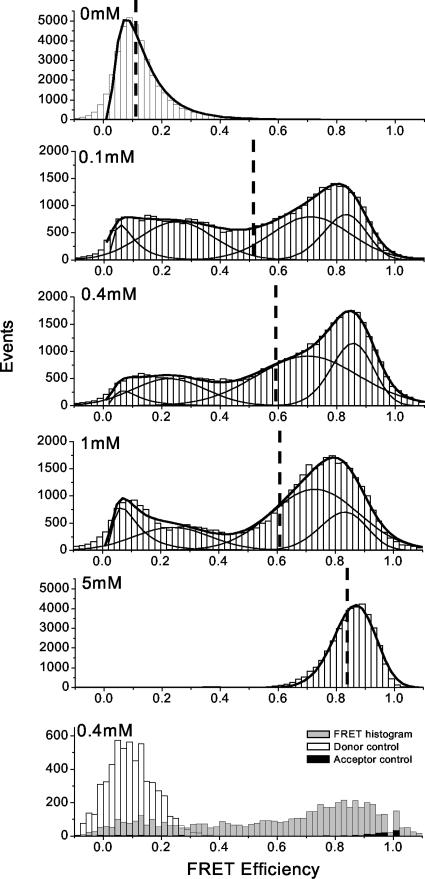
Single-Molecule Trajectories and FRET Histograms. The results of single-molecule measurements performed at five Mg2+ concentrations are summarized in Fig. 3. Donor (green) and acceptor (red) trajectories from individual molecules are plotted in the lower half of each panel. Corresponding EFRET trajectories, defined as EFRET = IA/(IA + ID), have been corrected for crosstalk. The observed crosstalk could be different for each single molecule because of environmental differences. For the present experiments and chosen optical filters, it is estimated to be 10% on average. FRET histograms are evaluated from the first second (200 time points) of each FRET trajectory before photobleaching occurs; 30–80 FRET trajectories are recorded at each Mg2+ concentration. The resulting histograms at both [Mg2+] = 0 and 5 mM, shown in Fig. 4, are narrowly distributed and peaked near EFRET = 0.1 and EFRET = 0.85, respectively. These results define the FRET signature for U and N. The asymmetric shape of both distributions, except for the out-of-range values (<0 or >1) resulting from correction for background emission and crosstalk, are well fit as log-normal distributions (27). The dashed vertical lines indicate that the average EFRET, 〈EFRET〉, increases with Mg2+ concentration from 0 to 5 mM, implying an increase in the population of more compact states.
Fig. 3.
Representative single-molecule donor, acceptor, and FRET trajectories, defined by IA/(IA + ID), at various [Mg2+] values; IA and ID represent intensity of acceptor and donor, respectively. The donor and acceptor trajectories are corrected for background emission, including the removal of 10% donor-to-acceptor crosstalk. Photobleaching events of either donor or acceptor are indicated by arrows.
Fig. 4.
Single-molecule FRET histograms are derived from 30–80 FRET trajectories by using the first 200 time points of each FRET trajectory at each [Mg2+]. Log-normal and Gaussian fits of the distributions with four population states are indicated by solid lines. The mean FRET values that correspond to each of the five histograms from [Mg2+] = 0 to 5 mM are 0.13, 0.53, 0.59, 0.60, and 0.85, respectively. The numbers of molecules are 21, 29, 85, 31, and 26, in order from top to bottom. The last histogram shows the comparison among the FRET experiment, donor-only control, and acceptor-only control at [Mg2+] = 0.4 mM, as generated from single-molecule images.
Several control experiments ensure that the observed signal changes derive from RNA conformational change and compaction. When the same DNA oligonucleotide without Cy3 is used with fluorescein-labeled RNA or the same RNA without the fluorescein is used with Cy3-labeled DNA oligonucleotide, neither ensemble nor single-molecule fluorescence signals depend on the Mg2+ concentration (data not shown). The bottom histogram of Fig. 4 shows a direct comparison between the single fluorophore- and double fluorophore-containing constructs at Mg2+ = 0.4 mM. The dramatic difference demonstrates that the observed change is derived completely from double fluorophore-containing RNA molecules.
Fig. 4 shows that the FRET distributions become much broader and multimodal at intermediate [Mg2+] (0.1–1 mM). The simplest fit consists of four states: two log-normal and two Gaussian fits of the distributions. The two peaks with mean FRET values of ≈0.3 and ≈0.7 represent at least two folding intermediates that are distinct from U and N. The 〈EFRET〉 in this Mg2+ concentration regime increases slightly from 0.53 at [Mg2+] = 0.1 mM to 0.59 at both [Mg2+] = 0.4 and 1 mM. The shapes and positions of the distributions from [Mg2+] = 0.1 to 1 mM are very similar, suggesting that these intermediates are extensively populated.
Another finding is that even at [Mg2+] = 0.1 mM, at which the N population is undetectable (see Fig. 2B), a significant fraction of the molecules exhibit FRET values similar to the FRET values exhibited by molecules of the N population (i.e., >0.8). This high signal correlates well with the ensemble data; that is, Ieq can form at [Mg2+] < 1 mM, and it adopts a conformation with all secondary structure, and some tertiary structure is formed (14). Although the present single-molecule FRET measurements do not discriminate well between Ieq and N, the rich and nontrivial evolution of the FRET distributions in Fig. 4 discloses new intermediates within the U-to-Ieq transition.
Single-Molecule Dynamics and Nonergodic Behavior. In Fig. 4, all single molecules at each Mg2+ concentration are analyzed together without regard to their dynamic patterns. However, the FRET trajectories exhibit complex (i.e., multilevel) fluctuations among the intermediates identified in Fig. 4 and, therefore, reflect conformational dynamics of individual molecules. Unlike two-state systems, in which FRET trajectories fluctuate between two distinct levels in a “binary” series (35), the present histogram and trajectory results reflect more complicated behavior. The histogram distributions constructed from different bin widths are invariant with respect to <100-ms dynamics; Fig. 4 is based on 5-ms binning, but the same basic shape is obtained from 50-ms binning. All trajectories at [Mg2+] = 0 and 5 mM exhibit constant values (with shot noise), suggesting that no significant conformational switches occur under thermodynamic conditions that strongly favor unfolded or folded ribozyme structures. By contrast, the FRET trajectories at [Mg2+] = 0.1 to 1 mM exhibit much greater variation. Although some traces exhibit anticorrelation between donor and acceptor channels, others do not fluctuate at all on the 10-s time scale before bleaching (Fig. 3). Furthermore, for most trajectories at intermediate Mg2+ concentrations, the amount of fluctuation exceeds the shot noise, suggesting that there are at least two types of processes involved: major conformational changes among intermediates and minor conformational fluctuations within a specific state. Moreover, the FRET transitions often do not occur in a “sudden jump” fashion, similar to the folding of large proteins (24). These factors make dwell-time analysis difficult to implement simply because the trajectories can fluctuate among FRET values that correspond to at least four states (Fig. 4).
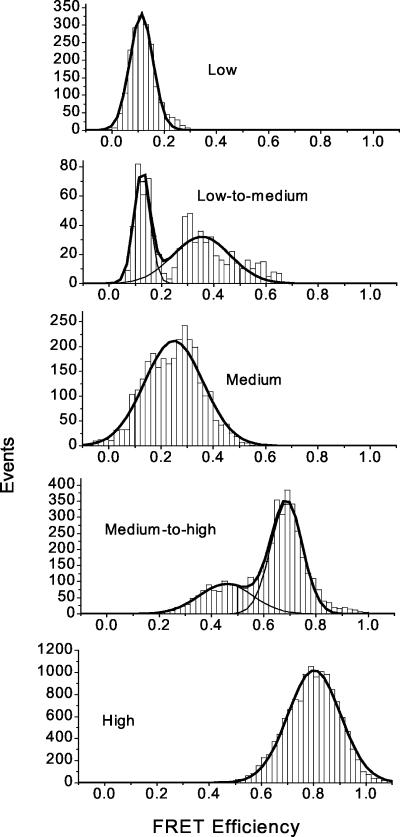
Therefore, a robust and minimalist analysis of the time trajectories in Fig. 3 is implemented. The whole FRET range is divided into three levels: low (≤0.2), medium (0.2–0.8), and high (≥0.8). Each single-molecule FRET trajectory is then classified as fluctuating (i.e., at least one conversion among the three levels) or nonfluctuating (i.e., those that do not undergo a conversion among the three FRET levels during the measurement time but may fluctuate within one FRET level). By using this description, a total of five subpopulations are found: three nonfluctuating classes corresponding to low, medium, and high FRET levels, and two dynamic classes with either low-to-medium or medium-to-high FRET fluctuations. Direct low-to-high FRET fluctuation is very rare. Molecules with low-to-medium and medium-to-high fluctuations are observed to be mutually exclusive within the 10-s time frame before bleaching occurs. This finding suggests that most molecules maintain a particular dynamic pattern for the time of the measurement. More ergodic behavior, however, may be achieved on longer time scales.
The FRET values obtained in each 5-ms bin width are histogrammed in the class to which each trajectory belongs; the results for [Mg2+] = 1 mM are plotted in Fig. 5. There are three stationary classes (first, third, and last histograms), and two dynamic classes (second and fourth histograms). The degree of FRET overlap between the stationary classes and their adjacent dynamic classes can be considerable. The histogram is robust on extension of the sampling time window to as high as 5 s (1,000 time points), suggesting that the classification scheme of the five subpopulations correctly reflects the kinetic heterogeneity of the whole ensemble. This dynamical heterogeneity is further verified when the variance of each FRET trajectory is plotted against its mean value (data not shown). The molecules at [Mg2+] = 0 and 5 mM have the lowest variance, whereas at intermediate Mg2+ concentrations, the variance of the trajectories well exceeds the shot-noise level.
Fig. 5.
FRET histograms of single C-domain molecules at [Mg2+] = 1 mM. Each histogram represents a particular class of molecules defined by its dynamic pattern. A transition/fluctuation between any two FRET levels is defined to occur whenever FRET values of one class hop into another class and stay there for >50 ms (to distinguish from occasional transitions due to the shot noise seen on the 5-ms time scale). Shot noise is the reason why the distribution of any stationary/nonfluctuating class exceeds its defined range. Percentages of the total population of 31 molecules are as follows: low, ≈8%; medium, 13%; high, 57%; low-to-medium, 4%; and medium-to-high, 18%.
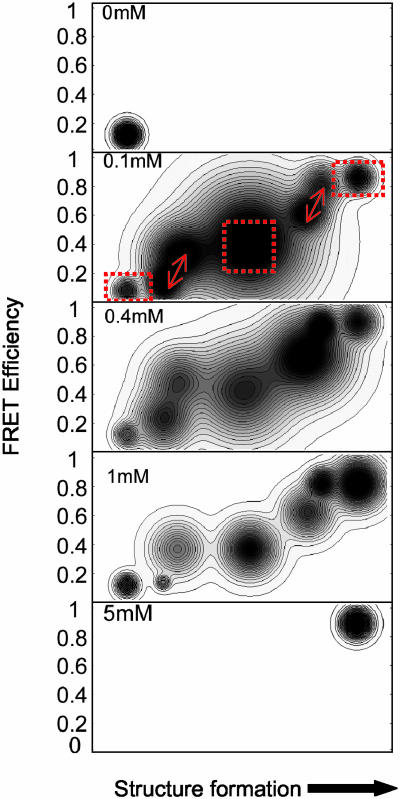
Folding Free Energy Surface. The free energy surface representation is a powerful tool for elucidating RNA folding pathways. Folding may proceed along channels or funnels in the free energy surface (26, 36). In the present case, the set of trajectories at every Mg2+ concentration provides information about conformations and structures, dynamics, and the number of molecules, hence probability, in each class. A 2D energy contour plot can be generated based on the previous five subpopulation classifications. For simplicity, each of the five classes at a given Mg2+ concentration is represented with a Gaussian peak function:
 |
[1] |
where F is the free energy corresponding to any conformational state defined by the FRET axis for a particular set of parameters, A, 〈EFRET〉, and σ. 〈EFRET〉 and σ are the mean FRET values and full-width half maximum for each of the histograms in Fig. 5, for [Mg2+] = 0.1 mM, and for all analogous histograms at other Mg2+ concentrations. The preexponential factor, –A/(σ√π/2), the maximal depth of the peak function, is proportional to the logarithm of the area under each of the probability distributions in Fig. 5.
The energy landscape for the whole ensemble at each Mg2+ concentration is the overlay of all peak functions. To visualize the energy landscapes better, one more axis that reflects the fraction of the formed folded structure is introduced, which helps to show the kinetic connectivities. The resulting 3D energy landscape representation is
 |
[2] |
Symmetric 2D Gaussian distributions are assumed for simplicity, where the index i refers to the specific distribution analogous to the distribution shown in Fig. 5. The proximity of the basins and, hence, the barriers separating them are adjusted along the x axis to qualitatively reflect the interconversions or lack thereof. The “degree of structure” label is supported by the correlation between the change in single-molecule FRET and the change in ensemble CD and activity data. Although Xi is an adjustable value, it seems reasonable that two basins with similar structures would interconvert more rapidly.
Fig. 6 is the resultant free energy surface. The molecules are confined to the low FRET (U) basin at [Mg2+] = 0 mM, whereas at [Mg2+] = 0.1 to 1 mM, new basins emerge and their relative depths (i.e., free energies) change; the populations equilibrate among them, with the high FRET basin corresponding to Ieq. At [Mg2+] = 5 mM, the basin associated with the N emerges as the deepest well. The surfaces at [Mg2+] = 0.1, 0.4, and 1 mM contain seven basins, the minimum that is necessary to describe the dynamics. In the case of [Mg2+] = 0.1 mM, the three nonfluctuating classes are reflected by three isolated basins and the two fluctuating classes are reflected by two pairs of closely connected basins. The shape of the surface evolves considerably as a function of [Mg2+], including shifts of the energetically favored basins, the width of each basin, and the kinetic isolation of each basin. Thus, these contour profiles give a more complete account of the intermediates that exist between U and Ieq.
Fig. 6.
Free energy contour plots for [Mg2+] = 0, 0.1, 0.4, 1, and 5 mM for 3′ to 5′ end proximity. EFRET is the y axis, and structure formation is the x axis. The dotted red boxes for [Mg2+] = 0.1 mM highlight three nonfluctuating classes with EFRET = 0–0.2, 0.3–0.5, and 0.8–1, corresponding to distances of >6.3, 6.3–4.2, and <4.2 nm for the FRET pair, which assumes free rotational diffusion, consistent with ensemble data. The two fluctuating classes, reflected by two pairs of closely connected basins, are indicated by arrows at EFRET = 0–0.2 and 0.2–0.4 and at EFRET = 0.5–0.7 and 0.7–0.9. These two pairs of basins correspond to low-to-medium and medium-to-high FRET conversion, respectively.
Discussion and Conclusions
Complex inter- and intra-class dynamics are observed for the equilibrium conformational fluctuations of the C-domain of P RNA. The nonergodic behavior presumably results from the large size of the C-domain (an ≈80-kDa molecule) and the distribution of secondary and tertiary structural motifs. Subpopulations undergo different structural interconversions on the seconds time scale.
The sometimes slow conformational transitions observed here contrast with the more commonly observed sudden jump transitions. However, slow transitions have been observed recently for the folding of a large (214-aa) protein (24). This finding could reflect a fundamental difference in the multistate folding of large molecules; the structural transitions among basins involve a complex series of “local” conformational changes that may not occur cooperatively. Therefore, folding transitions are more accurately described as being under kinetic, instead of thermodynamic, control.
Kinetic heterogeneity has been invoked previously to explain large RNA folding. A kinetically isolated early folding intermediate has been inferred in ensemble studies of the entire P RNA molecule (37). Folding occurs under kinetic control for a circularly permutated construct where the C-domain is connected by a single phosphodiester bond to the specificity domain (38). Folding is faster and follows a distinct pathway when initiated from Mg2+-free compared with submillimolar preequilibrium conditions. In the latter case, preexisting secondary structures influence pathway selection resulting in the formation of a kinetically trapped intermediate, whereas folding from the Mg2+-free condition indicates that formation of native tertiary structure outpaces the formation of the trap-producing secondary structures. Different initial conditions also have a major impact on the folding behavior of the Tetrahymena group I intron (26, 39). The folding surface has been characterized as having channels and a multidimensional landscape (36), whose topography also involves an interplay and timing between secondary and tertiary structure. Because our base buffer contains 50 mM Na+, it is likely that most secondary structures already exist for [Mg2+] = 0 mM (40). Kinetic heterogeneity may arise from the slow interconversion between the native and non-native secondary structures.
Furthermore, a slow rate of equilibrium conformational fluctuations is not entirely unanticipated for the C-domain folding. Although the results from our previous ensemble folding kinetics study would support rapid FRET and conformational changes without Na+, the slow conversion for the present single-molecule equilibrium study in the presence of Na+ is consistent with the notion of folding channels that exhibit differential starting positions (26). In the latter case, folding would require some (most) molecules to seek the channels along the increasing Mg2+ concentration axis that lead to N. Na+-induced pathway selection may necessitate conformational switching from one channel into another and, hence, would require climbing over an energetic barrier and would be much slower.
Although the present two-point correlation (3′ and 5′ ends) FRET measurement is not equally sensitive to all of the conformational space, three major structural changes can alter the distance of the FRET pair (Fig. 1B). The first change involves the conformation of single-stranded nucleotides 81–85 and, hence, is unlikely to depend on the Mg2+ concentration. The second change involves the conformation of the adjacent helices P5 and P5.1. The third change involves the conformation of the P5.1 loop that forms tertiary contacts with the P15.1 loop (41). The Mg2+-dependent FRET variation is almost certain to result from the latter two types of structural changes. FRET experiments with a donor fluorophore located elsewhere in the C-domain may possibly yield information on the other conformational changes associated with folding.
Acknowledgments
We thank Dr. Philippe Cluzel for helpful discussions and the reviewers for insightful comments. This work was supported by National Institutes of Health Grants GM5788001 and GM067961, a fellowship from the Burroughs Wellcome Interfaces Training Grant (to Z.X.), and the Institute for Biophysical Dynamics Seed Fund.
Abbreviations: FRET, fluorescence resonance energy transfer; C-domain, catalytic domain; U, unfolded state; Ieq, populated intermediate state; N, native state.
References
- 1.Chan, H. S. & Dill, K. A. (1994) J. Chem. Phys. 100, 9238–9257. [Google Scholar]
- 2.Abkevich, V. I., Gutin, A. M. & Shakhnovich, E. I. (1994) J. Chem. Phys. 101, 6052–6062. [Google Scholar]
- 3.Jackson, S. E. (1998) Fold. Des. 3, 81–91. [DOI] [PubMed] [Google Scholar]
- 4.Krantz, B. A., Mayne, L., Rumbley, J., Englander, S. W. & Sosnick, T. R. (2002) J. Mol. Biol. 324, 359–371. [DOI] [PubMed] [Google Scholar]
- 5.Draper, D. E. (1996) Trends Biochem. Sci. 21, 145–149. [PubMed] [Google Scholar]
- 6.Udgaonkar, J. B. & Baldwin, R. L. (1995) Biochemistry 34, 4088–4096. [DOI] [PubMed] [Google Scholar]
- 7.Zarrinkar, P. P. & Williamson, J. R. (1994) Science 265, 918–924. [DOI] [PubMed] [Google Scholar]
- 8.Sclavi, B., Sullivan, M., Chance, M. R., Brenowitz, M. & Woodson, S. A. (1998) Science 279, 1940–1943. [DOI] [PubMed] [Google Scholar]
- 9.Pan, J., Deras, M. L. & Woodson, S. A. (2000) J. Mol. Biol. 296, 133–144. [DOI] [PubMed] [Google Scholar]
- 10.Cech, T. R. (1993) Biochem. Soc. Trans. 21, 229–234. [DOI] [PubMed] [Google Scholar]
- 11.Tinoco, I. & Bustamante, C. (1999) J. Mol. Biol. 293, 271–281. [DOI] [PubMed] [Google Scholar]
- 12.Brion, P. & Westhof, E. (1997) Annu. Rev. Biophys. Biomol. Struct. 26, 113–137. [DOI] [PubMed] [Google Scholar]
- 13.Russell, R. & Herschlag, D. (2001) J. Mol. Biol. 308, 839–851. [DOI] [PubMed] [Google Scholar]
- 14.Fang, X., Pan, T. & Sosnick, T. R. (1999) Nat. Struct. Biol. 6, 1091–1095. [DOI] [PubMed] [Google Scholar]
- 15.Neher, E. & Sakmann, B. (1976) Nature 260, 799–802. [DOI] [PubMed] [Google Scholar]
- 16.Lu, H. P., Xun, L. Y. & Xie, X. S. (1998) Science 282, 1877–1882. [DOI] [PubMed] [Google Scholar]
- 17.Finer, J. T., Simmons, R. M. & Spudich, J. A. (1994) Nature 368, 113–119. [DOI] [PubMed] [Google Scholar]
- 18.Wang, M. D., Schnitzer, M. J., Yin, H., Landick, R., Gelles, J. & Block, S. M. (1998) Science 282, 902–907. [DOI] [PubMed] [Google Scholar]
- 19.Montanari, A. & Mezard, M. (2001) Phys. Rev. Lett. 86, 2178–2181. [DOI] [PubMed] [Google Scholar]
- 20.Harada, Y., Ohara, O., Takatsuki, A., Itoh, H., Shimamoto, N, & Kinosita, K., Jr. (2001) Nature 409, 113–115. [DOI] [PubMed] [Google Scholar]
- 21.Talaga, D. S., Lau, W. L., Roder, H., Tang, J., Jia, Y., DeGrado, W. F. & Hochstrasser, R. M. (2000) Proc. Natl. Acad. Sci. USA 97, 13021–13026. [DOI] [PMC free article] [PubMed] [Google Scholar]
- 22.Zhuang, X. W., Ha, T., Kim, H. D., Centner, T., Labeit, S. & Chu, S. (2000) Proc. Natl. Acad. Sci. USA 97, 14241–14244. [DOI] [PMC free article] [PubMed] [Google Scholar]
- 23.Tskhovrebova, L., Trinick, J., Sleep, J. A. & Simmons, R. M. (1997) Nature 387, 308–312. [DOI] [PubMed] [Google Scholar]
- 24.Rhoades, E., Gussakovsky, E. & Haran, G. (2002) Proc. Natl. Acad. Sci. USA 100, 3197–3202. [DOI] [PMC free article] [PubMed] [Google Scholar]
- 25.Kim, H. D., Nienhaus, G. U., Ha, T., Orr, J. W., Williamson, J. R. & Chu, S. (2002) Proc. Natl. Acad. Sci. USA 99, 4284–4289. [DOI] [PMC free article] [PubMed] [Google Scholar]
- 26.Russell, R., Zhuang, X., Babcock, H. P., Millett, I. S., Doniach, S., Chu, S. & Herschlag, D. (2002) Proc. Natl. Acad. Sci. USA 99, 155–160. [DOI] [PMC free article] [PubMed] [Google Scholar]
- 27.Schuler, B., Lipman, E. A. & Eaton, W. A. (2002) Nature 419, 743–747. [DOI] [PubMed] [Google Scholar]
- 28.Zhuang, X. W., Kim, H., Pereira, M. J. B., Babcock, H. P., Walter, N. G. & Chu, S. (2002) Science 296, 1473–1476. [DOI] [PubMed] [Google Scholar]
- 29.Ha, T., Rasnik, I., Cheng, W., Babcock, H. P., Gauss, G. H., Lohman, T. M. & Chu, S. (2002) Nature 419, 638–641. [DOI] [PubMed] [Google Scholar]
- 30.Ha, T., Zhuang, X., Kim, H. D., Orr, J. W., Williamson, J. R. & Chu, S. (1999) Proc. Natl. Acad. Sci. USA 96, 9077–9082. [DOI] [PMC free article] [PubMed] [Google Scholar]
- 31.Sosnick, T. R., Fang, X. & Shelton, V. M. (2000) Methods Enzymol. 317, 393–409. [DOI] [PubMed] [Google Scholar]
- 32.Fang, X., Pan, T. & Sosnick, T. R. (1999) Biochemistry 38, 16840–16846. [DOI] [PubMed] [Google Scholar]
- 33.Fang, X., Littrell, K., Yang, X., Henderson, S. J., Siefert, S., Thiyagarajan, P., Pan, T. & Sosnick, T. R. (2000) Biochemistry 39, 11107–11113. [DOI] [PubMed] [Google Scholar]
- 34.Fang, X. W., Golden, B. L., Littrell, K., Shelton, V., Thiyagarajan, P., Pan, T. & Sosnick, T. R. (2001) Proc. Natl. Acad. Sci. USA 98, 4355–4360. [DOI] [PMC free article] [PubMed] [Google Scholar]
- 35.Zhuang, X., Bartley, L. E., Babcock, H. P., Russell, R., Ha, T., Herschlag, D. & Chu, S. (2000) Science 288, 2048–2051. [DOI] [PubMed] [Google Scholar]
- 36.Rook, M. S., Treiber, D. K. & Williamson, J. R. (1998) J. Mol. Biol. 281, 609–620. [DOI] [PubMed] [Google Scholar]
- 37.Pan, T. & Sosnick, T. R. (1997) Nat. Struct. Biol. 4, 931–938. [DOI] [PubMed] [Google Scholar]
- 38.Pan, T., Fang, X. & Sosnick, T. R. (1999) J. Mol. Biol. 286, 721–731. [DOI] [PubMed] [Google Scholar]
- 39.Silverman, S. K., Deras, M. L., Woodson, S. A., Scaringe, S. A. & Cech, T. R. (2000) Biochemistry 39, 12465–12475. [DOI] [PubMed] [Google Scholar]
- 40.Shelton, V. M., Sosnick, T. R. & Pan, T. (2001) Biochemistry 40, 3629–3638. [DOI] [PubMed] [Google Scholar]
- 41.Massire, C., Jaeger, L. & Westhof, E. (1998) J. Mol. Biol. 279, 773–793. [DOI] [PubMed] [Google Scholar]


