

Abstract
Rats use their vibrissal sensory system to collect information about the nearby environment. They can accurately and rapidly identify object location, shape, and surface texture. Which features of whisker motion does the sensory system extract to construct sensations? We addressed this question by training rats to make discriminations between sinusoidal vibrations simultaneously presented to the left and right whiskers. One set of rats learned to reliably identify which of two vibrations had higher frequency (f1 vs. f2) when amplitudes were equal. Another set of rats learned to reliably identify which of two vibrations had higher amplitude (A1 vs. A2) when frequencies were equal. Although these results indicate that both elemental features contribute to the rats’ sensation, a further test found that the capacity to discriminate A and f was reduced to chance when the difference in one feature was counterbalanced by the difference in the other feature: Rats could not discriminate amplitude or frequency whenever A1f1 = A2f2. Thus, vibrations were sensed as the product Af rather than as separable elemental features, A and f. The product Af is proportional to a physical entity, the mean speed. Analysis of performance revealed that rats extracted more information about differences in Af than predicted by the sum of the information in elemental differences. These behavioral experiments support the predictions of earlier physiological studies by demonstrating that rats are “blind” to the elemental features present in a sinusoidal whisker vibration; instead, they perceive a composite feature, the speed of whisker motion.
Keywords: barrel cortex, coding
Rats use their whiskers to recognize the positions of floors, walls, and objects, particularly in dark surroundings (1–4). Previous studies have characterized the efficacy of whisker-mediated touch in object localization (5, 6), shape recognition (7, 8), gap and aperture width detection (9, 10), texture discrimination (11–14), and vibration detection/discrimination (15, 16). The accuracy of sensory discriminations, together with the animals’ speed in reaching decisions, indicates that the vibrissal sensory system is efficient (17).
Several sensorimotor behaviors have been shown to involve the whisker region of the primary somatosensory cortex (17). This region contains anatomically and functionally distinguishable clusters of neurons called “barrels” (18). In rats, each barrel contains an average of 2,500 neurons (19) that respond primarily to their corresponding whisker (20, 21). The detailed knowledge of this processing circuitry, combined with the animals’ high-level sensory capacities, makes the rat whisker sensory system a good platform for studying the neuronal bases of perception.
Because whisker motion is the starting point for most tactile capacities, a critical step is to understand how motion is converted to neuronal firing and how neuronal firing in turn generates sensation. In earlier studies, we analyzed the cortical neuronal activity evoked by sinusoidal vibrations of the whisker shaft of anesthetized rats. We systematically varied vibration amplitude (A) and frequency (f) while making extracellular recordings from barrel cortex neurons to construct the neuronal response functions (22, 23). The results demonstrated that single neurons and cortical ensembles reliably encode the product Af by their firing rate: Increases in Af were accompanied by increases in firing rate. Importantly, the two elemental features A and f could not be decoded separately: Any given firing rate could result from an infinite number of individual A and f values provided that they formed, together, a single value of Af. This finding led to explicit predictions about performance on vibrotactile discriminations. Two vibrotactile stimuli with the same Af product (A1f1 = A2f2) were predicted to be indiscriminable. By the same token, increasing the separation between stimuli 1 and 2, in terms of the difference between A1f1 and A2f2, was predicted to augment the discriminability between them. We argued that amplitude and frequency differences between two vibrations would be sensed only to the extent that they produce a difference in the product, Af. To verify these predictions, here we measured the performance of rats in distinguishing sinusoidal vibrations composed of various combinations of A and f. The results allow us to postulate how a vibration, and the elemental features it is composed of, is sensed.
Results
The aim of these experiments was to test predictions about how differences in the amplitude (A) and frequency (f) of sinusoidal whisker vibrations affect the animal's judgment of those stimuli. Earlier measurements of barrel cortex neuronal activity in anesthetized rats demonstrated that an increase in either elemental feature, A or f, caused an increase in firing rate. However, no measure of neuronal response (firing rates or temporal patterns) explicitly encoded one elemental feature independently of another (22, 23). In the present work, we looked for the behavioral correlate of Af coding by training rats to compare sinusoidal vibrations presented simultaneously to the left and right whisker pads. Stimuli were specified by the amplitude and frequency of the sine wave, schematically illustrated in Fig. 1A. On each trial the rat was required to identify the S+ stimulus (defined by its amplitude and frequency features) and turn to the reward spout on that side, shown in Fig. 1B. In each experiment, a fixed rule determined which stimulus was S+ and the rule was maintained across multiple phases of that experiment.
Fig. 1.

Schematic representation of the stimuli and the behavioral paradigm. (A) (Left) Stimulus space. Each circle represents the frequency–amplitude combination of one stimulus. In every experiment, specific stimuli were defined as either S+ or S−. In this example, stimuli with amplitude of 2A were S+ whereas those with amplitude A were S−. (Right) Brief (50 ms) segments of the same stimuli. (B) The rat initiated a trial by a nose poke into the aperture while touching the two mesh plates with its whiskers (Left). After a random delay period during which the rat maintained its position in the nose poke, it received two simultaneous vibrations on its left and right whisker pads (Center). In each trial, one of the two vibrations was S+ and the other was S−. Having identified the S+ vibration, the rat expressed its choice by turning toward the corresponding drinking spout, e.g., to the right in this example. Correct judgments were rewarded by sucrose water (Right).
Experiment 1: Sensory Consequences of Vibration Parameters.
Experiment 1a contained three phases (Fig. 2 A–C) across which two rats performed an average of 164 trials per session. Two frequencies (f = 37.5 Hz and 2f = 75 Hz) and two amplitudes (A = 13 μm and 2A = 26 μm) were used and the rule was that the stimulus with the higher amplitude, 2A, was S+ whereas that with the lower amplitude, A, was S−. In all phases, the rule was general across two different frequencies, f and 2f. In phase 1, the two stimuli of each discrimination pair had the same frequency so that the only signal was in amplitude (Fig. 2A, Left). Fig. 2A, Right gives the results from both rats. Across seven sessions of testing, the rats succeeded in discriminating an amplitude difference imposed on f and 2f with performances ranging from 60 to 66% (all P values <0.001 compared with chance, binomial test). Phase 2 of the experiment used the identical four stimuli and again rats were rewarded for selecting the stimulus at higher amplitude. The only difference from phase 1 was that the stimuli to be compared had unequal frequency values. Specifically in the delta-Af condition S+ had greater amplitude and greater frequency than S−. In the iso-Af condition, S+ had greater amplitude but lower frequency than S− (Fig. 2B, Left). What properties of the stimulus did the rats use to identify S+? Had they used the separate elemental features, then f, 2A would have been correctly identified as S+, just as it had in phase 1. Instead, performance in identifying f, 2A as S+ dropped to chance when it was paired with 2f, A (P values = 0.87 and 0.67, two-tailed binomial test; Fig. 2B, Right). Did performance fall because the rats were presented with a stimulus pairing that had not yet been experienced (f, 2A vs. 2f, A)? Novelty was not an explanation, for both rats performed well in discriminating between stimuli in the equally novel delta-Af condition (average performances 71% and 74% for rats 1 and 2; P values <0.0001, binomial test; Fig. 2B, Right). Across the 11 sessions for rats 1 and 2, respectively, no improvement in performance of the iso-Af comparison occurred.
Fig. 2.

Experiment 1a: Discrimination of stimuli by frequency difference. (A) Phase 1. (Left) Two frequencies (f = 37.5 Hz and 2f = 75 Hz) and two amplitudes (A = 13 μm and 2A = 26 μm) were combined to generate four vibrations. Stimuli that were presented together and had to be discriminated (paired stimuli) are connected by a shaded line (d1 and d2). S+ stimuli were defined by 2A. (Right) Performance is plotted for individual rats across all trials collected over 7 sessions. Error bars in A–C are the 95% confidence interval (Wilson score). (B) Phase 2. (Left) Stimuli were identical to those in phase 1, but paired differently. The solid line indicates the pair in which both amplitude and frequency differed with the same sign (delta-Af) whereas the shaded line indicates the pair in which amplitude and frequency differed with opposite signs (iso-Af). (Right) Performance is plotted for individual rats across all trials collected over 11 sessions. (C) Phase 3. (Left) All stimulus pairs from phases 1 and 2 were intermixed. (Right) Performance is plotted for individual rats across all trials collected over 10 sessions.
Phase 3 simply combined all of the discrimination pairs from phases 1 and 2 (Fig. 2C, Left). The four discrimination pairs were intermixed and presented for 10 sessions. Across the four discrimination pairs, the same relative performance seen in phases 1 and 2 was preserved, suggesting that rats applied the same decision-making rules in different phases. Furthermore despite extensive experience with the iso-Af pair, performance on this comparison remained at chance.
Whereas experiment 1a focused on the sensing of amplitude differences, experiment 1b measured rats’ capacity to sense frequency differences. Two rats performed an average of 178 trials per session over two phases. The stimuli were identical to those of experiment 1a but paired differently: here, the rule was that the stimulus with the higher frequency, 2f, was S+ and that with the lower frequency, f, was S−. The rule was general across two different amplitudes, A and 2A (Fig. 3A, Left). In phase 1, the two stimuli of each discrimination pair had the same amplitude so that the only signal was in frequency. Fig. 3A, Right gives the results from both rats. Across 6 sessions of testing, the rats succeeded in discriminating a frequency difference imposed on A and 2A with performances ranging from 58 to 69% (all P values <0.002, binomial test). Phase 2 of the experiment used the identical four stimuli and again rats were rewarded for selecting the stimulus at higher frequency (Fig. 3B). The only difference from phase 1 was that the stimuli to be compared had unequal amplitude values. Specifically in the delta-Af condition S+ had greater frequency and greater amplitude than S−. In the iso-Af condition, S+ had greater frequency but lower amplitude than S− (Fig. 3B, Left). As in experiment 1a, both rats performed well in discriminating between stimuli in the delta-Af condition (average performances 73% and 68% for rats 3 and 4; P values <0.0001, binomial test; Fig. 3B, Right). If the rats used the separate elemental features to solve the task, then the stimulus 2f, A would have been correctly identified as S+ in phase 2; however, it was not identified as S+ when paired with f, 2A in this phase (P values = 0.62 and 0.27, two-tailed binomial test). The rats failed to improve their performance for the iso-Af discrimination across 10 testing sessions in phase 2.
Fig. 3.

Experiment 1b: Discrimination of stimuli by amplitude difference. (A) Phase 1. (Left) Two frequencies (f = 37.5 Hz and 2f = 75 Hz) and two amplitudes (A = 13 μm and 2A = 26 μm) were combined to generate four vibrations. Stimuli that were presented together and had to be discriminated (paired stimuli) are connected by a shaded line (d1 and d2). S+ stimuli were defined by 2A. (Right) Performance is plotted for individual rats across all trials collected over 6 sessions. (B) Phase 2. (Left) Stimuli were identical to those in phase 1, but paired differently. The solid line indicates the pair in which both amplitude and frequency differed with the same sign (delta-Af) whereas the shaded line indicates the pair in which amplitude and frequency differed with opposite signs (iso-Af). (Right) Performance is plotted for individual rats across all trials collected over 10 sessions. Error bars indicate the 95% confidence interval (Wilson Score).
Experiment 2: Perceptual Representation of Physical Dimensions, A and f.
In experiment 2 we aimed to further characterize discriminability in the space of frequency and amplitude. To provide a direct quantification of discriminability, we introduced multiple comparisons against a specific stimulus (triangles in Fig. 4A). This stimulus, which we refer to as the anchoring stimulus, was set as S+ and three other stimuli (S−) were generated by moving away from S+ in three directions: (i) along one elemental dimension, (ii) along the delta-Af contour, and (iii) along the iso-Af contour.
Fig. 4.

Experiment 2: Stimulus dimensions underlying the percept. (A) (Left) Group 1. Three frequencies (1/2 f = 40 Hz, f = 80 Hz and 2f = 160 Hz) and two amplitudes (A = 16 μm and 2A = 32 μm) were used to generate five vibrations. (Right) Group 2. Two frequencies (f = 80 Hz and 2f = 160 Hz) and three amplitudes (1/2 A = 8 μm, A = 16 μm, and 2A = 32 μm) were combined to generate five vibrations. Stimuli that were presented together and had to be discriminated (paired stimuli) are connected by lines: The dotted and solid lines indicate discriminations along delta-Af contours. The lines with dark shading indicate discriminations along elemental features [A (Left) and f (Right)]. The lines with light shading indicate discriminations along iso-Af counters. (B) The average discrimination performances across four rats. Each bar represents a specific stimulus pair, using the same color key as in A. The x axis shows the net difference between stimuli in elemental features. E denotes a unit (100%) change in any elemental feature A or f. (C) Same data as in B, replotted here as a function of the Af difference. Error bars indicate the SEM.
Experiment 2 also used stimuli from a wider range of amplitude and frequency (8, 16, and 32 μm and 40, 80, and 160 Hz) to allow some insight into whether the broader area of Af space is perceived as a single continuum. An additional S+ stimulus was added (squares in Fig. 4A) to maintain the structure of experiment 1 for the new range of stimuli. For group 1, the rule was that the stimuli with the higher amplitude, 2A, were S+ and those with the lower amplitude, A, were S−. For group 2, the rule was that the stimuli with the higher frequency, 2f, were S+ and those with the lower frequency, f, were S−. Unlike experiment 1, experiment 2 was not structured in separate phases: All pairwise discriminations were introduced at the same time. This experiment ran for 11 sessions and rats performed an average of 108 trials per session.
The results were the same when A and f were taken as the elementary dimension, so for simplicity we combined groups 1 and 2. In sensing a difference restricted to the elemental dimension, rats showed an average performance of 67%, which was significantly lower than the delta-Af performance of 77% (P values <0.02 for three rats and 0.08 for the fourth rat; χ2-test) and significantly higher than the iso-Af performance of 49% (P values <0.002 for three rats and 0.076 for the fourth rat; χ2-test). Rats performed most accurately (84%) for the A, f vs. 2A, 2f discrimination that was the analogous pair to the delta-Af discrimination in experiment 1. Critically in this design, considering any metric in Af space, the physical distance between S+ and S− was greater in the iso-Af comparison than in the delta-Af comparison and the comparison restricted to the elemental feature alone. Thus, were the rats capable of identifying elemental features individually, their performance for iso-Af would have exceeded their performance for delta-Af and for differences in the elemental feature alone. In contrast, the iso-Af performance was the lowest of all comparisons.
What physical dimension(s) in the amplitude and frequency space determines the perceptual distance between stimulus pairs? To address this question, we plotted the performances using two different x axes. Fig. 4B plots the performance for each discrimination pair as a function of distance in units of E, where 1E is equivalent to one step in that dimension—for instance, a stimulus difference between 1/2 f and f or between 1/2 A and A is denoted as 1/2 E. The relationship between performance and the net elemental distance was not monotonic, indicating that the perceptual distance could not be explained by distance in the elementary dimension alone. Indeed, the between-stimulus distance of 2E gave two very different performance values depending on the exact A, f configuration. Fig. 4C plots the same performances, now as a function of the difference in the Af product. As A2f2 − A1f1 increased, the performances monotonically increased.
In line with the findings of experiment 1, these final results strongly suggest rats have no independent percept of the elemental features A and f. Furthermore, the monotonic relationship between behavioral performance and the difference in the Af product indicates that stimuli are sensed and compared in the space of the Af dimension.
Interaction of Signals from the Elemental Features.
When multiple features potentially provide information about a stimulus, how does the animal combine them to select its actions? The current experimental design allowed us to measure the information extracted by the rat when amplitude and frequency signals were provided in isolation or together. In principal, amplitude and frequency signals could be redundant with each other, synergistic, or independent. To test between these we used a model whereby we assume that the information extracted by the rat about a vibration difference is converted directly into a choice. This model allowed us to estimate the signal extracted by the rat according to its behavioral accuracy. In practice, we computed the mutual information (Methods) between the true position of S+ (left or right) and the rat's judgment of the position of S+ (left or right). Combining experiments 1a and 1b, we found that the average information extracted about a pure difference in frequency (f vs. 2f) was 0.06 bits and the average information extracted about a pure difference in amplitude (A vs. 2A) was 0.05 bits. The summated quantity of information is 0.11 bits. Under the delta-Af condition, the average information extracted about a simultaneous difference in amplitude and frequency was 0.15 bits and was thus larger than the summated quantities of A and f information. Interestingly, when changes in frequency and amplitude were applied in opposite directions (iso-Af), the average mutual information decreased to 0.00 bits. The mutual information analysis of experiment 2 gave similar results; when changes in A and f were combined in the same direction, the average information extracted by the rats was 0.38 bits, which was again larger than the summated elemental information of 0.19 bits. The average information extracted about the simultaneous difference under the iso-Af condition was 0.02 bits. These results suggest that the step changes in the two elemental features are not encoded independently: When A and f differences have the same sign, the neuronal activity evoked by the combined change contains more information than would be present if the information available from A and f were summated. This result is compatible with previous physiological observations indicating that cortical neuronal activity encoded the elemental features jointly and that this joint feature was the value of the product of Af (22).
Discussion
We trained rats to discriminate between sinusoidal vibrations. Vibration is an ideal stimulus for two reasons: first, because it can be characterized and precisely controlled in experimental settings by its two elemental parameters, A and f, and second, because it simulates key features of natural stimuli in the environment (23–26). In earlier studies (22, 23) we applied methods of mutual information to measure the signal carried by barrel cortex neurons about the two elemental features A and f separately and their potential joint encoding. We found that neurons reduced the dimensionality of the stimulus from two features (A, f) to a single feature, the product Af (22, 23). Furthermore, the nature of this code is highly efficient for a population: Because different neurons encoded stimuli in the same manner, information loss was negligible even when the activity of separate neuronal clusters was pooled. On the basis of the argument that two stimuli can be discriminated only if there is an informative difference in their neuronal representations, these results predicted that rats could sense a difference between vibrations 1 and 2 only if the vibrations differ in the product of amplitude and frequency—that is, if A1f1 is not equal to A2f2. Only the product Af but neither the amplitude of a sinusoidal vibration nor its frequency could be explicitly sensed. Af defines a real physical property: the mean speed of whisker motion averaged over cycles.
The behavioral experiments 1a, 1b, and 2 supported the predictions in demonstrating that rats perceive only a composite feature, the product Af. Experiment 1 showed that the magnitude of an individual elementary feature could not be successfully extracted by the rats to identify S+. Experiment 2 demonstrated that the rats’ performance in discriminating two stimuli is accounted for by the difference in Af but not by differences in either elemental feature, alone. Finally, we used the values of behavioral accuracy to estimate the quantity of stimulus information obtained from vibrations. The rats appeared to combine the separate quantities of information obtained from an A difference and from an f difference in a supralinear manner to make discriminations between stimuli that differed in both features. This result can be easily explained by the sigmoidal shape of mean firing rate as a function of the product Af: Along the portion of the sigmoid with accelerating nonlinearity, an increase in the product Af causes a larger increase in firing rate than does the sum of separate increases in A and f (see figure 2b in ref. 22).
A recent study (27) showed that barrel neurons provide a representation of the position of contacted objects in a coordinate frame that is normalized to the trajectory of the motor output (i.e., phase of whisking). Contact was encoded independently of the angular whisker position and was shown to be invariant with respect to the amplitude and frequency of whisking. The representation of contact in a coordinate system that is dynamically normalized by the motor output provides the basis for encoding the properties of an externally induced movement, in this case the Af product of a sinusoidal vibration.
Beyond mean speed, barrel cortex neurons have also been shown to encode the direction of motion. A fraction of barrel cortex neurons are tuned to the direction of whisker deflection (28–30). In the present study, motion was always produced in the vertical axis. How might neuronal directional selectivity influence the encoding of this stimulus set? A critical observation is that all of the barrel cortex single units and multiunit clusters recorded during sinusoidal whisker motion along one axis have shown a monotonically increasing, sigmoidal firing rate as a function of mean speed, Af (22, 23). Combining this finding with the observations of directional selectivity, we can surmise that a neuron's sigmoidal response function to increasing Af would be scaled by the angular difference between motion direction (vertical in our experiment) and the neuron's preferred direction. Across the population of responding neurons, firing rate would remain a highly efficient code for stimulus mean speed. An interesting question for future behavioral experiments would be to randomly vary the axis of motion across trials to determine whether the rat generalizes its sensation of motion mean speed across all directions. Our prediction is that mean speed would be extracted by the rat with no confound by direction.
Our findings are consistent with a recent study (31) that found interactions between movement frequency and amplitude in whisker sensation. Gerdjikov and colleagues measured the licking response of head-fixed rats to sequences of discrete pulses delivered at various frequencies. The rats were rewarded only for licking in response to the 90 pulses per second stimulus (S+) but they were not trained to explicitly discriminate between stimuli. The rats decreased their probability of licking when the test stimulus deviated from S+ either in frequency or in amplitude. Although the study showed that frequency and amplitude interact in the generation of a vibration sensation, it did not quantify how rats sense the elemental features and their combination.
Whereas the present behavioral results appear to be the logical consequence of the available neurometric functions for sinusoidal stimuli (22, 23), our observation that rats cannot discriminate vibrations on the basis of frequency alone disagrees with the predictions from another physiological study (32), which reported that in rats under light fluorothane gas anesthesia, barrel cortex neurons fired in a phase-locked manner in response to whisker vibrations of up to 300 Hz. From this, it was argued that rats could extract vibration frequency from interspike intervals. However, in the present study, rats showed no capacity to sense vibration frequency as a feature independent of and separable from amplitude. There are two possible explanations for the apparent discrepancy between the physiological results of Ewert et al. and the current behavioral results. First, in the behaving rat neuronal firing may not in fact carry the temporal information seen under gaseous anesthetic (32). Second, in behaving rats temporal information may be present in barrel cortex spike trains, but such information is not “read out” or accessed in the construction of the percept. Rather, the percept is mediated by firing rate across windows comprising multiple cycles of the vibration.
Experiments in primates are consistent with the second account. Monkeys were trained to compare the frequencies of two sequential vibrations. Among neurons in primary somatosensory cortex, higher vibration frequency in general led to higher firing rate when integrated over the entire stimulus duration, allowing the possibility of a rate code. Among neurons that fired in a phase-locked manner, higher frequency led to periodic firing with shorter interspike intervals, allowing the possibility of a temporal code. However, the occurrence of errors in the monkeys’ judgment of frequency was correlated with neuronal “errors” in firing rate, but not with errors in interspike interval. Thus, the monkeys appeared to judge the stimulus by rate rather than by temporal patterns (33–36).
In classic primate experiments vibrotactile stimuli revealed high correlations between neural responses in monkey somatosensory cortex and psychological measurements in humans (37) and monkeys (38). The present results are also consistent with findings on human subjects. When subjects were asked to judge the relative frequency of a pair of vibrotactile stimuli applied to their fingers, their judgments were affected by amplitude in the same way as that of the rats in the current study (39). This finding suggests that, if neurons fire for a periodic stimulus in a phase-locked manner, the temporal information in the spike trains cannot be optimally extracted to estimate vibration frequency.
A different study showed that human subjects’ judgment of vibrotactile intensity was affected by introducing temporal irregularity (frequency noise) and irregularity in deflection magnitude (amplitude noise) (40). In both cases, subjects overestimated the intensity of the noisy vibrations compared with nonnoisy vibrations with the same mean values. When the same stimuli were applied to rat whiskers, barrel cortex neurons’ firing rates were boosted by the presence of noise (40, 41). The precise match of noise effects on barrel cortex firing rate and noise effects on perceived vibration intensity in human subjects again suggests that in the neuronal representation of a vibration, firing rate is the most salient firing property. Thus, it is difficult for primates—and in the present study, impossible for rodents—to sense the elemental stimulus features that evoke a given firing rate.
Methods
Subjects and Apparatus.
Eight adult male Wistar rats, weighing 300–400 g, were used in the behavioral experiment. Rats were kept on a 12:12-h light:dark cycle (with lights on at 7:00 AM) in a climate-controlled colony room. They were maintained on a mild food/water deprivation (12–15 g of rat chow and 3 h of ad libitum access to water each day) and were rewarded with a 7% sucrose solution during the experiment. Vibrotactile stimuli (Fig. 1A) were presented to the rat in a Plexiglas chamber 30 cm (length) × 25 cm (width) × 25 cm (height) with an aperture (6 × 6 cm) in the front wall (Fig. 1B and Fig. S1). Nose pokes into the aperture were detected by an infrared optical sensor. Two mesh plates (35 × 35 mm) were positioned 2 mm from the edges of the aperture slanted toward each other at a 50° angle. The mesh plates were attached to piezoelectric ceramic bars (Morgan Technical Ceramics) that delivered vertical sine wave vibrations to the whiskers. Stimuli were generated in MATLAB (Mathworks) using an analog output (National Instruments) at a 44.1-kHz sampling rate and sent to the piezoelectric bars through an amplifier (25.4 dB gain). The nose-poke sensor was positioned in a way that forced the rats to maintain a stable head position within and across trials during the stimulus presentation. The reward was delivered through two drinking spouts located at either side of the aperture in the front wall. The behavior of the rat (the nose poke and the response at either reward spout) was continuously registered into a data acquisition card (National Instruments), using custom-built optical sensors. A MATLAB script controlled the presentation of the stimuli, registered the behavior of the rats along with the corresponding time stamp of each behavioral action, and controlled the delivery of rewards through two separate water pumps. The behavior of the rats was also monitored during the experiment, using an infrared camera positioned in front of the aperture.
Behavioral Task and Experimental Design.
Fig. 1 provides a schematic representation of the stimuli and the experimental design. The task of the rat in each trial was to sense two simultaneous vibrations and identify the reward-associated stimulus (S+) by comparison with the non-reward–associated stimulus (S−). 1A, Left shows four stimuli, characterized by amplitude (A or 2A) and frequency (f or 2f). In this case, S+ stimuli are defined by 2A and can have either f or 2f and S− stimuli are defined by A and can have either f or 2f. In each trial, one vibration from the S+ pair and one vibration from the S− pair are presented. For instance, the rat could receive A, 2f on the left whiskers and 2A, 2f on the right whiskers—it must identify 2A, 2f as the reward-associated stimulus, S+. Fig. 1A, Right shows piezoelectric bar position over brief time windows for these stimuli (A and 2A are 13 and 26 μm, respectively, whereas f and 2f are 37.5 and 75 Hz, respectively). This particular arrangement was used in experiment 1a. Experiments 1b and 2 entailed different stimulus values and a different grouping into S+ and S−.
All experiments began with familiarization to the setup and the shaping of the behavior. This process lasted 3 d. On day 1, rats received sucrose solution by licking at the two reward spouts. On days 2 and 3, they learned to nose poke into the middle aperture to activate the reward spouts. The main behavioral task commenced thereafter. The sequence of events in the task is illustrated in Fig. 1B and Movie S1. The rat initiated a trial by a nose poke (snout entry between the two meshes) through the aperture (Fig. 1B, nose poke). Nose poke resulted in the onset of vibration of both meshes after a variable delay, provided that the rat maintained its position throughout this delay (Fig. 1B, stimulus presentation). The onset delay was selected from a uniform distribution from 100 ms to 1 s. In Fig. 1B , the left stimulus has amplitude A and is therefore S−; the right stimulus has amplitude 2A and is S+. The rat responded by choosing the left or right reward spout. The first lick at either drinking spout was considered to be the choice. The rat was allowed to respond any time from 50 ms to 8 s after stimulus onset. A correct response was to lick the spout on the side of the mesh with the S+ stimulus (Fig. 1B, choice and reward). Correct trials were rewarded with 0.08 mL of 7% sucrose solution. For incorrect responses (turning to the S− side) no reward was given and a time-out penalty was imposed, delaying for 4 s the possible onset of the next trial. The proportion of stimulus presentations at each side was based on the inverse proportion of the history of responses at that side. This adaptive strategy prevented the rat from forming a response bias by ensuring that roughly equal numbers of choices were made toward either spout. In each phase of every experiment the stimulus pairs were presented in a pseudorandom order. This procedure ensured that all stimulus pairs were presented for a similar number of trials.
Information Theoretic Analysis.
To quantify the information extracted by the rat about elemental features and the way these features interact on a trial-by-trial basis, we performed a mutual information analysis (42, 43). This analysis allowed us to quantify how informative the rats’ behavior was about a particular S+/S− discrimination. The information that the behavioral response conveys about the S+ stimulus position can be quantified by Shannon's mutual information formula,
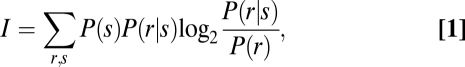 |
where P(s) is the probability of presentation of S+ at side s (right or left), P(r | s) is the posterior probability of the rat's response (right or left choice) given presentation of S+ at side s, and P(r) is the probability of response r (rat's choice to left or right) unconditional on the S+ position.
Supplementary Material
Acknowledgments
We are grateful to John Bolzan for providing outstanding technical support for the behavioral control setup. This research was supported by Australian Research Council Discovery Project DP0987133, European Union Framework Project Biomimetic Technology for vibrissal Active Touch Grant ICT-215910, Human Frontier Science Program Contract RG0041/2009-C, Compagnia San Paolo, and the Italian Institute of Technology through the Brain Machine Interface Project.
Footnotes
The authors declare no conflict of interest.
This article is a PNAS Direct Submission.
This article contains supporting information online at www.pnas.org/lookup/suppl/doi:10.1073/pnas.1116726109/-/DCSupplemental.
References
- 1.Jenks RA, Vaziri A, Boloori AR, Stanley GB. Self-motion and the shaping of sensory signals. J Neurophysiol. 2010;103:2195–2207. doi: 10.1152/jn.00106.2009. [DOI] [PMC free article] [PubMed] [Google Scholar]
- 2.Vincent SB. The function of vibrissae in the behavior of the white rat. Behavior Mon. 1912;1:1–82. [Google Scholar]
- 3.Carvell GE, Simons DJ. Biometric analyses of vibrissal tactile discrimination in the rat. J Neurosci. 1990;10:2638–2648. doi: 10.1523/JNEUROSCI.10-08-02638.1990. [DOI] [PMC free article] [PubMed] [Google Scholar]
- 4.Brecht M. Barrel cortex and whisker-mediated behaviors. Curr Opin Neurobiol. 2007;17:408–416. doi: 10.1016/j.conb.2007.07.008. [DOI] [PubMed] [Google Scholar]
- 5.Knutsen PM, Ahissar E. Orthogonal coding of object location. Trends Neurosci. 2009;32:101–109. doi: 10.1016/j.tins.2008.10.002. [DOI] [PubMed] [Google Scholar]
- 6.O'Connor DH, et al. Vibrissa-based object localization in head-fixed mice. J Neurosci. 2010;30:1947–1967. doi: 10.1523/JNEUROSCI.3762-09.2010. [DOI] [PMC free article] [PubMed] [Google Scholar]
- 7.Brecht M, Preilowski B, Merzenich MM. Functional architecture of the mystacial vibrissae. Behav Brain Res. 1997;84:81–97. doi: 10.1016/s0166-4328(97)83328-1. [DOI] [PubMed] [Google Scholar]
- 8.Polley DB, Rickert JL, Frostig RD. Whisker-based discrimination of object orientation determined with a rapid training paradigm. Neurobiol Learn Mem. 2005;83:134–142. doi: 10.1016/j.nlm.2004.10.005. [DOI] [PubMed] [Google Scholar]
- 9.Harris JA, Petersen RS, Diamond ME. Distribution of tactile learning and its neural basis. Proc Natl Acad Sci USA. 1999;96:7587–7591. doi: 10.1073/pnas.96.13.7587. [DOI] [PMC free article] [PubMed] [Google Scholar]
- 10.Jenkinson EW, Glickstein M. Whiskers, barrels, and cortical efferent pathways in gap crossing by rats. J Neurophysiol. 2000;84:1781–1789. doi: 10.1152/jn.2000.84.4.1781. [DOI] [PubMed] [Google Scholar]
- 11.Morita T, Kang H, Wolfe J, Jadhav SP, Feldman DE. Psychometric curve and behavioral strategies for whisker-based texture discrimination in rats. PLoS ONE. 2011;6:e20437. doi: 10.1371/journal.pone.0020437. [DOI] [PMC free article] [PubMed] [Google Scholar]
- 12.Diamond ME, von Heimendahl M, Arabzadeh E. Whisker-mediated texture discrimination. PLoS Biol. 2008;6:e220. doi: 10.1371/journal.pbio.0060220. [DOI] [PMC free article] [PubMed] [Google Scholar]
- 13.von Heimendahl M, Itskov PM, Arabzadeh E, Diamond ME. Neuronal activity in rat barrel cortex underlying texture discrimination. PLoS Biol. 2007;5:e305. doi: 10.1371/journal.pbio.0050305. [DOI] [PMC free article] [PubMed] [Google Scholar]
- 14.Guić-Robles E, Valdivieso C, Guajardo G. Rats can learn a roughness discrimination using only their vibrissal system. Behav Brain Res. 1989;31:285–289. doi: 10.1016/0166-4328(89)90011-9. [DOI] [PubMed] [Google Scholar]
- 15.Hutson KA, Masterton RB. The sensory contribution of a single vibrissa's cortical barrel. J Neurophysiol. 1986;56:1196–1223. doi: 10.1152/jn.1986.56.4.1196. [DOI] [PubMed] [Google Scholar]
- 16.Adibi M, Arabzadeh E. A comparison of neuronal and behavioral detection and discrimination performances in rat whisker system. J Neurophysiol. 2011;105:356–365. doi: 10.1152/jn.00794.2010. [DOI] [PubMed] [Google Scholar]
- 17.Diamond ME, von Heimendahl M, Knutsen PM, Kleinfeld D, Ahissar E. Where and what in the whisker sensorimotor system. Nat Rev Neurosci. 2008;9:601–612. doi: 10.1038/nrn2411. [DOI] [PubMed] [Google Scholar]
- 18.Woolsey TA, Van der Loos H. The structural organization of layer IV in the somatosensory region (SI) of mouse cerebral cortex. The description of a cortical field composed of discrete cytoarchitectonic units. Brain Res. 1970;17:205–242. doi: 10.1016/0006-8993(70)90079-x. [DOI] [PubMed] [Google Scholar]
- 19.Jones E, Diamond I, editors. Cerebral Cortex. Vol 11. New York, NY: Plenum Press; 1995. The barrel cortex of rodents. [Google Scholar]
- 20.Welker C. Microelectrode delineation of fine grain somatotopic organization of (SmI) cerebral neocortex in albino rat. Brain Res. 1971;26:259–275. [PubMed] [Google Scholar]
- 21.Petersen CCH. The functional organization of the barrel cortex. Neuron. 2007;56:339–355. doi: 10.1016/j.neuron.2007.09.017. [DOI] [PubMed] [Google Scholar]
- 22.Arabzadeh E, Panzeri S, Diamond ME. Whisker vibration information carried by rat barrel cortex neurons. J Neurosci. 2004;24:6011–6020. doi: 10.1523/JNEUROSCI.1389-04.2004. [DOI] [PMC free article] [PubMed] [Google Scholar]
- 23.Arabzadeh E, Petersen RS, Diamond ME. Encoding of whisker vibration by rat barrel cortex neurons: Implications for texture discrimination. J Neurosci. 2003;23:9146–9154. doi: 10.1523/JNEUROSCI.23-27-09146.2003. [DOI] [PMC free article] [PubMed] [Google Scholar]
- 24.Lottem E, Azouz R. Mechanisms of tactile information transmission through whisker vibrations. J Neurosci. 2009;29:11686–11697. doi: 10.1523/JNEUROSCI.0705-09.2009. [DOI] [PMC free article] [PubMed] [Google Scholar]
- 25.Arabzadeh E, Zorzin E, Diamond ME. Neuronal encoding of texture in the whisker sensory pathway. PLoS Biol. 2005;3:e17. doi: 10.1371/journal.pbio.0030017. [DOI] [PMC free article] [PubMed] [Google Scholar]
- 26.Lottem E, Azouz R. Dynamic translation of surface coarseness into whisker vibrations. J Neurophysiol. 2008;100:2852–2865. doi: 10.1152/jn.90302.2008. [DOI] [PubMed] [Google Scholar]
- 27.Curtis JC, Kleinfeld D. Phase-to-rate transformations encode touch in cortical neurons of a scanning sensorimotor system. Nat Neurosci. 2009;12(4):492–501. doi: 10.1038/nn.2283. [DOI] [PMC free article] [PubMed] [Google Scholar]
- 28.Simons DJ. Response properties of vibrissa units in rat SI somatosensory neocortex. J Neurophysiol. 1978;41:798–820. doi: 10.1152/jn.1978.41.3.798. [DOI] [PubMed] [Google Scholar]
- 29.Andermann ML, Moore CI. A somatotopic map of vibrissa motion direction within a barrel column. Nat Neurosci. 2006;9(4):543–551. doi: 10.1038/nn1671. [DOI] [PubMed] [Google Scholar]
- 30.Puccini GD, Compte A, Maravall M. Stimulus dependence of barrel cortex directional selectivity. PLoS ONE. 2006;1:e137. doi: 10.1371/journal.pone.0000137. [DOI] [PMC free article] [PubMed] [Google Scholar]
- 31.Gerdjikov TV, Bergner CG, Stüttgen MC, Waiblinger C, Schwarz C. Discrimination of vibrotactile stimuli in the rat whisker system: Behavior and neurometrics. Neuron. 2010;65:530–540. doi: 10.1016/j.neuron.2010.02.007. [DOI] [PubMed] [Google Scholar]
- 32.Ewert TA, Vahle-Hinz C, Engel AK. High-frequency whisker vibration is encoded by phase-locked responses of neurons in the rat's barrel cortex. J Neurosci. 2008;28:5359–5368. doi: 10.1523/JNEUROSCI.0089-08.2008. [DOI] [PMC free article] [PubMed] [Google Scholar]
- 33.Hernández A, Zainos A, Romo R. Neuronal correlates of sensory discrimination in the somatosensory cortex. Proc Natl Acad Sci USA. 2000;97:6191–6196. doi: 10.1073/pnas.120018597. [DOI] [PMC free article] [PubMed] [Google Scholar]
- 34.Luna R, Hernández A, Brody CD, Romo R. Neural codes for perceptual discrimination in primary somatosensory cortex. Nat Neurosci. 2005;8:1210–1219. doi: 10.1038/nn1513. [DOI] [PubMed] [Google Scholar]
- 35.Salinas E, Hernandez A, Zainos A, Romo R. Periodicity and firing rate as candidate neural codes for the frequency of vibrotactile stimuli. J Neurosci. 2000;20:5503–5515. doi: 10.1523/JNEUROSCI.20-14-05503.2000. [DOI] [PMC free article] [PubMed] [Google Scholar]
- 36.Romo R, Salinas E. Flutter discrimination: Neural codes, perception, memory and decision making. Nat Rev Neurosci. 2003;4:203–218. doi: 10.1038/nrn1058. [DOI] [PubMed] [Google Scholar]
- 37.LaMotte RH, Mountcastle VB. Capacities of humans and monkeys to discriminate vibratory stimuli of different frequency and amplitude: A correlation between neural events and psychological measurements. J Neurophysiol. 1975;38:539–559. doi: 10.1152/jn.1975.38.3.539. [DOI] [PubMed] [Google Scholar]
- 38.Mountcastle VB, Steinmetz MA, Romo R. Frequency discrimination in the sense of flutter: Psychophysical measurements correlated with postcentral events in behaving monkeys. J Neurosci. 1990;10:3032–3044. doi: 10.1523/JNEUROSCI.10-09-03032.1990. [DOI] [PMC free article] [PubMed] [Google Scholar]
- 39.Harris JA, Arabzadeh E, Fairhall AL, Benito C, Diamond ME. Factors affecting frequency discrimination of vibrotactile stimuli: Implications for cortical encoding. PLoS ONE. 2006;1:e100. doi: 10.1371/journal.pone.0000100. [DOI] [PMC free article] [PubMed] [Google Scholar]
- 40.Lak A, Arabzadeh E, Harris JA, Diamond ME. Correlated physiological and perceptual effects of noise in a tactile stimulus. Proc Natl Acad Sci USA. 2010;107:7981–7986. doi: 10.1073/pnas.0914750107. [DOI] [PMC free article] [PubMed] [Google Scholar]
- 41.Lak A, Arabzadeh E, Diamond ME. Enhanced response of neurons in rat somatosensory cortex to stimuli containing temporal noise. Cereb Cortex. 2008;18:1085–1093. doi: 10.1093/cercor/bhm144. [DOI] [PubMed] [Google Scholar]
- 42.Shannon CE. A mathematical theory of communication. Bell Syst Tech J. 1948;27:379–423. 623–656. [Google Scholar]
- 43.Cover TM, Thomas JA. Elements of Information Theory. New York: Wiley; 1991. [Google Scholar]
Associated Data
This section collects any data citations, data availability statements, or supplementary materials included in this article.