Abstract
Since Faraday’s pioneering work on gold colloids, tremendous scientific research on plasmonic gold nanoparticles has been carried out, but no atomically precise Au nanocrystals have been achieved. This work reports the first example of gold nanocrystal molecules. Mass spectrometry analysis has determined its formula to be Au333(SR)79 (R = CH2CH2Ph). This magic sized nanocrystal molecule exhibits fcc-crystallinity and surface plasmon resonance at approximately 520 nm, hence, a metallic nanomolecule. Simulations have revealed that atomic shell closing largely contributes to the particular robustness of Au333(SR)79, albeit the number of free electrons (i.e., 333 - 79 = 254) is also consistent with electron shell closing based on calculations using a confined free electron model. Guided by the atomic shell closing growth mode, we have also found the next larger size of extraordinarily stability to be Au∼530(SR)∼100 after a size-focusing selection—which selects the robust size available in the starting polydisperse nanoparticles. This work clearly demonstrates that atomically precise nanocrystal molecules are achievable and that the factor of atomic shell closing contributes to their extraordinary stability compared to other sizes. Overall, this work opens up new opportunities for investigating many fundamental issues of nanocrystals, such as the formation of metallic state, and will have potential impact on condensed matter physics, nanochemistry, and catalysis as well.
Keywords: atomic precision, face-centered cubic, nanomolecule, plasmonic excitation
Noble metal nanocrystals have attracted significant interest in both fundamental research and technological applications due primarily to their elegant surface plasmon resonance properties (1–6). Scientific studies on gold nanocrystals date back to Faraday’s time in the nineteenth century (7). A classic procedure for the synthesis of gold nanocrystals is the citrate method, which produces quite uniform approximately 10–100 nm diameter nanocrystals with size tunable by controlling the ratio of sodium citrate to gold precursor (8, 9). Compared to the citrate-stabilized Au nanocrystals, thiolate-protected Au nanoparticles are more robust due to strong Au–SR bonds and have found important applications in biomedicine and many other fields (10–18). From the synthetic point of view, in all the previous synthetic works the obtained Au nanocrystals are more or less polydispersed, even the best quality Au nanocrystals achievable thus far—which still has a size dispersity of around 5–10%. Thus, it has long been a dream of nano-chemists to synthesize atomically precise, plasmonic nanocrystals for fundamental studies. Herein, we report the first example of atomically precise gold nanocrystals. Mass spectrometric analyses, in conjunction with other characterization, have determined its molecular formula to be Au333(SR)79 (where SR = SCH2CH2Ph). This giant gold nanomolecule exhibits face-centered cubic (fcc) structure and surface plasmon resonance at approximately 520 nm in the optical spectrum.
Results and Discussions
Synthesis and Characterization of Atomically Precise Au333(SR)79 Nanocrystals.
The Au333(SR)79 nanocrystals were prepared via two primary steps (for details see Methods section). In the first step, polydisperse Au nanoparticles were synthesized by a modified Brust method (10, 19). Briefly, HAuCl4 was phase-transferred from an aqueous solution to the toluene phase with the aid of a phase transfer agent (tetraoctylammonium bromide, TOAB). Phenylethylthiol (PhCH2CH2SH, molar ratio Au∶S = 1∶2.0) was then added to the solution under vigorous magnetic stirring at room temperature. The solution gradually turned from deep red to yellow and finally to almost clear over approximately 15 min. An aqueous NaBH4 solution (molar ratio NaBH4∶Au = 10∶1) was rapidly added to the reaction mixture all at once. The reaction was allowed to proceed for approximately 12 h at room temperature. Then, the toluene phase (containing Au nanoparticles) was collected and dried by rotary evaporation. Acetone was added to separate Au nanoparticles from TOAB and other by-products. In the second step, the polydisperse Au nanoparticles from the first step were subject to size-focusing, which is critical to achieve molecular purity. To do so, the nanoparticles were dissolved in mixed toluene/PhCH2CH2SH (1∶1, v/v), and the solution was heated to 90 °C and maintained at this temperature for approximately 12 h. During this process, those less stable nanoparticles were crashed or converted to the most stable size. Finally, the survived Au nanoparticles were washed with ethanol and then with acetone to remove excess thiol and some small Au clusters, followed by extraction with a mixed solvent of toluene/acetonitrile (1∶1, v/v).
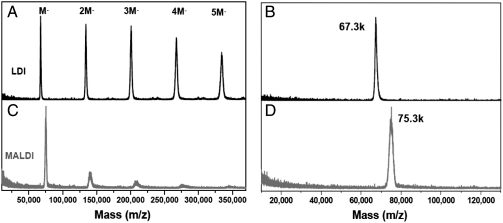
The purity of the as-prepared Au nanoparticles was first checked by laser desorption ionization (LDI) and matrix-assisted laser desorption ionization (MALDI) mass spectrometric analyses. As shown in Fig. 1A, the LDI mass spectrum shows a series of peaks with equal spacing of 67.3 kDa (k = 1,000). The first peak is at 67.3 kDa (singly charged, Fig. 1B), which is from the nanoparticle core (in the ionized form, AuxS-y). The peaks at 134, 201, 267, and 334 kDa (all singly charged) are corresponding to the dimer, trimer, tetramer, and pentamer ions of the 67.3 kDa primary ion, respectively; note that these oligomers are formed in gas phase during the LDI process, rather than being present in the original product. No other peaks are observed in the wide range from 500 to 500,000 Da (see Fig. S1), indicating that the as-prepared product consists of a single species with a core mass of 67.3 kDa.
Fig. 1.
LDI (black profiles) and MALDI (red profiles) mass spectra of the Au nanoparticle. (A) and (C) show the spectra in the 10,000 to 370,000 range; (B) and (D) show the zoom-in spectra.
We have further performed MALDI-MS analysis using trans-2-[3-(4-tertbutylphenyl)-2-methyl-2-propenylidene]malononitrile (DCTB) as a matrix (20). A dominant peak at 75.3 kDa was found (Fig. 1C), which is higher in mass than the LDI-determined 67.3 kDa, implying that ligand loss occurred in the LDI process, which is due primarily to the breaking of S–C bonds and loss of CH2CH2Ph fragments. We observed that the gas-phase dimer, trimer, tetramer, and pentamer peaks in the MALDI process are significantly smaller than in the LDI process (Fig. 1 A and C). Thus, DCTB matrix can largely suppress the loss of ligands (CH2CH2Ph) from the ionized nanoparticle as well as gas-phase oligomerization. However, one should be cautious in concluding that the MALDI-determined 75.3 kDa is the total mass of the intact molecular ion of the nanoparticle, as MALDI may still be somewhat destructive; further verification is needed, especially in determining the exact mass of the nanopoarticle for formula assignment. Nevertheless, the above wide-range LDI and MALDI mass spectra clearly demonstrate that the as-synthesized nanoparticles are highly uniform.
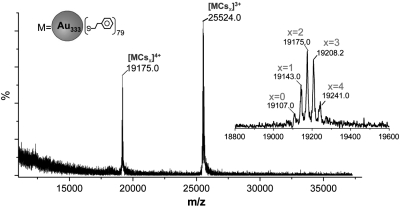
To determine the exact molecular mass of the nanoparticle, we have performed electrospray ionization (ESI) mass spectrometry analysis. ESI-MS is a much softer ionization technique compared to LDI and MALDI methods. To promote nanoparticle ionization, CsOAc was added to the 75.3 kDa nanoparticle solution. In the ESI process, Cs+ ions can form MCsx adducts (x = 1, 2, 3, etc.), where M represents the nanoparticle. As shown in Fig. 2, two sets of nanoparticle ion peaks centered at m/z 19,175 and 25,524, respectively, are observed in the ESI-MS spectrum of the nanoparticle. The zoom-in spectrum of the m/z 19,175 set shows a peak spacing of 33 (Fig. 2, Inset), which corresponds to 1/4 of the atomic mass of Cs+, thus, this set of peaks consists of 4+ charged MCsx adducts. Similarly, the m/z 25,524 set consists of 3+ ions (peak spacing 44 = 1/3mCs).
Fig. 2.
The wide-range ESI-MS spectrum of the nanoparticle; the Inset shows the zoom-in spectrum of the 4+ ion set centered at m/z 19,175.0.
We choose the 4+ ion set for a detailed analysis to determine the exact molecular mass of the nanoparticle. This set comprises peaks at m/z 19,107.0, 19,143.0, 19,175.0, 19,208.2, and 19,241.0 (Fig. 2, Inset), which are assigned as [MCsx]4+ adducts (x = 0 to 4). It is worth noting that the nanoparticle charge number does not necessarily correlate to the number of Cs+ added to the nanoparticle, as the nanoparticle core may undergo ionization in the presence of Cs+. The first peak (i.e., the lowest m/z ∼ 19,107, weak) is due to induced ionization of the neutral nanoparticle in the presence of Cs+. Of note, the possibility of m/z ∼ 19,107 being the monoadduct [MCs1]4+ is ruled out (see the note to Table S1). To improve the accuracy of data analysis, we took the five (m/z) peak values and performed a linear regression, y = a + bx, where, x refers to the number of attached Cs+ in the adduct (see Fig. S2). This gives rise to y = 76,432.8 + 133.3x with an excellent regression coefficient R2 = 0.99953. The slope of 133.3 corresponds to the atomic mass of Cs+ (standard value: 133). The intercept, 76,432.8 (standard deviation σ = ± 3.5), is the precise molecular mass of the nanoparticle, which is slightly higher than the MALDI-determined 75.3 kDa, note that ESI is more accurate than MALDI.
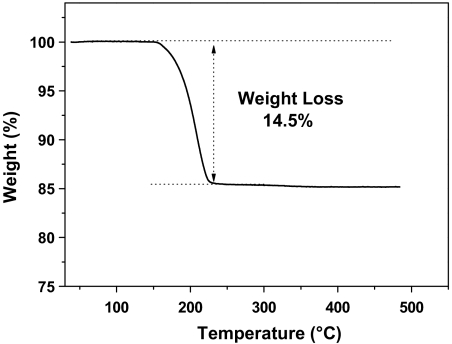
With the precise molecular mass determined, we subsequently deduce the nanoparticle formula by finding the mass-matched Aun(SCH2CH2Ph)m formula (where n and m are the respective number of gold atoms and ligands). The high molecular mass may give rise to many (n,m) combinations and the deduction would be nontrivial and time-consuming. Herein, an easier way is to determine the gold-to-thiolate ratio, which will largely narrow down the (n,m) range; then, one can compare each candidate formula with the precise molecular mass determined by ESI-MS to find the closest match. To determine the Au/SR ratio, we performed thermogravimetric analysis (TGA). In TGA analysis, the thiolated nanoparticles lose thiolates at approximately 200 °C; the thiolates form disulfide and vaporizes. TGA analysis shows a weight loss of 14.5%, (Fig. 3), hence, the Au/SR ratio is 1/0.24. Accordingly, the rough values of (n,m) are n ∼ 332 and m ∼ 80. Next, we expand the range of n to search for the matched formula (see Table S1), which finally gives rise to Au333(SR)79 (theoretical mass: 76,430.3), matching closely with the ESI-MS determined value (76,432.8). A deviation of 2.5 Da is reasonable at this high mass. All other (n,m) combinations have larger deviations (> 15 Da) and hence are ruled out. It should be stressed that our determination of the Au333(SR)79 formula is based upon the precise ESI-MS result, rather than the TGA result; the latter only helps narrow down the search range of the (n,m) ratio.
Fig. 3.
Thermogravimetric analysis (TGA) of the nanoparticle.
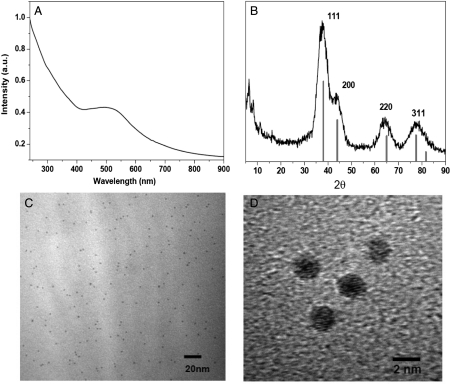
This giant Au333(SR)79 nanocrystal molecule exhibits some interesting properties. The optical absorption spectrum shows a surface plasmon resonance (SPR) band at 520 nm (Fig. 4A), which indicates that this size is already in the metallic size regime; note that we take the SPR band as an indication or signature of metallic state. The plasmonic property of Au333(SR)79 is in striking contrast with the smaller Aun(SR)m nanoclusters (n = 25, 38, 102, 144) reported previously that are semiconducting and no SPR band is observed in the nanoclusters, instead, they show step-like multiple bands in their optical spectra (21–30).
Fig. 4.
UV-vis absorption spectrum (A), powder X-ray diffraction pattern (B), TEM (C), and HRTEM (D) of Au333(SR)79 nanoparticles.
With respect to the structure of the Au333(SR)79 nanoparticle, powder XRD analysis shows that fcc structure is adopted in this nanoparticle (Fig. 4B), evidenced by the close match of all the diffraction peaks with the standard fcc pattern (see the red stick pattern in Fig. 4B). Transmission electron microscopy (TEM) analysis shows monodisperse (diameter: 2.2 nm) nanoparticles (Fig. 4C), and fcc lattice fringes can be clearly observed (Fig. 4D). Thus, both XRD and high-resolution TEM confirm the fcc structure of the Au333(SR)79 nanoparticle; note that powder XRD and TEM studies cannot reveal the total atomic structure of the Au333(SR)79 nanocrystal molecule. We hope to determine the total structure of Au333(SR)79 in future efforts.
Origin of Extraordinary Stability of Au333(SR)79 Nanocrystals.
The giant, plasmonic Au333(SR)79 nanomolecule raises a major question: what determines its extraordinary stability? This is a fundamental issue in nanoscience (31, 32). From the synthesis, we found that the size-focusing step is critical for obtaining monodispere Au333(SR)79 nanomolecules. For smaller Aun(SR)m nanoclusters (n = 25, 38, 102), a superatom model has been put forth to account for the peculiar stability of these magic-sized nanoclusters (33, 34). Herein, we take a free electron model of the nanoparticle (radius a) by ignoring the electron-electron and electron-Au+ ion interactions and solve the Schrödinger equation in a spherically symmetric potential (V = 0 for r < a and V = ∞, r > a) in the spherical coordinates (r,θ,φ):
- Radial equation:

[1] - Angular equation:

[2]
The energy eigenvalues are
 |
[3] |
The term αn,l represents the nth zero of the lth spherical Bessel function of the first kind jl+1/2(βr) with  . Table S2 lists the nth zeros of the lth Bessel functions. With these αn,l values, we then construct the electron energy levels; for convenience, we label such energy levels with (n + 1,l) using atomic-like notations, such as 1s, 1p, 1d, etc. The symbols are as follows,
Orbital quantum number (l): 0, 1, 2, 3, 4, 5, 6, 7, 8, 9, 10, 11 …
Atomic-like notation: s, p, d, f, g, h, i, j, k, l, m, n …
We consider Au(6s) electrons as free electrons (i.e. detached from Au atoms) and assume each thiolate localizes one electron, i.e. 333 - 79 = 254e for Au333(SR)79. The 254 free valence electrons indeed point to electron shell closing, i.e. 1s2 1p6 1d10 2s2 1f14 2p6 1g18 2d10 1h22 3s22f141i26 3p6 1j30 2g18 3d10 4s2 1k34 2h22 (with the next empty orbital 3f). Thus, the particular stability of Au333(SR)79 molecules may, in part, arise from electron shell closing. It is noteworthy that the electron shell closing number of 254 was previously discussed in the research work on gas-phase aluminum clusters (35).
Next, we construct an atomic model of the Au333(SR)79 nanocrystal molecule. Previous work has revealed the crystallographic structures of Au102(SR)44, Au38(SR)24, and Au25(SR)18, in which SR-Au-SR and SR-Au-SR-Au-SR “staple” motifs were found (23–26). By adopting such surface binding motifs, a candidate structural model of Au333(SR)79 is composed of a Au293 core with a surface protecting shell of Au40(SR)79. Simulations indeed reveal that the fcc-crystalline Au293 core consists of a magic-numbered, cuboctahedral Au147 kernel enclosed in a cage of Au146 (Scheme 1). Note that the cuboctahedral structure is identical to the fcc structure. Thus, the particular stability of Au333(SR)79 also points to atomic shell closing. Previous work by Schmid et al. discussed that atomic shell closing gives rise to discrete sizes of 13, 55, 147, 309, 561, etc. (15). Among them, the small discrepancy between n = 309 and the Au293 core or the Au333(SR)79 entity should be caused by the special bonding requirements of surface thiolates.
Scheme 1.
Atomic model for the fcc Au293 core in the Au333(SR)79 nanocrystal molecule.
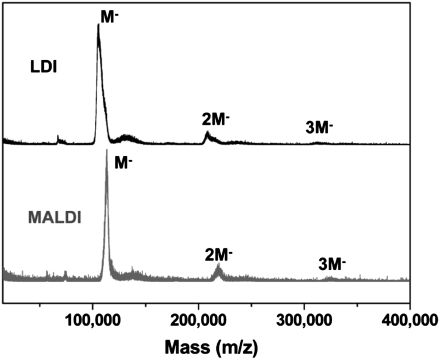
The above electron and atomic shell closing arguments have interpreted the peculiar stability of the Au333(SR)79 nanomolecule. We believe that the atomic shell closing plays a more significant role than electron shell closing, since the electron energy level spacing in Au333(SR)79 is small and surface plasmon excitation can occur. Guided by the atomic shell closing growth mode, one predicts that the next particularly stable size would be around Au561 (i.e., five shell closing). In consideration of the special bonding requirements of thiolates, the exact atomic number may have a small discrepancy. Significantly, our synthetic search indeed shows that the next robust size is Au∼530(SR)∼100; no intermediate sizes of extraordinary stability between Au333(SR)79 and Au∼530(SR)∼100 were found. While this huge molecule is still not amenable to ESI-MS analysis at this point, LDI and MALDI mass spectrometry analyses show that the core mass is approximately 108.5 kDa and the MALDI-determined mass is approximately 118 kDa (Fig. 5), corresponding to a formula of Au∼530(SR)∼100 (both the gold atom and ligand numbers may be deviated by ± 5). This result strongly indicates that atomic shell closing contribute, to a large extent, to the stability of fcc-structured, magic-sized Au nanocrystal molecules.
Fig. 5.
LDI (black profile) and MALDI (red profile) mass spectra of a larger Au nanoparticle.
Conclusions
In summary, we have prepared an atomically precise, nanocrystalline Au333(SCH2CH2Ph)79 molecule. The extraordinary stability of size-discrete plasmonic nanocrystal molecules is found to be largely contributed by atomic shell closing. This work opens up new opportunities for investigating many fundamentally important issues of nanocrystals, such as the semiconducting to metallic state transition and the structural transition and their correlations. The future pursuit of atomically precise nanocrystals is expected to significantly advance the understanding of the fundamental science of metal nanoparticles and will potentially impact condensed matter physics, nanochemistry, and catalysis.
Methods
Chemicals.
2-Phenylethanethiol (PhCH2CH2SH, 99%, Aldrich), Sodium borohydride (NaBH4, 99.99%, Aldrich), Tetrachloroauric(III) acid (HAuCl4·3H2O, 99.99%, Aldrich), Acetone (HPLC grade, 99.9%, Aldrich), Toluene (HPLC grade, 99.9%, Aldrich), Acetonitrile (HPLC grade, 99.9%, Acros Organics), Ethanol (HPLC grade, Aldrich), and Dichloromethane (HPLC grade, 99.9%, Aldrich) were used as received.
Synthesis of Au333(SR)79 nanoparticles.
The Au333(SR)79 nanoparticles were prepared via two primary steps. In the first step, polydisperse Au nanoparticles were synthesized by a modified Brust method. HAuCl4·3H2O (0.138 g, 0.35 mmol) was dissolved in 5 mL nanopure water, and TOAB (0.222 g, 0.406 mmol) was dissolved in 10 mL toluene. The two solutions were combined in a 50 mL flask and the mixture was vigorously stirred until Au(III) was completely transferred from aqueous solution to toluene. The clear aqueous phase was removed by using a 10 mL syringe. Then, PhCH2CH2SH (0.097 mL, molar ratio Au∶S = 1∶2.0) was added while the reaction mixture was under vigorous magnetic stirring at room temperature. The deep red solution gradually turned yellow and finally nearly clear in about 15 min. After that, NaBH4 (0.133 g, 3.5 mmol, dissolved in 6 mL cold Nanopure water) was rapidly added to the solution all at once. The color of solution immediately changed to black. The reaction was allowed to proceed for approximately 12 h. After approximately 12 h, the aqueous phase was discarded and the black toluene phase was dried by rotary evaporation. Acetone was used to separate the Au nanoparticles (polydisperse) from TOAB and other small Au clusters. In the second step, the as-prepared polydisperse Au nanoparticles were dissolved in 2 mL toluene and 2 mL PhCH2CH2SH. The solution was heated at 90 °C for around 12 h. After that, the Au nanoparticles were thoroughly washed with acetone to remove the excess thiols and small Au clusters. Then, Au333(SR)79 were extracted with a mixed solvent of toluene/acetonitrile (1∶1, v/v).
Characterizations.
Matrix-assisted laser desorption ionization (MALDI) mass spectrometry was measured with a PerSeptiveBiosystems Voyager DE super-STR time-of-flight (TOF) mass spectrometer. Trans-2-[3-(4-tert-butylphenyl)-2-methyl-2-propenyldidene] malononitrile (DCTB) was used as the matrix (20). Typically, 1 mg matrix and 0.1 mg analyte stock solution were mixed in 100 μL of CH2Cl2. 10 μL solution was applied to the steel plate and then air-dried. Electrospray ionization (ESI) mass spectra were recorded using a Waters Q-TOF mass spectrometer equipped with Z-spray source. The source temperature was kept at 70 °C. The sample was directly infused into the chamber at 5 μL/ min. The spray voltage was kept at 2.20 kV and the cone voltage at 60 V. The ESI sample was dissolved in toluene (1 mg/mL) and diluted (1∶2 v) by dry methanol (containing 50 mM CsOAc to enhance cluster ionization in ESI). UV-vis spectra of the Au clusters (dissolved in CH2Cl2) were acquired on Hewlett- Packard (HP) Agilent 8453 diode array spectrophotometer at room temperature. Thermal gravimetric analysis (TGA) (typically approximately 2.5 mg sample used) was obtained on a TG/DAT6300 analyzer (Seiko Instruments, Inc) under a N2 atmosphere (flow rate of approximately 50 mL/ min).
Supplementary Material
ACKNOWLEDGMENTS.
We thank Dr. Zhongrui Zhou for assistance in ESI-MS analysis, Dr. Noel T. Nuhfer for assistance in HR-TEM and Dr. Yixin Zhao for assistance with structural modeling. This material is based upon work supported by the Air Force Office of Scientific Research under AFOSR Award No. FA9550-11-1-9999 (FA9550-11-1-0147) and the Camille Dreyfus Teacher-Scholar Awards Program. R.J. is a Camille Dreyfus Teacher-Scholar.
Footnotes
The authors declare no conflict of interest.
This article is a PNAS Direct Submission.
This article contains supporting information online at www.pnas.org/lookup/suppl/doi:10.1073/pnas.1115307109/-/DCSupplemental.
References
- 1.Jin R, et al. Controlling anisotropic nanoparticle growth through plasmon excitation. Nature. 2003;425:487–490. doi: 10.1038/nature02020. [DOI] [PubMed] [Google Scholar]
- 2.Burda C, Chen X, Narayanan R, El-Sayed MA. Chemistry and properties of nanocrystals of different shapes. Chem Rev. 2005;105:1025–1102. doi: 10.1021/cr030063a. [DOI] [PubMed] [Google Scholar]
- 3.Wang H, Brandl DW, Nordlander P, Halas NJ. Plasmonic nanostructures: Artificial molecules. Acc Chem Res. 2007;40:53–62. doi: 10.1021/ar0401045. [DOI] [PubMed] [Google Scholar]
- 4.Sun YG, Xia YN. Shape-controlled synthesis of gold and silver nanoparticles. Science. 2002;298:2176–2179. doi: 10.1126/science.1077229. [DOI] [PubMed] [Google Scholar]
- 5.Murphy CJ, et al. The many faces of gold nanorods. J Phys Chem Lett. 2010;1:2867–2875. [Google Scholar]
- 6.Stoeva SI, et al. Reversible transformations of gold nanoparticle morphology. Langmuir. 2005;21:10280–10283. doi: 10.1021/la051699v. [DOI] [PubMed] [Google Scholar]
- 7.Faraday M. Experimental relations of gold (and other metals) to light. Philos Trans R Soc London. 1857;147:145–181. [Google Scholar]
- 8.Turkevich J, Stevenson PC, Hiller J. A study of the nucleation and growth processes in the synthesis of colloidal gold. Discuss Faraday Soc. 1951;11:55. [Google Scholar]
- 9.Frens G. Controlled nucleation for the regulation of the particle size in monodisperse gold suspensions. Nature: Phys Sci. 1973;241:20–22. [Google Scholar]
- 10.Brust M, Walker M, Bethell D, Schiffrin DJ, Whyman R. Synthesis of thiol-derivatized gold nanoparticles in a two-phase liquid-liquid system. J Chem Soc Chem Commun. 1994:801–802. [Google Scholar]
- 11.Whetten RL, et al. Nanocrystal gold molecules. Adv Mater. 1996;8:428–433. [Google Scholar]
- 12.Chen S, Murray RW. Arenethiolate monolayer-protected gold clusters. Langmuir. 1999;15:682–689. [Google Scholar]
- 13.DeVries GA, et al. Divalent metal nanoparticles. Science. 2007;315:358–361. doi: 10.1126/science.1133162. [DOI] [PubMed] [Google Scholar]
- 14.Rosi NL, et al. Oligonucleotide-modified gold nanoparticles for intracellular gene regulation. Science. 2006;312:1027–1030. doi: 10.1126/science.1125559. [DOI] [PubMed] [Google Scholar]
- 15.Schmid G. The relevance of shape and size of Au55 clusters. Chem Soc Rev. 2008;37:1909–1930. doi: 10.1039/b713631p. [DOI] [PubMed] [Google Scholar]
- 16.Zhu Y, Qian H, Drake BA, Jin R. Atomically precise Au25(SR)18 nanoparticles as catalysts for the selective hydrogenation of a, b-unsaturated ketones and aldehydes. Angew Chem Int Ed. 2010;49:1295–1298. doi: 10.1002/anie.200906249. [DOI] [PubMed] [Google Scholar]
- 17.Tsukuda T, Tsunoyama H, Sakurai H. Aerobic oxidations catalyzed by colloidal nanogold. Chem Asian J. 2011;6:736–748. doi: 10.1002/asia.201000611. [DOI] [PubMed] [Google Scholar]
- 18.Jin R. Quantum sized, thiolate-protected gold nanoclusters. Nanoscale. 2010;2:343–362. doi: 10.1039/b9nr00160c. [DOI] [PubMed] [Google Scholar]
- 19.Alvarez MM, et al. Optical absorption spectra of nanocrystal gold molecules. J Phys Chem B. 1997;101:3706–3712. [Google Scholar]
- 20.Dharmaratne AC, Krick T, Dass A. Nanocluster size evolution studied by mass spectrometry in room temperature Au25(SR)18 synthesis. J Am Chem Soc. 2009;131:13604–13605. doi: 10.1021/ja906087a. [DOI] [PubMed] [Google Scholar]
- 21.Schaaff TG, et al. Isolation of smaller nanocrystal Au molecules: Robust quantum effects in optical spectra. J Phys Chem B. 1997;101:7885–7891. [Google Scholar]
- 22.Shichibu Y, Negishi Y, Tsukuda T, Teranishi T. Large-scale synthesis of thiolated Au25 clusters via ligand exchange reactions of phosphine-stabilized Au11 clusters. J Am Chem Soc. 2005;127:13464–13465. doi: 10.1021/ja053915s. [DOI] [PubMed] [Google Scholar]
- 23.Heaven MW, Dass A, White PS, Holt KM, Murray RW. Crystal structure of the gold nanoparticle [N(C8H17)4][Au25(SCH2CH2Ph)18] J Am Chem Soc. 2008;130:3754–3755. doi: 10.1021/ja800561b. [DOI] [PubMed] [Google Scholar]
- 24.Zhu M, Aikens CM, Hollander FJ, Schatz GC, Jin R. Correlating the crystal structure of a thiol-protected Au25 cluster and optical properties. J Am Chem Soc. 2008;130:5883–5885. doi: 10.1021/ja801173r. [DOI] [PubMed] [Google Scholar]
- 25.Qian H, Eckenhoff WT, Zhu Y, Pintauer T, Jin R. Total structure determination of thiolate-protected Au38 nanoparticles. J Am Chem Soc. 2010;132:8280–8281. doi: 10.1021/ja103592z. [DOI] [PubMed] [Google Scholar]
- 26.Jadzinsky PD, Calero G, Ackerson CJ, Bushnell DA, Kornberg RD. Structure of a thiol monolayer-protected gold nanoparticle at 1 1 Å resolution. Science. 2007;318:430–433. doi: 10.1126/science.1148624. [DOI] [PubMed] [Google Scholar]
- 27.Shibu ES, Muhammed MAH, Tsukuda T, Pradeep T. Ligand exchange of Au25SG18 leading to functionalized gold clusters: Spectroscopy, kinetics, and luminescence. J Phys Chem C. 2008;112:12168–12176. [Google Scholar]
- 28.Quinn BM, Liljeroth P, Ruiz V, Laaksonen T, Kontturi K. Electrochemical resolution of 15 oxidation states for monolayer protected gold nanoparticles. J Am Chem Soc. 2003;125:6644–6645. doi: 10.1021/ja0349305. [DOI] [PubMed] [Google Scholar]
- 29.Chaki NK, Negishi Y, Tsunoyama H, Shichibu Y, Tsukuda T. Ubiquitous 8 and 29 kDa gold: Alkanethiolate cluster compounds: Mass-spectrometric determination of molecular formulas and structural implications. J Am Chem Soc. 2008;130:8608–8610. doi: 10.1021/ja8005379. [DOI] [PubMed] [Google Scholar]
- 30.Qian H, Jin R. Controlling nanoparticles with atomic precision: The case of Au144(SCH2CH2Ph)60. Nano Lett. 2009;9:4083–4087. doi: 10.1021/nl902300y. [DOI] [PubMed] [Google Scholar]
- 31.Schnockel H. Structures and properties of metalloid Al and Ga clusters open our eyes to the diversity and complexity of fundamental chemical and physical processes during formation and dissolution of metals. Chem Rev. 2010;110:4125–4163. doi: 10.1021/cr900375g. [DOI] [PubMed] [Google Scholar]
- 32.Reber AC, Khanna SN, Castleman AW. Superatom compounds, clusters, and assemblies: Ultra alkali motifs and architectures. J Am Chem Soc. 2007;129:10189–10194. doi: 10.1021/ja071647n. [DOI] [PubMed] [Google Scholar]
- 33.Walter M, et al. A unified view of ligand-protected gold clusters as superatom complexes. Proc Natl Acad Sci USA. 2008;105:9157–9162. doi: 10.1073/pnas.0801001105. [DOI] [PMC free article] [PubMed] [Google Scholar]
- 34.Reimers JR, Wang Y, Cankurtaran BO, Ford MJ. Chemical analysis of the superatom model for sulfur-stabilized gold nanoparticles. J Am Chem Soc. 2010;132:8378–8384. doi: 10.1021/ja101083v. [DOI] [PubMed] [Google Scholar]
- 35.Persson JL, Whetten RL, Cheng HP, Berry RS. Evidence for quantized electronic level structure for 100–1300 electrons in metal-atomic clusters. Chem Phys Lett. 1991;186:215–222. [Google Scholar]
Associated Data
This section collects any data citations, data availability statements, or supplementary materials included in this article.


