Abstract
In our previous study of the fatal R160Q mutant of human sulfite oxidase (hSO) at low pH (Astashkin et al. J. Am. Chem. Soc. 2008, 130, 8471–8480) a new Mo(V) species, denoted “Species 1”, was observed at low pH values. Species 1 was ascribed to a six-coordinate Mo(V) center with an exchangeable terminal oxo ligand and an equatorial sulfate group on the basis of pulsed EPR spectroscopy and 33S and 17O labeling. Here we report new results for Species 1 of R160Q, based on substitution of the sulfur-containing ligand by a phosphate group, pulsed EPR spectroscopy in Ka- and W-bands, and extensive density functional theory (DFT) calculations applied to large, more realistic molecular models of the enzyme active site. The combined results unambiguously show that Species 1 has an equatorial sulfite as the only exchangeable ligand. The two types of 17O signals that are observed arise from the coordinated and remote oxygen atoms of the sulfite ligand. A typical five-coordinate Mo(V) site is compatible with the observed and calculated EPR parameters.
Introduction
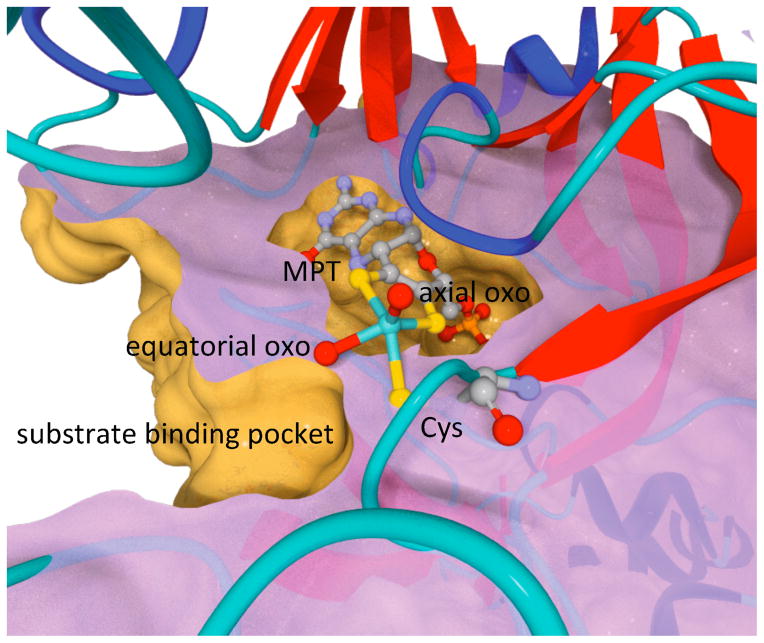
Sulfite oxidizing enzymes (SOEs), including prokaryotic sulfite dehydrogenase (SDH) and eukaryotic sulfite oxidase (SO), are biologically ubiquitous and catalyze the two-electron oxidation of sulfite (SO3 2−) to sulfate (SO4 2−).1, 2 SO is vital for normal neonatal neurological development in humans.3–5 All known SOEs possess a five-coordinate molybdenum active center that has an approximately square-pyramidal geometry, with an axial oxo ligand, three non-exchangeable equatorial sulfur ligands, and an exchangeable equatorial ligand (Figure 1).6–10 Two of the sulfur ligands are provided by the pyranopterindithiolate cofactor (also called “molybdopterin”, MPT) and one sulfur ligand comes from a conserved cysteine residue.
Figure 1.
Active site of SO rendered from the 1.9 Å chicken SO structure, pdb 1SOX.6 The molybdopterin (MPT), the conserved Mo-bound Cys residue (C185 and C207 in chicken and human SO, respectively), the axial and equatorial oxo ligands, and Mo are shown as ball-and-stick (blue-green = Mo, red = O, yellow = S, gray = C, orange = P, and purple = N). The protein is displayed as ribbons and a cross-section to reveal the surfaces of the substrate and cofactor pockets and their relative orientations.
The identity of the exchangeable equatorial ligand, which occupies the substrate binding pocket, depends on the stage of the catalytic cycle, during which the molybdenum is reduced from Mo(VI) to Mo(IV) upon binding sulfite and is then reoxidized by two successive intramolecular electron transfer steps through a Mo(V) intermediate.11 In SDH and all non-plant forms of SO, integral heme centers accept the electrons from the reduced molybdenum center.
The intermediate Mo(V) state is paramagnetic (S = 1/2), and electron paramagnetic resonance (EPR) spectroscopy has been instrumental in providing information about the nature and geometry of the exchangeable ligand and its role in the catalytic cycle as a function of pH, organism, mutation, and the presence of specific anions in the buffer.11–18 The results of numerous EPR investigations, which involved high-resolution pulsed EPR techniques such as electron spin echo (ESE) envelope modulation (ESEEM) and pulsed electron-nuclear-double resonance (ENDOR) have been summarized in recent reviews.11, 19 For wild type (wt) vertebrate SO in the Mo(V) state and in the absence of inhibiting anions (e.g., PO4 3−, AsO4 3−) the exchangeable equatorial ligand is known to be hydroxide.20 The orientation of this −OH ligand depends on the buffer pH, however, and the corresponding structural forms, which result in very different EPR spectra, were historically labeled “low-pH” (lpH, pH ≤ 7) and “high-pH” (hpH, pH ≥ 9).13, 21
Quite different spectroscopic results were obtained for the low-pH sample of plant SO from Arabidopsis thaliana (At-SO), however, where the two-electron reduction of the Mo(VI) center with sulfite was followed by a one-electron oxidation by ferricyanide22 and resulted in the Mo(V) being coordinated by a substrate-derived ligand that was assigned as sulfate,23, 24 in agreement with the proposed product-bound intermediate in the catalytic cycle.1 This form of SO was called blocked, based on a hypothesis that the sulfate product was shielded from hydrolysis by some steric block, creating a trapped enzyme-product (EP) complex. A similar type of blocked form was also obtained for low-pH samples of various SOE mutants25, 26 and for the chloride-depleted low-pH samples of wt human SO (hSO).27
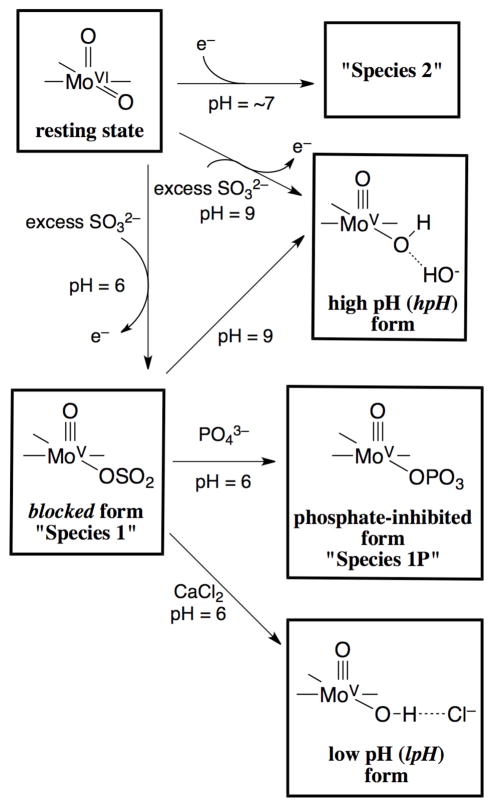
Most SO samples prepared in the absence of inhibiting anions give EPR spectra that correspond to the normal hpH, lpH, and blocked forms described above. The R160Q human SO (hSO) mutant, however, produces very different EPR spectra at low and intermediate pH values (pH ≤ 8).28 In this clinically important mutant, the arginine residue (R160) located next to the Mo ion, trans to the apical oxo ligand, is replaced by glutamine. The structural modifications effected by this mutation dramatically alter the EPR spectra observed at low and intermediate pH values. Instead of the regular lpH species, having an exchangeable −OH ligand, being observed, a variation of the blocked form (denoted “Species 1”) is detected at low pH. At intermediate pH values, another variant (denoted “Species 2”) is observed, with a maximum yield obtained at about pH 7. At high pH, the usual hpH species is formed. The conditions for formation of Species 1 and 2 and other species that are related to this work are presented in Scheme 1.
Scheme 1.
Preparations of the various R160Q hSO species and schematic representations of each of their 5-coordinate Mo centers. The straight lines in the chemical structures denote the coordinated sulfur atoms from the conserved cysteine and the MPT (Figure 1).
Species 1 has been characterized in some detail by pulsed EPR methods using both 33S-enriched sulfite and 17O-enriched water.11, 27 The observation of characteristic 33S ESEEM has established that Species 1 is indeed a blocked form, as was initially postulated based on the lack of an observable −OH ligand proton.24 17O ESEEM has revealed two types of oxygen nuclei: (1) a strongly coupled oxygen with a hyperfine interaction (hfi) constant (A) of ~18 MHz and (2) a weakly coupled oxygen with A ≅ 5 MHz. The strongly and weakly coupled oxygen signals were initially assigned to the exchangeable equatorial ligand and to the oxo ligand, respectively.11 Compared to the oxo ligand of the model oxo-molybdenum compound [Mo(V)17O(SPh)4]−,29 or of hpH SO,30 the assigned oxo ligand of Species 1 was found to have a significantly larger nuclear quadrupole interaction (nqi) with a nuclear quadrupole coupling constant (χ ≡ e2Qq/h) of ~5 MHz. The substantially larger value of χ for R160Q hSO (4× that of either [Mo(V)17O(SPh)4]− or hpH SO) was tentatively explained by the possibility of Q160 coordinating to Mo(V) trans to the axial oxo group to form a 6-coordinate metal center with a weakened oxo-Mo(V) bond.31 A six-coordinate Mo center involving glutamine coordination was proposed previously for R160Q by Doonan, et al.28 Results from a 6-coordinate oxo-Mo(V) model compound, (dttd)Mo(V)17O(17OTMS), further supported this idea.31 Our subsequent research, however, based largely on density functional theory (DFT) results,11 including new results reported in this work, has led us to reject this hypothesis as well as the entire premise that the equatorial ligand of the blocked species should, in fact, be assigned to a sulfate ligand.
A more fundamental consideration of the experimental results to date also creates additional doubt regarding the assignment of sulfate as the equatorial ligand of the blocked forms. The relatively large values of χ measured for the 33S of several blocked forms (ranging from 26 – 40 MHz),23, 25, 27, 31 for example, appear to be far too large to originate from a sulfur nucleus located at the center of the very symmetric electric field created within sulfate (which is tetrahedral and should give a χ value for 33S that approaches zero).11 The less symmetric electric field gradient created by trigonal pyramidal sulfite, however, should produce a strong 33S nqi. Indeed, our recent preliminary DFT calculations support this notion.11 Also, since the blocked forms, including Species 1, are all observed at low pH, exchange of the oxo ligand is unlikely since the yield of the 17O-labeled oxo ligand in lpH SO is negligible, even after incubation of the sample in 17O-enriched buffer over many hours.31 In contrast, a measurable yield of 17O-labeled oxo was observed in hpH SO for similar incubation times.32 Although the exact mechanism(s) of the oxo ligand exchange is not clear, these experiments indicate that the exchange should involve a hydroxide, which would be favored at higher buffer pH values. An additional consideration in analysis of the 17O-labeling results is that all of the oxygen atoms of sulfite exchange rapidly in water.33 Therefore, the observed weakly coupled 17O could potentially be assigned to one of the remote oxygen atoms of the equatorial ligand instead of to the oxo. This alternative explanation could account for the larger 17O χ for the “oxo” of blocked R160Q hSO.
As part of our effort in this work to determine the identity of the equatorial ligand of Species 1, here we report the simultaneous disappearance of the weakly coupled 17O ESEEM and emergence of 31P ESEEM (from the generated phosphate form)14 upon addition of phosphate to the buffer. This result indicates that the weakly coupled oxygen must belong to the exchangeable equatorial ligand and not to the axial oxo, in contrast to previous assignments.31 Additional pulsed EPR measurements for the strongly coupled equatorial 17O, in conjunction with extensive DFT calculations, have allowed the 17O and 33S spectroscopic parameters of all of these atoms to be approximated, thereby clarifying the identity of the equatorial ligand in Species 1. The new results presented here show that the blocked form of SOEs results from the coordination of substrate (sulfite), which is present in excess in in vitro studies, rather than from the coordination of product (sulfate) to the Mo(V) center.
Materials and Methods
Sample preparation
Recombinant R160Q hSO was expressed and purified as previously described.31 The samples of R160Q hSO at low pH in 17O-enriched water were prepared by first concentrating a 200 μL solution of the enzyme in 25 mM Bicine and 25 mM Pipes at pH 6.2 to reduce the amount of natural abundance water. Next, a solution of 25 mM Bicine and 25 mM Pipes buffer was vacuum centrifuged to evaporate the natural abundance water, and the pelleted buffer was redissolved in the same volume of H2 17O. The concentrated enzyme sample was then incubated for approximately three hours at 4 °C in 30 μL of the buffer prepared with H2 17O. Finally, the enzyme was reduced with a 20-fold excess sodium sulfite under argon, and the samples were immediately frozen in liquid nitrogen. The initial concentration of enzyme in the Mo(V) state was about 0.5 mM. For the ligand exchange experiments, a large excess of phosphate buffer or CaCl2 was added, and the thawed samples were then refrozen. The specific relative amounts of these reagents are given in the corresponding figure captions for each experiment. 17O-enriched, pH 5.4 phosphate buffer was prepared by vacuum centrifuging a 100 μL solution of 500 mM phosphate buffer prepared with natural abundance water, followed by redissolving the resulting buffer pellet into the same volume of 17O-enriched water. For all of these experiments, >90 atom % 17O-enriched water (Aldrich 609862) was used.
Pulsed EPR experiments
Pulsed EPR experiments were performed in two microwave (mw) bands. Ka-band (~30 GHz) measurements were performed on the homebuilt broadband spectrometer at the University of Arizona EPR Facility.34 W-band (~95 GHz) experiments were performed on the homebuilt pulsed spectrometer at the Weizmann Institute of Science (Israel).35 Data processing, which included standard low-order spline procedures for baseline removal, apodization, Fourier transforms, linear-phase corrections to account for dead-time effects, and symmetrization of 2D (two dimensional) HYSCORE (Hyperfine Sublevel CORrelation spectroscopy)36 in some cases, was performed using the SpecLab software,37 which is available free-of-charge online and includes detailed instructions for all of these procedures. Specific details of the experimental conditions are provided in the figure captions where appropriate.
DFT calculations
The ORCA computational package (version 2.8.0) was used for all quantum-chemical calculations.38 BP8639, 40 and B3LYP41, 42 functionals were used for the geometry optimization and property calculations, respectively, in conjunction with Ahlrich’s all-electron TZVP basis set.43–45 Relativistic effects were treated at the level of the zeroth order regular approximation (ZORA)46 in one-component form using the model potential of van Wüllen47 (as implemented in ORCA). For geometry optimizations, the one-center ZORA relativistic correction was used.48 The protein environment was modeled through dielectric continuum methods (conductor like screening model, COSMO)49 using a dielectric constant of four.50
Starting coordinates for the sulfate-bound model were prepared by modifying the solvent-exposed (equatorial) oxo ligand of the cSO crystal structure (pbd 1SOX)6 to a sulfato group and by selecting nearby amino acid residues (or fragments) and water molecules that define the substrate binding pocket and other important H-bonding interactions. This was done so that the geometry optimization step could be performed with as few biased geometric constraints as possible and so that the electric field gradient around the ligands could be modeled as accurately as possible, thus improving the general quality and significance of the final results. The geometry optimization calculation was carried out with only the protein backbone alpha carbon atoms (or residue side chain carbon closest to the alpha position where the backbone was not required) and water oxygen atoms constrained to their relative Cartesian coordinates, leaving all other atoms fully relaxed. The starting coordinates for the models with bound sulfite were prepared from the optimized sulfate model by successively removing the remote oxygen atoms from sulfate, then optimizing the models and calculating their properties as described for the sulfate model. The optimized atom coordinates for the sulfate- and sulfite-bound models, from which all properties were calculated, are provided in the Supporting Information.
Results and Discussion
1. Sulfur-containing ligand displacement experiments
Several experiments were performed to displace the sulfur-containing exchangeable ligand of Species 1 by adding either phosphate or CaCl2. The incentive for the phosphate experiments was outlined in the Introduction. The experiments involving the addition of CaCl2, however, were based on the presumption that it should be possible to shift the equilibrium from Species 1 toward Species 2 if the exchangeable ligand were sulfite. More specifically, the addition of CaCl2 to Species 1 should produce CaSO3, which is only slightly soluble in water.51, 52 Chloride occupies the binding pocket of the wt lpH forms of SO, as we have previously demonstrated,18, 27 but does not appear to be involved in the formation of the lpH forms of R160Q.53 In the case of sulfate coordination, however, no effect of CaCl2 on the equilibrium would be expected since the solubility of CaSO4 in water is relatively high.54 The limited amount of available purified enzyme restricted the number of conditions that could be tested to determine the effects of pH or the concentration of either phosphate or CaCl2 on the experimental results. The full results of the CaCl2 experiments, as well as the results of the phosphate experiments that are not presented in the main text, are provided in the Supporting Information. The CaCl2 experiments unexpectedly showed the conversion of Species 1 into the standard lpH form, not into Species 2. The detailed results of one of the phosphate experiments are described in the following section.
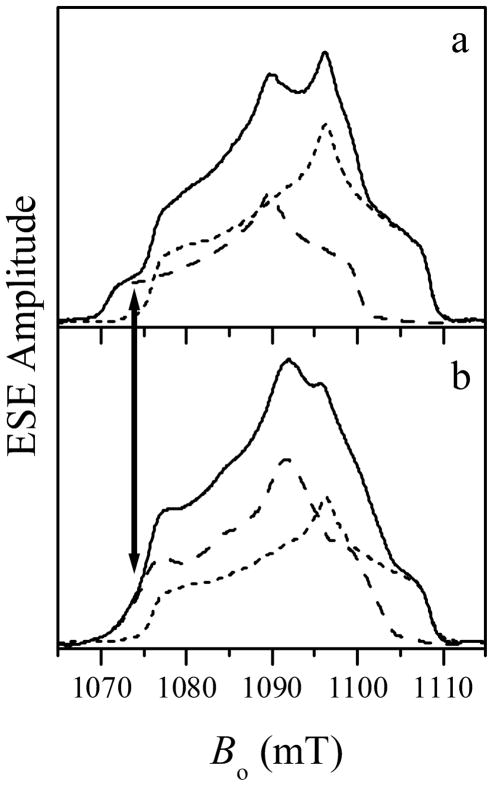
The solid trace in Figure 2a shows the Ka-band field sweep echo-detected spectrum of R160Q hSO at pH 6.4. Species 1 and Species 2 both contribute to this spectrum. The individual spectra of Species 1 and 2, obtained under different experimental conditions, are shown in the same figure by long- and short-dashed traces, respectively. The ESE field sweep spectrum obtained subsequent to the addition of phosphate buffer is shown by the solid trace in Figure 2b. As in Figure 2a, the short-dashed trace shows the contribution of Species 2. The disappearance of the characteristic low-field shoulder at Bo ≅ 1070 – 1075 mT, as well as changes in the central part of the spectrum, indicate that Species 1 was transformed into a different type of Mo(V) center, presumably a phosphate-coordinated species (Species 1P). This is shown by the difference between the experimental solid trace and the appropriately normalized spectrum of Species 2 as the long-dashed trace in Figure 2b. The principal g-values of Species 1P, (gx, gy, gz) ≈ (1.950, 1.968, 1.999), are somewhat different from those observed for the phosphate-inhibited (Pi) species of wt vertebrate SO, (gx, gy, gz) ≈ (1.961, 1.969, 1.992).14 Since there is significant disagreement between the g-values of Species 1P and Pi, the g-values do not confirm the generation of Pi. For this reason, ESEEM experiments were performed to establish the presence of the phosphate ligand in this newly generated form.
Figure 2.
Ka-band ESE-detected field sweep spectra of R160Q hSO (primary ESE). (a) Solid trace, the spectrum of the original sample at pH = 6.4, which contains contributions from Species 1 (long-dashed trace) and Species 2 (short-dashed trace). (b) Solid trace, the spectrum obtained after adding phosphate buffer, where the final concentration of phosphate was ~200 mM. The short- and long-dashed traces show the contributions from Species 2 and 1P (formed from Species 1). The spectrum of Species 1P (long-dashed) is the difference between the solid and short-dashed traces. Experimental conditions: mw frequency = 30.068 GHz; mw pulses, 2×12 ns; time interval between the mw pulses, τ = 200 ns; temperature = 21 K. The arrow shows the EPR position at which the ESEEM spectra of Figures 3 and 4 were obtained (Bo = 1074 mT).
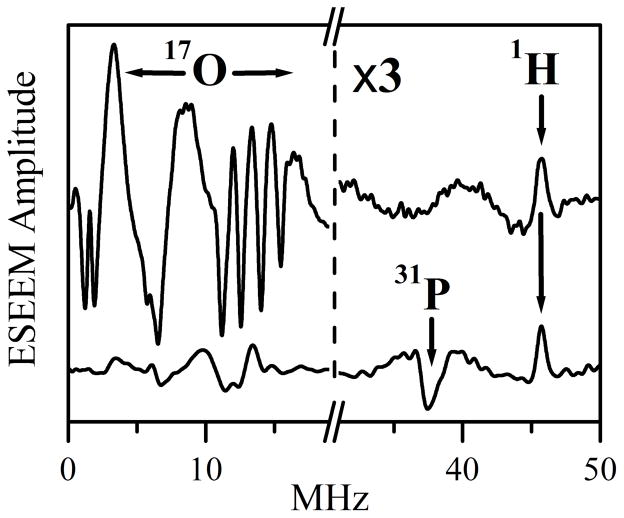
Figure 3 shows the cosine Fourier transformation (FT) spectra of the two-pulse ESEEM traces recorded at the EPR position indicated by the arrow in Figure 2. At this position the relative contributions of species 1P is maximized. The upper trace in Figure 3 corresponds to the initial sample and is primarily contributed to by Species 1. The lower trace corresponds to the sample after the addition of phosphate buffer and is contributed to primarily by Species 1P. Two features of the Species 1P ESEEM spectrum are most interesting within the context of this investigation. The first feature is the sum combination line of 31P (νσ ~ 37.5 MHz), which indicates the presence of a nearby 31P nucleus. The second is the dramatic decrease of the 17O ESEEM compared to the spectrum prior to the introduction of phosphate buffer. It is significant that only the sum combination line of the nearby 31P nucleus is observed in this ESEEM spectrum, while the fundamental lines are not readily observable. This situation mirrors that of the usual Pi species of wt SO12 and can be explained by the large width of the fundamental lines, which diminishes their amplitudes.
Figure 3.
Ka-band two-pulse ESEEM spectra (cosine FT) of Species 1 (upper trace) and Species 1P (lower trace) obtained at the EPR position indicated by the arrow in Figure 2. Experimental conditions: mw frequency = 30.068 GHz; Bo = 1074 mT; mw pulses, 2×12 ns; temperature = 21 K. For clarity, the modulation amplitudes to the right of the break in the x-axis have been magnified by a factor of 3. The proton matrix line is marked by the arrow labeled “1H” (at ~46 MHz, which corresponds to the 1H Larmor frequency, νH). Likewise, the arrow labeled “31P” indicates the position of the sum combination line of 31P (νσ = ~37.5 MHz), which is close to double the Larmor frequency of 31P at this magnetic field, 2νP ≈ 37.1 MHz.
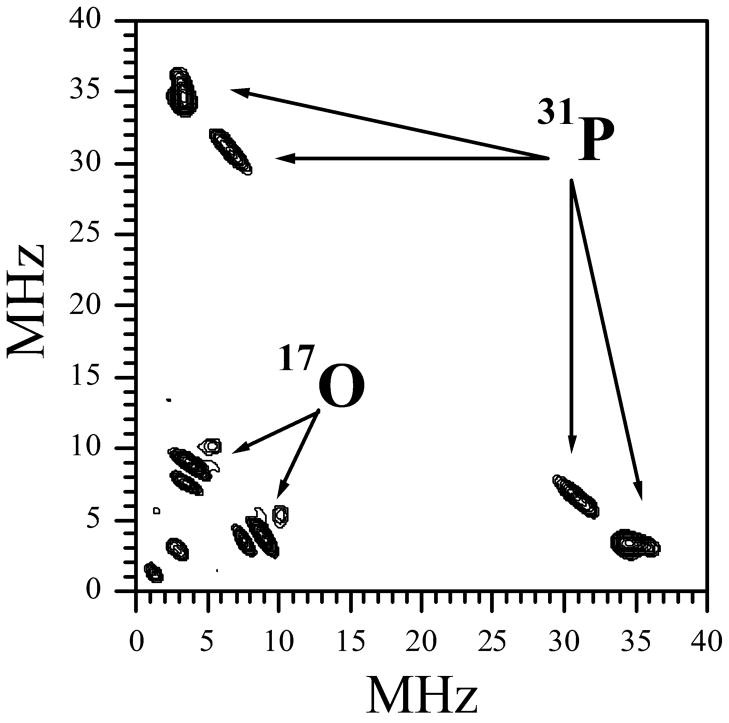
In order to observe the fundamental lines of 31P and to estimate the hfi, hyperfine sublevel correlation (HYSCORE)36 spectroscopy was used. Figure 4 shows the HYSCORE spectrum obtained at the EPR position indicated by the arrow in Figure 2. The cross-peaks in the range of (29 – 37) MHz and (8 – 2) MHz are centered at the 31P Zeeman frequency, νP ≈ 18.5 MHz, and are thus assigned to 31P. The lineshapes of the 31P cross peaks indicate that the 31P species most probably exists in several structural conformations, as was suggested by Dikanov et al. in similar studies.55 Measurements across the entire range of the Species 1P EPR spectrum (see Supporting Information Figure S3) reveal that the 31P hfi varies within the range of about 21 – 43 MHz. A hfi constant of this magnitude is typical of phosphate that is coordinated to Mo(V).12 Based on this strong correlation, we conclude that Species 1P is indeed a phosphate-coordinated form of R160Q hSO.
Figure 4.
Ka-band HYSCORE spectrum of Species 1P obtained at the EPR position indicated by the arrow in Figure 2. Experimental conditions: mw frequency = 30.068 GHz; Bo = 1074 mT; mw pulses, 12, 12, 22, and 12 ns; temperature = 21 K. The spectrum represents the sum of the spectra recorded at the time intervals (τ) between the first two mw pulses for 150, 180, and 210 ns. The arrows labeled “31P” point at the 31P fundamental lines, and the arrows labeled “17O” indicate the lines of 17O from H-bonded water.
The dramatic decrease of the 17O ESEEM in Species 1P (Figure 3) indicates that the weakly coupled oxygen responsible for the intense sum combination features of Species 1 (Figure 3, upper trace) does not originate from the oxo ligand, but rather from one of the remote oxygens of the sulfur-containing ligand. In Species 1P, this ligand is displaced by naturally abundant phosphate (31P16O4 3−), and the initial 17O ESEEM features disappear. Nevertheless, the HYSCORE spectrum of Figure 4 clearly shows signals centered at the 17O Zeeman frequency, νO ≈ 6.2 MHz, that have resolved quadrupole splittings. The intensities of these contours are similar to those of 31P. These may also originate from a residual amount of Species 1, from Species 2, and/or from nearby water that is coordinated to the phosphate. The sulfur-containing ligand, whether sulfite or sulfate, possesses either two or three remote (non-coordinated) oxygens. Only one of these remote 17O nuclei is observed experimentally; however, since the hfi parameters of these oxygens strongly depend on the orientation of the ligand with respect to the Mo(V) dxy orbital.30 This, as well as the specific identity of the equatorial ligand in Species 1 (sulfate or sulfite), will be addressed in detail using DFT calculations (vide infra).
2. Pulsed EPR measurements for the coordinated 17O of the sulfur-containing ligand
With regard to the Mo(V)-coordinated oxygen of the sulfur-containing ligand, earlier Ka-band HYSCORE measurements have only been able to evaluate the hfi constant at the gy EPR position (A ~ 18 MHz)31 since the ESEEM of this nucleus could not be detected at any other EPR position. Furthermore, no information about the nqi of this 17O was obtained since the nqi splittings were not resolved. Zeeman and hyperfine interactions that are close to mutual cancellation in Ka-band can produce pronounced detrimental effects on the non-diagonal elements of the anisotropic hfi and nqi. This may explain the complications involved in observing the nqi. To determine the nqi of the strongly coupled 17O as well as the anisotropy of its hfi, we performed W-band (~95 GHz) ESEEM and ELDOR (electron-electron double resonance) detected NMR (ED-NMR) measurements on R160Q hSO. In W-band, the coordinated equatorial 17O is expected to be well within the weak hfi regime, νO>A/2 (where νO ~ 20 MHz is the Larmor frequency of 17O), which should decrease the broadening that results from non-diagonal elements of the hfi and nqi. In addition, better orientation selection may lead to narrower and better-resolved signals.
ED-NMR is a useful method for measuring fundamental frequencies. It was first proposed and demonstrated at X-band frequencies.56 Because of the relatively low nuclear Larmor frequencies at ~0.35 T, however, this method has not been very popular in instances of small hyperfine couplings. At higher fields (such as those encountered at Ka- and W-bands), however, the technique is more practical due to the increased nuclear Larmor frequencies, especially for low γ nuclei.57–61 The S/N ratio of the fundamental line is often sufficiently better than that of either ENDOR or HYSCORE such that a series of spectra at different positions along the EPR powder pattern can be acquired in a relatively short time. The disadvantage of this technique is its lower resolution with respect to either ESEEM or ENDOR.
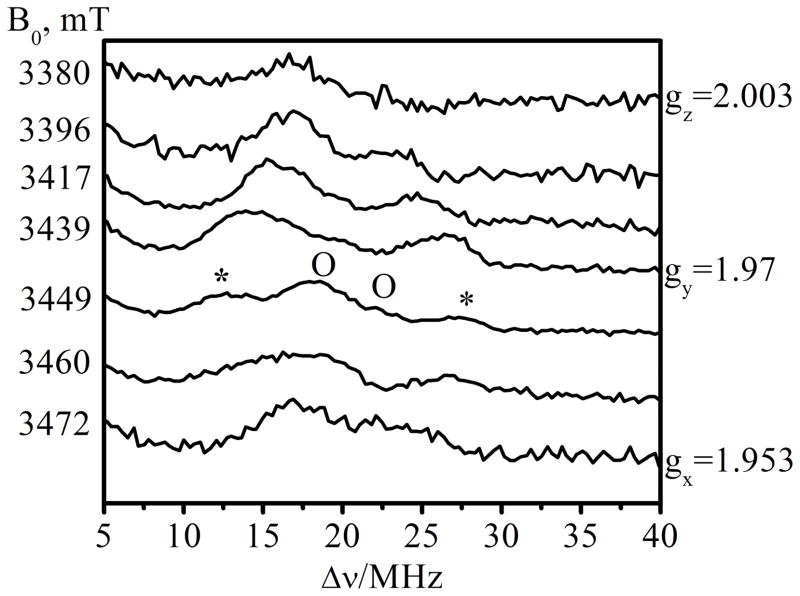
The ED-NMR and W-band echo-detected EPR spectra of Species 1 are shown in Figure 5. The largest hyperfine coupling (marked with “*”) of ~16 MHz is observed at a field of 3449 mT, which is slightly off gy. Another doublet of ~4.5 MHz, and centered about the 17O Larmor frequency (νO ~ 20 MHz), is observed as well (marked with “o”). At gz and gx, the splittings are ~7 MHz and 8–9 MHz, respectively. The largest splitting observed in W-band is somewhat smaller than that of Ka-band (18 MHz), which might be attributable to larger linewidths in W-band. Despite the benefits offered by ED-NMR for measuring hfi, unfortunately the nqi-related splittings of the 17O nuclei in Species 1 could not be resolved. Therefore, ESEEM measurements were carried out to resolve the quadrupole interactions.
Figure 5.
ED-NMR spectra of Species 1 measured at different magnetic field positions (indicated on the left side of each trace). The largest hyperfine coupling (observed at 3449 mT) is labeled by “*”. The spectral features of the weakly coupled 17O (observable on the same trace and labeled by “O”) are centered about the 17O Larmor frequency (νO ~ 20 MHz) and are separated by ~4.5 MHz. The field positions of gx, gy, and gz that correspond to the labeled traces are shown in Figure S6. Experimental conditions: preparation (probing) mw pulse = 10 μs; the observation two-pulse sequence consisted of 100 ns (π/2) and 200 ns (π) pulses separated by a time interval (τ) of 400 ns. The time interval between the preparation and observation pulses was 10 μs; observation mw frequency = 94.897 GHz; temperature = 21 K.
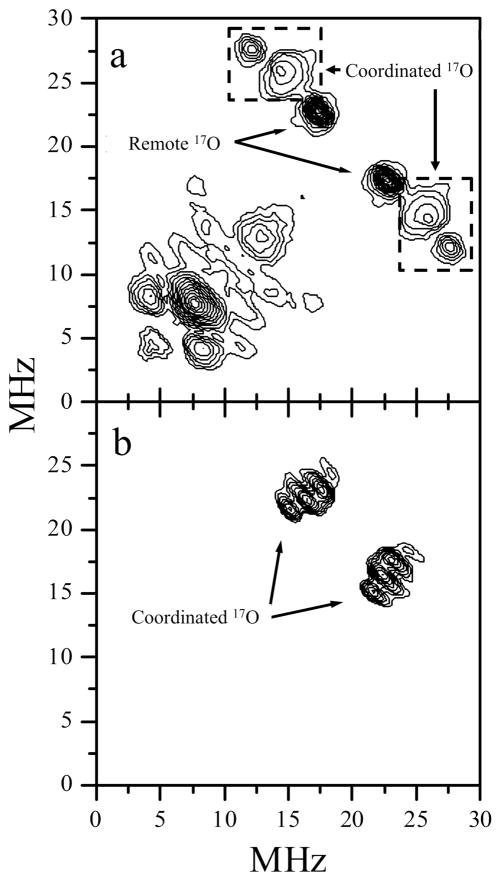
W-band ESEEM measurements were performed at each of the EPR turning points. While the measurements at gx and gy provided useful data, the ESEEM amplitude at gz was apparently too small to give meaningful data. Figure 6a shows the W-band HYSCORE spectrum of Species 1 obtained at gy. The correlation peaks located symmetrically with respect to the 17O Larmor frequency are consistent with the signals observed from ED-NMR and can be assigned to the remote and coordinated oxygen nuclei. The specific assignments of the 17O nuclei with the features of Figure 6a are based on comparisons with the Ka-band HYSCORE spectra detected at gy.31 The outermost features of the correlation peaks, assigned to the coordinated equatorial 17O, are located at about (28, 12) and (12, 28) MHz. These allow the upper limit of the hfi constant be estimated as AY ~16 MHz, which is slightly smaller than AY ~17–18 MHz observed in Ka band. This difference is most likely caused by under-excitation62 of the 17O ESEEM, which occurs when the amplitude of the mw field, B1, is smaller than the typical nuclear transition frequencies.63 Furthermore, the τ-dependent blind-spots,36 where τ is the time interval between the first and second mw pulses, may also be partially responsible for the inability to observe the outermost features of the HYSCORE that correspond to the coordinated 17O. In addition, the quadrupole fine structure for this 17O is not observed in the HYSCORE spectrum obtained at gy. The spectrum obtained at gx, in contrast, displays a well-resolved structure with nqi splittings between the anti-diagonal ridges, ΔνQ, of about 1.1 MHz. Assuming this to be the absolute maximum quadrupole splitting, one could estimate the quadrupole coupling constant as χ ≈ (20/3)×ΔνQ ≈ 7.3 MHz.64 This value is significantly larger than χ ≈ 4.5 MHz, which was determined in earlier Ka-band measurements for the remote 17O.31 Furthermore, the maximum quadrupole-related splitting for the remote oxygen nuclei is observed at gz and is collapsed at gx. The features observed in the HYSCORE shown in Figure 6b, therefore, are best assigned to the coordinated 17O of the sulfur-containing ligand. The hfi constant at gx ranges from about 4 to 11 MHz, as measured between the inner and outer edges of the correlation ridges, which is consistent with the ED-NMR data. Since a single-crystal-like HYSCORE spectrum would be expected at the gx EPR position, the observed range of the hfi constants here most likely reflects the structural variability of the equatorial ligand that results in a statistical distribution of both the isotropic and anisotropic hfi. Contributions from the remote oxygens can be excluded due to their collapsed quadrupole splittings at gx as observed in the Ka-band spectrum (Figure 7).
Figure 6.
W-band HYSCORE spectra of Species 1 obtained at the gy (a) and gx (b) EPR spectrum positions. The spectra represent the sums of the spectra that were obtained at time intervals (τ) between the first two mw pulses of 137 and 175 ns. The correlation lines of coordinated and remote 17O are indicated. Experimental conditions: mw frequency = 94.897 GHz; Bo = 3441.7 mT (a) and 3472.9 mT (b); mw pulses = 12.5, 12.5, 25, and 12.5 ns; temperature = 21 K.
Figure 7.
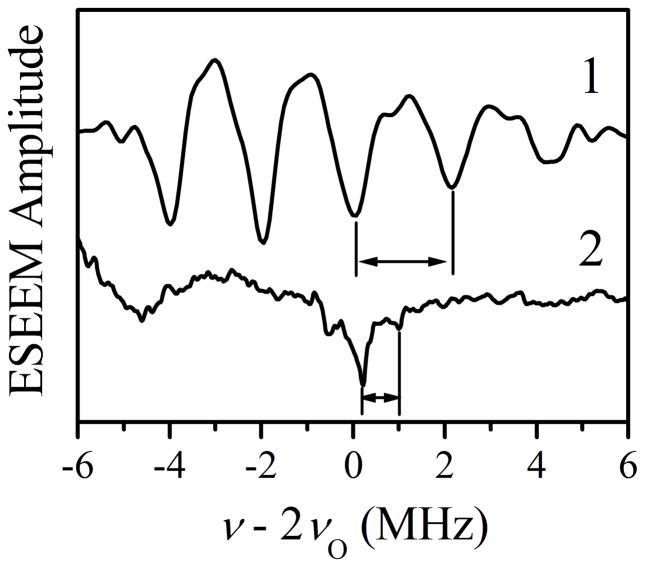
Sum combination line region of the cosine FT spectra of the two-pulse W- and integrated four-pulse Ka-band ESEEM68, 69 (traces 1 and 2, respectively) obtained at gx. The quadrupole splittings, ΔνQ, are indicated for each trace. Experimental conditions for trace 1: mw frequency = 94.897 GHz; Bo = 3472.9 mT; mw pulses, 2×25 ns; temperature= 21 K. Experimental conditions for trace 2: mw frequency = 29.523 GHz; Bo = 1081 mT; mw pulses, 4×15 ns; temperature = 21 K. A frequency of zero is defined as double the 17O Zeeman frequency at the given magnetic fields.
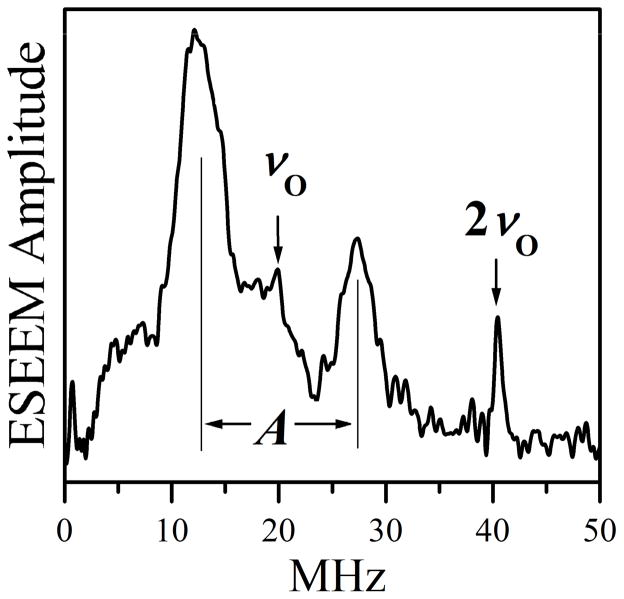
To better estimate the frequency range of the 17O fundamental lines and the range of hfi constants, a blind-spot-free two-pulsed ESEEM technique was used. Figure 8 shows a W-band two-pulse ESEEM spectrum of Species 1 obtained at gy. The major lines, located symmetrically with respect to νO ≈ 19.9 MHz, are assigned to 17O. The splitting between the maxima of these lines gives a direct reading of the average hfi constant at gy (A = 15 MHz), which clearly demonstrates that these lines belong to the coordinated 17O ligand. The range encompassed between the outermost points of these features defines a hfi constant of about 21 MHz. This slightly exceeds the effective hfi constant of 18 MHz observed at Ka-band and may be overestimated since the fundamental lines in two-pulse ESEEM are broadened by the nqi. The moderate differences between the hfi values measured using ESEEM and ED-NMR are most likely due to the different contributions of the anisotropic hfi in the generation of the spectra. Despite this, the spectra obtained using either technique agree qualitatively with each other, and the maximum hfi constant of the coordinated 17O estimated from them is about 18 MHz.
Figure 8.
W-band two-pulse ESEEM spectrum of Species 1 recorded at gy. The 17O Larmor (νO) and double Larmor (2νO) frequencies, and the hfi constant (A) of the coordinated 17O are labeled. Experimental conditions: mw pulse durations = 12.5 ns (π/2) and 25 ns (π); mw frequency = 94.897 GHz; Bo = 3441.7 mT; temperature = 21 K.
Contributions from the remote 17O nuclei are not observable in the gy ESEEM spectrum in Figure 8 due to their considerably smaller amplitudes. The magnetic resonance parameters of the remote 17O nuclei are closer to the weak hfi limit, and their anisotropic hfi are weaker than those of the coordinated 17O. They do appear in the gy HYSCORE spectrum, however, as seen in Figure 6, but comparisons of their intensities are problematic due to blind-spot effects and pulse bandwidth limitations.
The most significant result obtained from the W-band primary ESEEM measurements for the coordinated 17O is the observation of the sum combination feature of this nucleus at gx (Figure 7, trace 1). The average quadrupole splitting, ΔνσQ, between the individual features of the sum combination quintet is about 2.1 MHz. The quadrupole coupling constant derived from this splitting, χ ≈ (10/3)×ΔνσQ) ≈ 7 MHz,64 is in agreement with the estimate made from the HYSCORE spectrum (Figure 6b). For comparison, Figure 7, trace 2 shows the sum combination feature of the remote 17O observed at Ka band. The quadrupole splitting in this spectrum is only about 0.8 MHz, in contrast to that of trace 1. This comparison supports our assignment of the Figure 6b HYSCORE spectrum and the lines of Figure 7, trace 1, to the coordinated 17O of the sulfur-containing equatorial ligand.
A quadrupole coupling constant of about 7 MHz is typical for a 17O with its valence orbitals hybridized to approximately sp3.64 The fact that the largest quadrupole splitting is observed at gx indicates that the long axis of the nqi tensor is close to the axis of gx. Notably, this is one of only a few direct measurements of the nuclear quadrupole coupling constant for a 17O nucleus that is directly coordinated to a metal ion. For this reason, this result is also potentially important as a benchmark in other investigations.
The overall range of the hfi splittings for the coordinated 17O (about 4 to 20 MHz) gives an idea of its anisotropic hfi. Assuming axial hfi, the long component of the anisotropic hfi tensor can be estimated as T// ≈ ±10 MHz. This anisotropic hfi constant is significantly larger than T// ≈ −2.5 MHz, estimated for the dipolar interaction with the unpaired electron situated on Mo(V), and is explained by the spin delocalization into the oxygen orbitals. For the isotropic hfi constant, two estimates are possible, aiso ≈ ±9 MHz or ±15 MHz, the first estimate requiring T// of the same sign as aiso and the second requiring T// of the opposite sign. From our previous DFT calculations for a hydroxo ligand,30 we can expect the spin population on the oxygen orbitals to be positive, resulting in negative aiso and T//. Thus, the hfi parameters for the coordinated 17O can be estimated as (aiso, T//) ≈ (−9, −10) MHz. These and other relevant spectroscopic parameters, including the parameters obtained from extensive quantum-chemical calculations (vide infra), are summarized in Table 1.
Table 1.
Experimental magnetic resonance parameters for wt and mutant blocked forms of SO and DFT-calculated magnetic resonance parameters for the sulfate- and sulfite-bound SO models.
| Species | hfi
|
nqi
|
ref | |||||
|---|---|---|---|---|---|---|---|---|
| aiso/MHz | (T11, T22, T33)/MHz | e2Qq/h/MHz | η | |||||
| blocked R160Q hSO |
|
33S | 2.1 | (1.6, 2.5, −4.1) | 36 | 0.2 | this work | |
| 17Ocoordinated | −9 | (5,5, −10) | 7 | – | ||||
| 17Oremote | −4.5 | (1.25, 1.25, −2.5) | 5 | – | ||||
| blocked wt hSO*† | 33S | 2.6 | (−0.3, −0.3, 0.6) | 36 | – | 27 | ||
| blocked At-SO* | 33S | 3.3 | (1.3, 1.5, −2.8) | 40 | 0 | 23 | ||
| SO-Sulfate (DFT) |
|
33S | 3.33 | (−0.53, −0.40, 0.92) | 4.4 | 0.7 | this work | |
| 17Ocoordinated | −9.56 | (6.06, 5.17, −11.22) | 10.9 | 0.3 | ||||
| 17Oremote |
|
−1.23(a) | (1.18, 1.17, −2.35) | 10.6 | 0.1 | |||
| 0.02 (b) | (0.00, −0.36, 0.36) | 10.5 | 0.1 | |||||
| 0.01 (c) | (0.00, −0.27, 0.27) | 10.9 | 0.1 | |||||
| 17Ooxo | 3.26 | (−3.71, −2.34, 6.04) | 1.2 | 1.0 | ||||
| SO-Sulfite (DFT) |
|
33S | 1.91 | (−0.69, −0.45, 1.14) | 27.9 | 0.2 | this work | |
| 17Ocoordinated | −11.09 | (9.34, 8.41, −17.75) | 9.6 | 0.4 | ||||
| 17Oremote |
|
−1.71(a) | (1.66, 1.60, −3.26) | 9.5 | 0.3 | |||
| −0.10(b) | (0.08, 0.45, −0.53) | 9.9 | 0.1 | |||||
| 17Ooxo | 3.61 | (−4.38, −0.24, 4.62) | 1.1 | 1.0 | ||||
The 17O magnetic resonance parameters for these species have not been fully evaluated.
The blocked form of this enzyme was obtained only under low-pH conditions in the strict absence of Cl−.
In summary, the blocked form of R160Q of hSO has at least two types of 17O nuclei (remote and coordinated) that contribute to the various spectra (two-pulse ESEEM, HYSCORE, ED-NMR) at Ka- and Wbands. Fortunately, the differing dependence of the intensities of the two types of 17O lines on the spectrometer frequency enables them to be resolved. In Ka–band, the remote oxygen was observed throughout the entire EPR spectrum, whereas the coordinated oxygen was only observed at gy and with no nqi resolution. In contrast, at W-band the signals of the remote 17O were weaker, though observed throughout the entire EPR spectrum by ED-NMR. In two-pulse ESEEM, the coordinated 17O signal dominated gy and gx and showed well-resolved nqi related splittings only at gx. Unfortunately, we were unable to observe the spectrum of the coordinated 17O at the gz position at either Ka- or W-band, which impeded the complete experimental interpretation of the spectra. However, this lack of information was partially complemented by simulations and the DFT calculations discussed below.
3. DFT estimates of the SO magnetic resonance parameters
In addition to the efforts described above to chemically distinguish between coordinated sulfate and sulfite as the Mo(V)-bound ligand of Species 1, the magnetic resonance parameters of each possibility were also calculated using DFT methods, as described in the Materials and Methods section. As we (and others) have previously demonstrated,11, 18, 29, 30, 65 the structure of an unknown system can be inferred through the general agreement or disagreement of its spectroscopic parameters with those calculated from theory for a given model. The goal of the calculations is not to exactly replicate the experimental results by calculating the properties for a very large number of conceivable models. Rather, the calculated magnetic resonance parameters serve to distinguish unique structural possibilities from one another by evaluating the overall fit of their calculated results to each other and to the experimental results, as in the case of sulfate versus sulfite coordination to Mo(V).
Recently, we reported our initial attempt to investigate the broad differences in the magnetic resonance parameters of sulfate- and sulfite-bound Mo(V) SO using DFT.11 In that work, two minimal structural models (about 30 atoms each) having 17O- and 33S-labeled oxo-Mo(V)-sulfate/sulfite centers were prepared based on the crystal structure of chicken SO, and the relevant parameters were then calculated. The results from these models provided the first indication that the weakly coupled 17O observed experimentally could possibly originate from a remote oxygen of either coordinated sulfate or sulfite instead of from the axial oxo ligand. Furthermore, significant differences in the 33S magnetic resonance parameters existed between the two models that seemed to favor the sulfite model, particularly in their nqi values. The hfi constants for the 33S and coordinated 17O of the sulfate and sulfite ligands, however, provided no conclusive information about the identity of the ligand since the hfi is highly sensitive to the specific orientation of the bound ligands, which would normally be constrained by the steric and H-bonding interactions within the substrate-binding pocket of the enzyme (see Figure 1).6 Furthermore, the validity of the nqi results, however similar their agreement may be to the experimental values, must be questioned in such minimal systems that do not adequately model the electric field gradient surrounding the atoms of interest since protein and exogenous water interactions were not included. For these reasons, more complete models were prepared that include the entire binding pocket and allow the orientation of the sulfate and sulfite ligands to be more realistically represented.
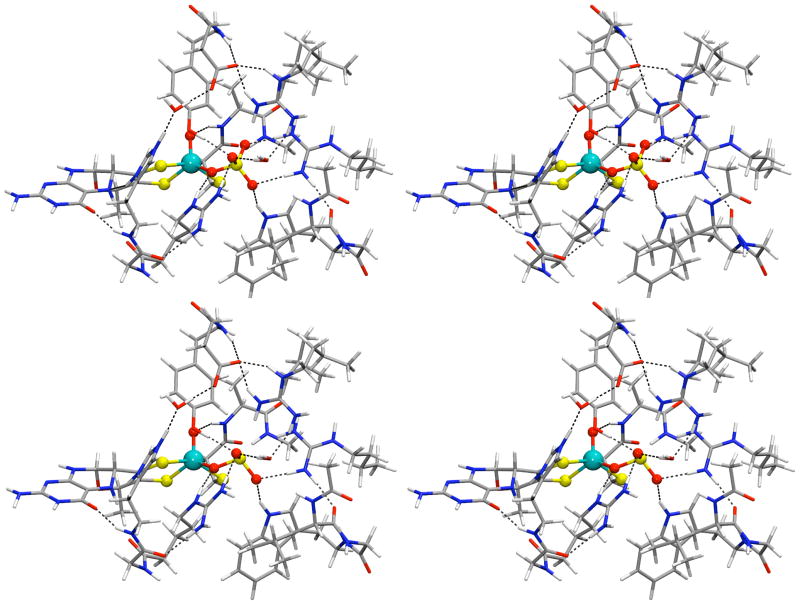
Figure 9 shows the geometry-optimized structural representations of the sulfate- and (one of the) sulfite-coordinated DFT models. Each of these contains about 250 atoms (the xyz coordinates for each model are provided in the Supporting Information). Although the rotation of sulfate is effectively constrained by its high symmetry (tetrahedral), sulfite could arguably exist in at least three principal orientations since it is trigonal pyramidal. The effects of these orientations were investigated by running separate sets of calculations for three orientations of sulfite. The results for only one of the sulfite models will be discussed here since the calculated parameters of all of the models were effectively identical. The relevant calculated magnetic resonance parameters for the sulfate model and one of the sulfite models are included in Table 1 for comparison to each other and to the corresponding experimental results. The parameters for these and the additional sulfite models are included in Table S1. Due to the extreme hardware and time demands required to complete such work (thousands of processor-core-hours), wt SO, having an Arg residue instead of Gln (as in Species 1, for example) trans to the axial oxo ligand of the Mo center, was chosen for the first large DFT model. Therefore, the results of these models could arguably be more relevant to the blocked form of wt At-SO. The experimentally determined magnetic resonance parameters for all blocked forms are similar,23, 24, 31 however, justifying any comparison of the calculated parameters to blocked forms in general. The effects of specific active site mutations on the magnetic resonance parameters of blocked SO will be addressed in future work.
Figure 9.
Stereo view (cross-eye) representations of the energy-minimized sulfate- and sulfite-bound SO models (upper and lower, respectively). The magnetic resonance parameters calculated for these models are provided in Table 1, and the atom coordinates are provided in the Supporting Information. blue-green = Mo, red = O, yellow = S, gray = C, and blue = N.
To our knowledge, no synthetic sulfate or sulfite model compounds that even remotely represent the proposed active site structure of blocked SOEs in the Mo(V) state have been reported to date. This is most likely due to the very poor binding properties of either ligand. Within a protein environment, however, positively charged amino acid side chains are able to greatly stabilize the binding of these otherwise weak ligands. Indeed, our DFT models demonstrate that both sulfate and sulfite form stable bonds to the Mo(V) of SO within the protein, and each ligand is further stabilized by multiple H-bonding interactions from nearby residues. The optimized Mo(V)-Osulfate bond (2.17 Å) was determined to be slightly weaker than that of Mo(V)-Osulfite (2.11 Å), but both bond lengths compared well to values we have determined in our previous calculations for Mo(V)- OH centers (2.05 –2.2 Å).18, 30
In contrast, there are measurable differences between the calculated magnetic resonance parameters of sulfate and sulfite. The magnitude of the 33S nuclear quadrupole coupling constants (χ), most notably, differs by a factor of ~7. For sulfate, in which the sulfur is located within a very symmetric electric field, a value of ~4.4 MHz is obtained, while a value of ~28 MHz is obtained for sulfite. Comparison of the calculated and experimentally measured χ values for 33S strongly favors the sulfite model (Table 1). No other significant differences exist between the magnetic resonance parameters of sulfate and sulfite.
As previously mentioned, the orientation of the exchangeable equatorial ligand has a large effect on the spin population delocalization from the Mo(V) dxy orbital onto the exchangeable ligand. This is clearly observed in the values of the remote 17O hfi constants, where one of the nuclei has a large hfi while the others are small despite their chemical equivalency. The calculated hfi constants of the sulfate and sulfite remote 17O nuclei compare well to the experimentally determined values, although both are underestimated. Interestingly, the nqi of these nuclei (9.5 – 10.9 MHz) are much larger than those of the 17O oxo, which are around 1 – 1.5 MHz as determined by both experiment and calculation.29 The large difference between the oxo and remote oxygen nqi (~10 fold) lends further support to our (re)assignment of the exchangeable 17O of the blocked forms (nqi ~5 MHz) to remote oxygens rather than to an “oxo” group. Despite improvements in the DFT models, the calculated nqi values (Table 1) still differ from experiment by a factor of 2, which could possibly be explained by an under representation of the H-bonding of the amino acid side chains and/or exogenous water molecules with sulfite. This effect was recently demonstrated from DFT calculations for 17O water bound to Gd(III), where the 17O χ could be decreased from 10 MHz to 6.1 MHz depending only on H-bonding interactions.66 Regardless, based on these DFT results and our experimental work involving phosphate and CaCl2, it is clear that the axial oxo group of the Mo(V) center of Species 1 of R160Q hSO does not exchange with 17O. Thus, there is no need to invoke the previously proposed axial interaction of Gln with the Mo(V) center of R160Q to explain the unusual 17O nqi value. Rather, the apparent increase in the “oxo” nqi of the blocked forms should be attributed to the remote oxygen atoms of the exchangeable sulfite ligand, which is known to rapidly and spontaneously exchange its oxygens with water.33
Conclusion
At low pH the fatal R160Q mutant of hSO produces Species 1, which was previously ascribed to a six-coordinate Mo(V) center with an exchangeable terminal oxo ligand and an equatorial sulfate group.23, 28, 31 In this work, pulsed EPR experiments and DFT calculations provide compelling evidence that the exchangeable ligand of Species 1 is sulfite (Figure 1 and Scheme 1). Thus, the original proposal by Bray regarding the existence of a “sulfite” form of SO is correct, in principle.67 The transformation of Species 1 into the phosphate-inhibited form clearly demonstrates that the weakly coupled 17O, observed in ESEEM experiments, belongs to sulfite and not to the axial oxo. Furthermore, the need to invoke a ligand interaction with Mo(V) trans to the oxo,28 thereby increasing the axial 17O-oxo nqi,31 is unnecessary.
Finally, this comprehensive study of the blocked form (Species 1) of R160Q by isotopic labeling, variable frequency pulsed EPR spectroscopy, and large-scale DFT calculations demonstrates the utility of these combined procedures for elucidating the roles of anions, mutations, and steric factors in the formation, stabilization, and transformation of active site complexes of SOEs that may be involved in catalysis and/or inhibition. This integrated approach should also be applicable to direct interrogation of the paramagnetic states in the catalytic cycles of other metalloproteins.
Supplementary Material
Synopsis.
Pulsed EPR spectroscopy at Ka- and W-bands of the fatal R160Q mutant of human sulfite oxidase at low pH in H2 17O solution shows that the sulfur-containing ligand exchanges with phosphate. Multiple DFT calculations for realistic models of the Mo active site identify the sulfur-containing exchangeable ligand as sulfite. The two types of 17O signals arise from the coordinated and remote oxygen atoms of the sulfite ligand in a typical five-coordinate Mo(V) site.
Acknowledgments
We gratefully acknowledge support of this research by the NIH (GM-37773 to J.H.E.) and the US-Israel Binational Science Foundation (2006179) and by grants from the NSF (DBI-0139459, DBI- 9604939,BIR-9224431) and the NIH (S10RR020959) for development of the pulsed EPR facility at the University of Arizona. K.J.-W. thanks the NIH for a Ruth L. Kirschstein National Service Award. This research was made possible, in part, by the historic generosity of the Harold Perlman Family. D.G holds the Erich Klieger Professorial chair in Chemical Physics. We thank K. V. Rajagopalan and H. L. Wilson for initial samples of R160Q hSO, for the pTG918 plasmid containing the hSO gene for preparing recombinant human sulfite oxidase, and for the protocols for purifying the enzyme.
Footnotes
Supporting Information. Specific details regarding the generation of the Pi and standard lpH forms of R160Q hSO from (blocked) Species 1, a full description of the EPR simulation procedures, the optimized atom coordinates of the sulfate- and sulfite-bound enzyme models from which all of the DFT-calculated magnetic resonance parameters were derived, figures depicting the calculated g-tensor orientations and total spin density contours of each model, Euler rotations of the electric field gradient (EFG) and hyperfine tensors of relevant atoms to the g-tensor, magnetic field positions corresponding to specific ESEEM measurements, and a summary table of all of the experimental and calculated magnetic resonance parameters relevant to this work are provided. This material is available free-of-charge via the Internet at http://pubs.acs.org.
Contributor Information
Daniella Goldfarb, Email: daniella.goldfarb@weizmann.ac.il.
John H. Enemark, Email: jenemark@email.arizona.edu.
References
- 1.Hille R. Chem Rev. 1996;96:2757–2816. doi: 10.1021/cr950061t. [DOI] [PubMed] [Google Scholar]
- 2.Feng C, Tollin G, Enemark JH. Biochim Biophys Acta. 2007;1774:527–539. doi: 10.1016/j.bbapap.2007.03.006. [DOI] [PMC free article] [PubMed] [Google Scholar]
- 3.Johnson JL. Prenatal Diag. 2003;23:6–8. doi: 10.1002/pd.505. [DOI] [PubMed] [Google Scholar]
- 4.Tan WH, Eichler FS, Hoda S, Lee MS, Baris H, Hanley CA, Grant E, Krishnamoorthy KS, Shih VE. Pediatrics. 2005;116:757–766. doi: 10.1542/peds.2004-1897. [DOI] [PubMed] [Google Scholar]
- 5.Dublin AB, Hald JK, Wootton-Gorges SL. Am J Neuroradiol. 2002;23:484–485. [PMC free article] [PubMed] [Google Scholar]
- 6.Kisker C, Schindelin H, Pacheco A, Wehbi WA, Garrett RM, Rajagopalan KV, Enemark JH, Rees DC. Cell. 1997;91:973–983. doi: 10.1016/s0092-8674(00)80488-2. [DOI] [PubMed] [Google Scholar]
- 7.Schrader N, Fischer K, Theis K, Mendel RR, Schwarz G, Kisker C. Struct. 2003;11:1251–1263. doi: 10.1016/j.str.2003.09.001. [DOI] [PubMed] [Google Scholar]
- 8.George GN, Kipke CA, Prince RC, Sunde RA, Enemark JH, Cramer SP. Biochemistry. 1989;28:5075–5080. doi: 10.1021/bi00438a026. [DOI] [PubMed] [Google Scholar]
- 9.Karakas E, Wilson HL, Graf TN, Xiang S, Jaramillo-Busquets S, Rajagopalan KV, Kisker C. J Biol Chem. 2005;280:33506–33515. doi: 10.1074/jbc.M505035200. [DOI] [PubMed] [Google Scholar]
- 10.Kappler U, Bailey S. J Biol Chem. 2005;280:24999–25007. doi: 10.1074/jbc.M503237200. [DOI] [PubMed] [Google Scholar]
- 11.Enemark JH, Raitsimring AM, Astashkin AV, Klein EL. Faraday Discuss. 2011;148:249–267. doi: 10.1039/c004404k. [DOI] [PMC free article] [PubMed] [Google Scholar]
- 12.Pacheco A, Basu P, Borbat P, Raitsimring AM, Enemark JH. Inorg Chem. 1996;35:7001–7008. doi: 10.1021/ic9607806. [DOI] [PubMed] [Google Scholar]
- 13.Bray RC. Q Rev Biophys. 1988;21:299–329. doi: 10.1017/s0033583500004479. [DOI] [PubMed] [Google Scholar]
- 14.Gutteridge S, Lamy MT, Bray RC. Biochem J. 1980;191:285–288. doi: 10.1042/bj1910285. [DOI] [PMC free article] [PubMed] [Google Scholar]
- 15.Lamy MT, Gutteridge S, Bray RC. Biochem J. 1980;185:397–403. doi: 10.1042/bj1850397. [DOI] [PMC free article] [PubMed] [Google Scholar]
- 16.Bray RC, Gutteridge S, Lamy MT, Wilkinson T. Biochem J. 1983;211:227–236. doi: 10.1042/bj2110227. [DOI] [PMC free article] [PubMed] [Google Scholar]
- 17.Doonan CJ, Wilson HL, Bennett B, Prince RC, Rajagopalan KV, George GN. Inorg Chem. 2008;47:2033–2038. doi: 10.1021/ic7017083. [DOI] [PMC free article] [PubMed] [Google Scholar]
- 18.Klein EL, Astashkin AV, Ganyushin D, Riplinger C, Johnson-Winters K, Neese F, Enemark JH. Inorg Chem. 2009;48:4743–4752. doi: 10.1021/ic801787s. [DOI] [PMC free article] [PubMed] [Google Scholar]
- 19.Enemark JH, Astashkin AV, Raitsimring AM. High-Resolution EPR Spectroscopy of Mo Enzymes. Sulfite Oxidases: Structural and Functional Implications. In: Hanson G, Berliner LJ, editors. Biological Magnetic Resonance. Vol. 29. Springer; 2010. pp. 122–162. [DOI] [PMC free article] [PubMed] [Google Scholar]
- 20.Enemark JH, Astashkin AV, Raitsimring AM. Dalton Trans. 2006:3501–3514. doi: 10.1039/b602919a. [DOI] [PubMed] [Google Scholar]
- 21.Bray RC. In: Biological Magnetic Resonance. Berliner LJ, Reuben J, editors. Vol. 2. Plenum Press; New York: 1980. p. 45. [Google Scholar]
- 22.At-SO contains no integral electron acceptor (e.g. heme). For this reason, an external oxidant is required to produce the Mo(V) intermediate of the enzyme from its fully reduced form.
- 23.Astashkin AV, Johnson-Winters K, Klein EL, Byrne RS, Hille R, Raitsimring AM, Enemark JH. J Am Chem Soc. 2007;129:14800–14810. doi: 10.1021/ja0704885. [DOI] [PMC free article] [PubMed] [Google Scholar]
- 24.Astashkin AV, Hood BL, Feng CJ, Hille R, Mendel RR, Raitsimring AM, Enemark JH. Biochemistry. 2005;44:13274–13281. doi: 10.1021/bi051220y. [DOI] [PubMed] [Google Scholar]
- 25.Rapson TD, Astashkin AV, Johnson-Winters K, Bernhardt PV, Kappler U, Raitsimring AM, Enemark JH. J Biol Inorg Chem. 2010 doi: 10.1007/s00775-009-0619-0. [DOI] [PMC free article] [PubMed] [Google Scholar]
- 26.Raitsimring AM, Astashkin AV, Feng C, Wilson HL, Rajagopalan KV, Enemark JH. Inorg Chim Acta. 2008;361:941–946. doi: 10.1016/j.ica.2007.05.023. [DOI] [PMC free article] [PubMed] [Google Scholar]
- 27.Rajapakshe A, Johnson-Winters K, Nordstrom AR, Meyers KT, Emesh S, Astashkin AV, Enemark JH. Biochemistry. 2010;49:5154–5159. doi: 10.1021/bi902172n. [DOI] [PMC free article] [PubMed] [Google Scholar]
- 28.Doonan CJ, Wilson HL, Rajagopalan KV, Garrett RM, Bennett B, Prince RC, George GN. J Am Chem Soc. 2007;129:9421–9428. doi: 10.1021/ja071402a. [DOI] [PubMed] [Google Scholar]
- 29.Astashkin AV, Neese F, Raitsimring AM, Cooney JJA, Bultman E, Enemark JH. J Am Chem Soc. 2005;127:16713–16722. doi: 10.1021/ja055472y. [DOI] [PubMed] [Google Scholar]
- 30.Astashkin AV, Klein EL, Ganyushin D, Johnson-Winters K, Neese F, Kappler U, Enemark JH. Phys Chem Chem Phys. 2009;11:6733–6742. doi: 10.1039/b907029j. [DOI] [PMC free article] [PubMed] [Google Scholar]
- 31.Astashkin AV, Johnson-Winters K, Klein EL, Feng CJ, Wilson HL, Rajagopalan KV, Raitsimring AK, Enemark JH. J Am Chem Soc. 2008;130:8471–8480. doi: 10.1021/ja801406f. [DOI] [PMC free article] [PubMed] [Google Scholar]
- 32.Astashkin AV, Feng C, Raitsimring AM, Enemark JH. J Am Chem Soc. 2005;127:502–503. doi: 10.1021/ja0461466. [DOI] [PubMed] [Google Scholar]
- 33.Betts RH, Voss RH. Can J Chem. 1970;48:2035–2041. [Google Scholar]
- 34.Astashkin AV, Enemark JH, Raitsimring AM. Concepts Magn Reson Part B (Magn Reson Engineering) 2006;29B:125–136. [Google Scholar]
- 35.Goldfarb D, Lipkin Y, Potapov A, Gorodetsky Y, Epel B, Raitsimring AM, Radoul M, Kaminker I. J Magn Reson. 2008;194:8–15. doi: 10.1016/j.jmr.2008.05.019. [DOI] [PubMed] [Google Scholar]
- 36.Höfer P, Grupp A, Nebenführ H, Mehring M. Chem Phys Lett. 1986;132:279–282. [Google Scholar]
- 37.http://quiz2.chem.arizona.edu/epr.
- 38.http://www.thch.uni-bonn.de/tc/orca.
- 39.Becke AD. Phys Rev A. 1988;38:3098–3100. doi: 10.1103/physreva.38.3098. [DOI] [PubMed] [Google Scholar]
- 40.Perdew JP. Phys Rev B. 1986;33:8822–8824. doi: 10.1103/physrevb.33.8822. [DOI] [PubMed] [Google Scholar]
- 41.Becke AD. J Chem Phys. 1993;98:5648–5652. [Google Scholar]
- 42.Lee C, Yang W, Parr RP. Phys Rev B. 1988;37:785–789. doi: 10.1103/physrevb.37.785. [DOI] [PubMed] [Google Scholar]
- 43.Schäfer A, Huber C, Ahlrichs R. J Chem Phys. 1994;100:5829–5835. [Google Scholar]
- 44.Schäfer A, Horn H, Ahlrichs R. J Chem Phys. 1992;97:2571–2577. [Google Scholar]
- 45.Weigend F, Haeser M, Patzelt H, Ahlrichs R. ftp://ftp.chemie-karlsruhe.de/pub/basen.
- 46.van Lenthe E, Baerends EJ, Snijders JG. J Chem Phys. 1993;99:4597–4610. [Google Scholar]
- 47.van Wüllen C. J Chem Phys. 1998;109:392–399. [Google Scholar]
- 48.van Lenthe JH, Faas S, Snijders JG. Chem Phys Lett. 2000;328:107–112. [Google Scholar]
- 49.Klamt A, Schüürmann G. J Chem Soc, Perkin Trans. 1993;2:799–805. [Google Scholar]
- 50.Sinnecker S, Neese F. J Comput Chem. 2006;27:1463–1475. doi: 10.1002/jcc.20426. [DOI] [PubMed] [Google Scholar]
- 51.Roy A. Israel J Chem. 1967;5:4. [Google Scholar]
- 52.Nilsson G, Rengemo T, Sillen LG. Acta Chem Scand. 1958;12:868–872. [Google Scholar]
- 53.While carrying out the experiments described in reference 30 for various forms of SO, attempts were made to convert Species 1 into the lpH form by adding sodium chloride. No effect of the chloride addition were detectable, even at concentrations of 1M NaCl.
- 54.Reagent Chemicals: Specifications and Procedures: American Chemical Society Specifications. American Chemical Society; 2006. [Google Scholar]
- 55.Dikanov SA, Liboiron BD, Thompson KH, Vera E, Yuen VG, McNeill JH, Orvig C. J Am Chem Soc. 1999;121:11004–11005. [Google Scholar]
- 56.Schosseler P, Wacker T, Schweiger A. Chem Phys Lett. 1994;224:319–324. [Google Scholar]
- 57.Kulik L, Epel B, Messinger J, Lubitz W. Photosynth Res. 2005;84:347–353. doi: 10.1007/s11120-005-2438-7. [DOI] [PubMed] [Google Scholar]
- 58.Jeschke G, Spiess HW. Chem Phys Lett. 1998;293:9–18. [Google Scholar]
- 59.Potapov A, Epel B, Goldfarb D. J Chem Phys. 2008;128:052320-1–052320-10. doi: 10.1063/1.2833584. [DOI] [PubMed] [Google Scholar]
- 60.Kaminker I, Goldberg H, Neumann R, Goldfarb D. Chem - Eur J. 2010;16:10014–10020. doi: 10.1002/chem.201000944. [DOI] [PubMed] [Google Scholar]
- 61.Florent M, Kaminker I, Nagarajan V, Goldfarb D. J Magn Reson. 2011;210:192–199. doi: 10.1016/j.jmr.2011.03.005. [DOI] [PubMed] [Google Scholar]
- 62.Astashkin AV, Dikanov SA, Kurshev VV, Tsvetkov YD. Chem Phys Lett. 1987;136:335–341. [Google Scholar]
- 63.The maximum π-pulse amplitude achievable with the W-band instrumentation used in these measurements does not exceed 20 MHz,35 while B1 = ~40 MHz was used in the Ka-band measurements
- 64.Raitsimring AM, Astashkin AV, Baute D, Goldfarb D, Caravan P. J Phys Chem A. 2004;108:7318–7323. [Google Scholar]
- 65.Neese F. Coord Chem Rev. 2009;253:526–563. [Google Scholar]
- 66.Yazyev OV, Helm L. J Chem Phys. 2006;125:0545031–0545038. doi: 10.1063/1.2217950. [DOI] [PubMed] [Google Scholar]
- 67.Bray RC, Lamy MT, Gutteridge S, Wilkinson T. Biochem J. 1982;201:241–243. doi: 10.1042/bj2010241. [DOI] [PMC free article] [PubMed] [Google Scholar]
- 68.van Doorslaer S, Schweiger A. Chem Phys Lett. 1997;281:297–305. [Google Scholar]
- 69.Astashkin AV, Raitsimring AM. J Magn Reson. 2000;143:280–291. doi: 10.1006/jmre.1999.1988. [DOI] [PubMed] [Google Scholar]
Associated Data
This section collects any data citations, data availability statements, or supplementary materials included in this article.


