Abstract
Skeletal muscle adaptation to chronic hypoxia includes loss of oxidative capacity and decrease in fiber size. However, the diaphragm may adapt differently since its activity increases in response to hypoxia. Thus, we hypothesized that chronic hypoxia would not affect endurance, mitochondrial function or fiber size in the mouse diaphragm. Adult male mice were kept in normoxia (Control) or hypoxia (Hypoxia, FIO2= 10%) for 4 weeks. After that time, muscles were collected for histological, biochemical and functional analyses. Hypoxia soleus muscles fatigued faster (fatigue index higher in Control, 21.5±2.6% vs. 13.4±2.4%, p<0.05), but there was no difference between Control and Hypoxia diaphragm bundles. Mean fiber cross sectional area was unchanged in Hypoxia limb muscles, but it was 25% smaller in diaphragm (p<0.001). Ratio of capillary length contact to fiber perimeter was significantly higher in Hypoxia diaphragm (28.6±1.2 vs. 49.3±1.4, Control and Hypoxia, p<0.001). Mitochondrial respiration rates in Hypoxia limb muscles were lower: state 2 decreased 19%, state 3 31% and state 4 18% vs. Control, p<0.05 for all comparisons. There were similar changes in Hypoxia diaphragm: state 3 decreased 29% and state 4 17%, p<0.05. After 4 weeks of hypoxia limb muscle mitochondria had lower content of complex IV (cytochrome c oxidase), while diaphragm mitochondria had higher content of complexes IV and V (F1/F0 ATP synthase) and less uncoupling protein 3 (UCP-3). These data demonstrate that diaphragm retains its endurance during chronic hypoxia, apparently due to a combination of morphometric changes and optimization of mitochondrial energy production.
Keywords: Chronic hypoxia, diaphragm, mitochondria, electron microscopy, fatigue
Introduction
The mitochondrion is the main energy (ATP) supplier to the cell. ATP is produced via oxidative phosphorylation, a process that requires the electron transport chain where the final electron acceptor is oxygen. When oxygen delivery to organs and tissues is rapidly reduced (as in acute ischemia), mitochondrial dysfunction contributes to cellular damage and death [14]. However, the consequences of chronic low ambient oxygen (such as living at high altitude) on mitochondrial function are less well understood. In skeletal muscles, chronic hypoxia seems to reduce oxidative capacity [30] and fiber cross sectional area [28;34].
The fatigue resistance of a skeletal muscle is proportional to its mitochondrial content (termed “aerobic” or “oxidative” capacity): fatigue-resistant muscles have a higher mitochondrial content than fatigable muscles and endurance training increases it further [15;26;27;50]. In chronic hypoxia, locomotion is limited by the low ambient Po2, at least while the animal adapts to it. However, the situation is quite the opposite for the diaphragm and other respiratory muscles: hypoxia imposes a greater workload on the diaphragm since increased ventilation is an acute and sustained response to low ambient Po2. In other words, the diaphragm, contrary to limb muscles, would be subjected to “natural” endurance training when ambient Po2 is lower than normal. Some evidence suggests that the diaphragm adapts to chronic hypoxia in a different way than limb muscles, as exemplified by minimal changes in oxidative capacity [2]. We have previously reported that the mouse diaphragm exhibits unique adaptations to chronic hypoxia (reduced mitochondrial volume density and redistribution of the mitochondria to the sub-sarcolemmal compartment) despite the increased work of breathing [19]. We now explore the functional impact of chronic hypoxia on isolated mitochondria. The present study tested the hypothesis that chronic hypoxia does not alter the fatigue resistance and mitochondrial function of the mouse diaphragm. To this end, we compared muscle endurance (resistance to fatigue) in vitro, muscle fiber cross-sectional area, and the functional and molecular characteristics of isolated mitochondria of diaphragm and limb muscles from mice kept under normoxic and hypoxic conditions.
Methods
Animals
The study was approved by the Institutional Animal Care and Use Committee at the University of Kentucky. C57BL/6J adult male mice (12 wks old) were exposed to either normoxia (Control) or 4 weeks of normobaric hypoxia (Hypoxia) in a Plexiglas chamber (BioSpherix, Redfield NY). Chamber Po2 was constantly monitored with an oxygen sensor; a controller unit maintained a steady Po2 of 10% by flushing nitrogen into the chamber whenever required. At the conclusion of the study, mice were euthanized by CO2 asphyxia and cervical dislocation prior to removal of the diaphragm and hind limb muscles.
Fiber cross-sectional area
Diaphragm bundles and triceps surae were frozen in 2-methylbutane cooled to its freezing point in liquid nitrogen. Cryostat cross-sections (10 μm thick) were collected and stained with hematoxylin and eosin. Micrographs were obtained with a Nikon E60 microscope, stored in a computer and fiber area measured using NIH Image J software.
Capillary to fiber contact ratio
Mice were perfused with 4% glutaraldehyde and 2% paraformaldehyde. Diaphragm and triceps surae were isolated, cut into pieces and fixed in glutaraldehyde (4%) and paraformaldehyde (2%) for 2 hours at 4°C. Post-fixation was performed in osmium tetraoxide (1%) for 1 hour, dehydrated and embedded for further sectioning. Thin (80 nm) fiber transverse sections were stained with uranyl acetate and lead citrate and examined with a transmission electron microscope. Fiber perimeter and the length of capillary fiber contact were measured in electron micrographs and used to calculate the capillary to fiber contact ratio as previously described [49]. At total of 50 individual fibers from the Hypoxia group and 54 from the Control group were used for this analysis.
Mitchondrial isolation
Freshly dissected diaphragm and triceps surae muscles were minced and incubated with trypsin (0.05%) in ice-cold phosphate buffered saline (PBS) with 10 mM EDTA for 20 minutes. Muscles were then homogenized in a HEPES buffer (20 mM, pH 7.4) containing 215 mM manitol, 75 mM sucrose, 10 mM EDTA and 0.1% bovine serum albumin (BSA). Homogenates were centrifuged at 700g and 4°C for 10 minutes and the supernatant collected and centrifuged again at 10,500g for 10 minutes. The pellets were resuspended in the same HEPES buffer (pH 7.4) containing 3 mM EGTA instead of 10 mM EDTA. Samples were centrifuged at 10,500g and resuspended again to a final concentration of 10 to 15 mg protein/ml. The Bradford protein assay was used to quantify the protein concentration [3].
Mitochondrial oxygen consumption
Mitochondrial respiration was measured using a Clark-type electrode at 37°C as previously described [16]. After electrode calibration, isolated mitochondria (350-400 μg) were added to 0.5 ml of respiration buffer (HEPES 20 mM, manitol 215 mM, sucrose 75 mM, BSA 0.1%, EGTA 20 μM, MgCl2 5 mM and KH2PO4 2.5 mM). Glutamate (5 mM) and malate (2.5 mM) were added and the oxygen consumption rate measured (state 2 respiration). State 3 was initiated with the addition of ADP (150 μM). Oligomycin (1 μM) was used to block ATP synthase activity and measure state 4 respiration. The uncoupled maximal oxygen consumption rate (state 5) was measured after the addition of dinitrophenol (40 μM). The respiratory control ratio (RCR) was obtained by dividing the ADP-stimulated respiration rate (state 3) by the state 4.
Western blot analysis
Mitochondrial proteins (15-20 μg of protein) were resolved in 10-20% linear gradient SDS-polyacrylamide gels (Bio-Rad, Hercules CA) and transferred to polyvinylidene difluoride membranes (Immobilon-FL, Millipore, Billerica MA). Equal protein loading was confirmed by Ponceau S staining. Membranes were incubated using primary monoclonal antibodies (Invitrogen, Carlsbad CA) against the following proteins: α subcomplex of complex I, iron-sulfur protein of complex II, core I of complex II, subunit VIb of complex IV and subunit α of complex V and uncoupling protein 3 (UCP-3, Abcam, Cambridge MA). Alexa Fluor 680-conjugated secondary antibodies were used for detection (1:7500, Invitrogen). Membranes were washed, rinsed and scanned using the Odyssey Infrared Imaging System (LI-COR Biosciences, Lincoln NE). Density of resulting bands was quantified using NIH Image J software.
ATP content
Diaphragm and triceps surae muscles were removed, immediately frozen in liquid nitrogen and stored at −80°C until further analysis. ATP extraction from muscles was as previously described [54]. Briefly, muscles were weighed and homogenized (1:10 w:v) in an extraction buffer containing Tris-HCl (50 mM), KCl (100 mM), MgCl2 (5mM), and trichloroacetic acid (2%). Homogenates were then incubated (1:9, v:v) at 95°C for 2 minutes in the incubation buffer (Tris base 100 mM and EDTA 4mM). After centrifuging at 2000g for 2 minutes, the supernatants were collected and ATP levels were measured using a commercial kit (Molecular Probes, Invitrogen, Carlsbad CA) that uses a coupled reaction catalyzed by luciferase: light is produced in proportion to the amount of ATP present. Light was measured using a luminometer (Lumat LB 9507, EG&G Berthold) and ATP concentration was calculated from a curve of ATP standards.
Contractile function
The triceps surae is a large limb muscle complex, too big for the study of contractile function in vitro. The soleus muscle is a component the triceps surae and more appropriate for in vitro analysis; therefore, we used it as a representative limb muscle for this portion of the study. Soleus muscles and costal diaphragm muscle bundles were dissected and transferred to a Krebs-Ringer buffer containing NaCl 137 mM, KCl 4 mM, NaHCO3 24 mM, KH2PO4 1 mM, CaCl2 2 mM, MgSO4 1 mM and bubbled with 95%O2 and 5%CO2. Distal tendons and ribs were tied to a glass bar using silk 4-0 suture and muscles placed between stimulating electrodes in an organ bath containing Krebs-Ringer buffer constantly bubbled with 95% O2 -5% CO2. The other muscle end was fixed to a force transducer (BG Series 100g, Kulite, Leonia NJ) placed on a micrometer in order to adjust muscle length. Muscles were electrically stimulated to contract isometrically and twitch force recorded in an oscilloscope (Hewlett Packard model 546601B, Palo Alto CA). Muscles were stimulated several times while adjusting the muscle length to obtain the highest twitch force (optimal length). Bath temperature was then changed to 37°C and the muscles were allowed to equilibrate for 20 minutes. At the end of the incubation, 25 μM of D-tubocurarine was added to block neuromuscular transmission, and the force-frequency response determined. For this purpose, muscles were stimulated to contract using stimulus frequencies of 1, 15, 30, 50, 80, 120, 150, 250 and 300 Hz, every other minute with a train duration of 250 ms. Two minutes after the completion of the force-frequency response, fatigue was induced by repetitive stimulation (40 Hz, 0.5 train/s, and 500 ms train duration) for 10 minutes. Force was recorded every 30 seconds. At the end of the experiment, optimal length was measured using an electronic caliper and the muscles removed, blotted dry and weighted. Cross sectional area was calculated as described by Close [8]. Specific forces were expressed in N/cm2. Force decline was expressed and plotted as percent from the initial force (F0). Fatigue index is the percent of force produced during the last contraction (at time = 10 min) compared to the force at time = 0 (start of the fatigue protocol).
Statistical analysis
Statistical analyses were performed using SPSS v11 (Chicago, IL) and GraphPad Prism 4 (La Jolla, CA). Data were analyzed using two-tailed t-tests to compare the Control and Hypoxia groups. Muscle fiber cross-sectional areas were compared using 2-factor nested ANOVA with group (Control and Hypoxia) as the fixed factor, and animal (4 per group) as the random factor nested within group. For the force-frequency relationship and fatigue curve, 2-way repeated measures ANOVA was used to test the difference between the groups. Statistical significance was achieved when p≤0.05.
Results
Chronic hypoxia does not change the fatigue resistance of the mouse diaphragm
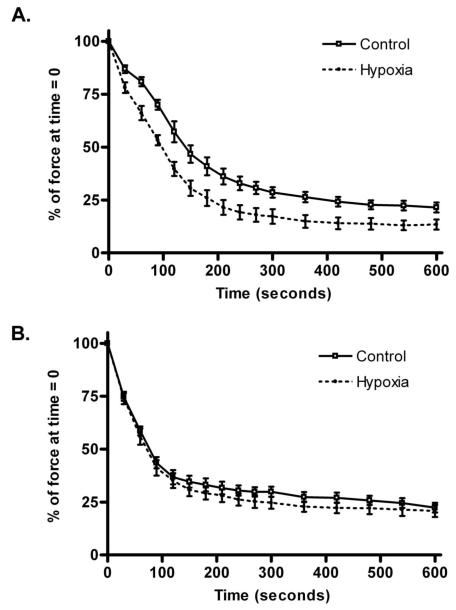
The initial experiment was to examine whether hypoxia alters the isometric contractile function and fatigue resistance of the diaphragm and limb muscles. Since the triceps surae complex is too large for in vitro functional studies, we used the soleus, one of its component muscles. There was no difference in the specific force in either diaphragm or soleus from the Control and Hypoxia groups: 32.7±2.9 vs. 31.9±3.8 N/cm2 in soleus and 22.9±3.0 vs. 24.1±1.6 N/cm2 in diaphragm; Control vs. Hypoxia respectively. The weights of soleus muscles and diaphragm bundles were similar between the groups: 10.1±0.9 vs. 11.2±0.6 mg in soleus and 4.8±0.5 vs. 5.0±0.8 mg in diaphragm; Control vs. Hypoxia respectively. Two-way repeated measures ANOVA showed that chronic hypoxia did not change the force frequency relationship in either muscle (p=0.25 and p=0.36, soleus and diaphragm respectively). As expected, the Hypoxia soleus muscles fatigued more rapidly compared to the Control group (figure 1A); in consequence, the fatigue index was significantly lower in the Hypoxia group: 21.5±2.6 vs. 13.4±2.4, Control and Hypoxia respectively, p=0.04. Similarly, the Hypoxia diaphragm muscle bundles fatigued at the same rate as those from the Control group (figure 1B), and the fatigue indices were not significantly different: 22.3±2.3 vs. 20.8±2.9, Control and Hypoxia respectively, p=0.68.
Figure 1.
Effects of 4 weeks of chronic normobaric hypoxia on fatigue in diaphragm and soleus. (A) Soleus muscles from the Hypoxia group fatigued faster compared to Control: the curves diverged almost immediately after the start of the fatigue protocol and the force produced by the Hypoxia muscles were significantly less at each one of the time points shown (p<0.05, n ≥ 7 muscles per group). (B) Fatigue curves from Control and Hypoxia diaphragm muscle bundles. Force decreased equally in both groups over the duration of the fatigue protocol; there were no significant differences at any time point (n ≥ 7 muscles per group).
Chronic hypoxia decreases fiber cross-sectional area in the mouse diaphragm
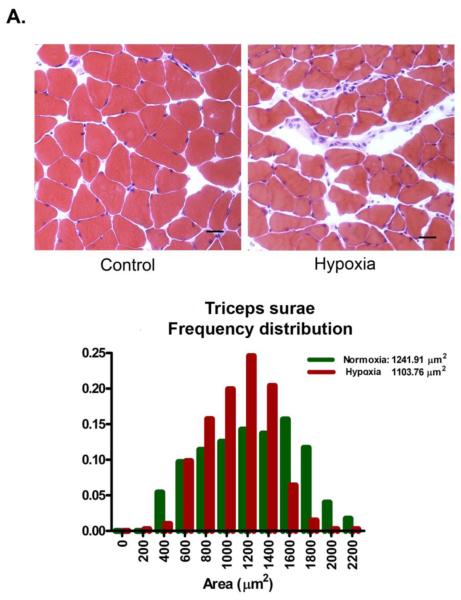
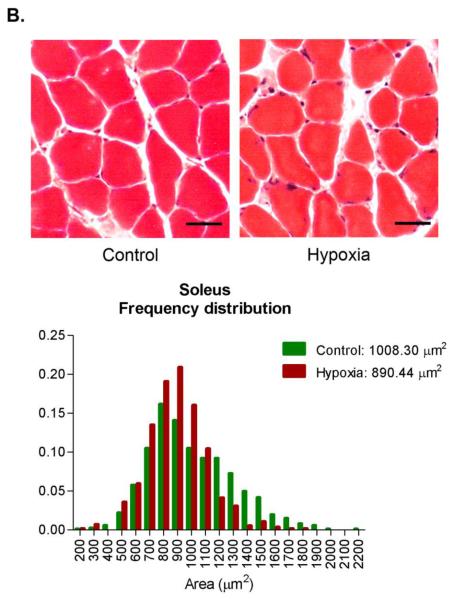
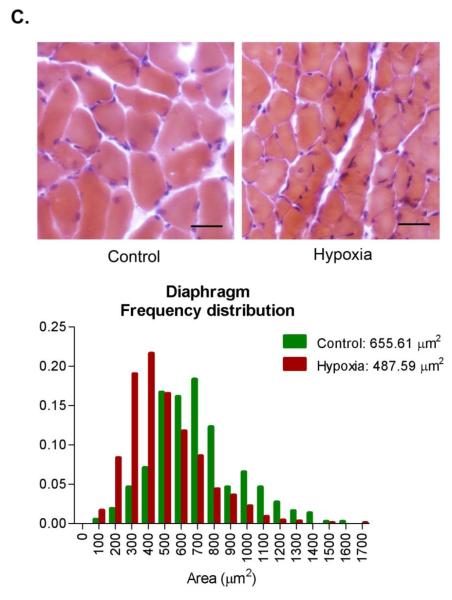
A potential adaptive response to chronic hypoxia is to reduce the diffusion distance for oxygen [47]. In skeletal muscles, this response could be accomplished by decreasing muscle fiber cross-sectional area. To test for this possibility, we measured fiber areas in histological sections from Control and Hypoxia triceps surae and diaphragm muscles. The triceps surae is composed of 3 different muscles, gastrocnemius, plantaris and soleus. Because of differences in fiber size, gastrocnemius and plantaris were analyzed separate from soleus. There was no statistical difference in Control and Hypoxia gastrocnemius and plantaris muscle fiber cross-sectional areas: 1104 ± 179 and 1242 ± 259 μm2, Control and Hypoxia respectively, p= 0.34 (a total of 2181 fibers from 4 different animals in each group, figure 2A). Similarly, there was no difference in soleus cross-sectional area between the groups: 1008 ± 304 and 890 ± 214 μm2, Control and Hypoxia respectively, p= 0.19 (a total of 1422 fibers from 4 different animals in each group, figure 2B). Hypoxia decreased mean fiber cross sectional area by about 25% in the diaphragm: 656 ± 59 and 488 ± 55 μm2, Control and Hypoxia respectively, p<0.001 (a total of 1872 fibers from 4 different animals in each group, figure 2C).
Figure 2.
Fiber cross sectional area in triceps surae and diaphragm. Muscles were collected, frozen, sectioned (10 μm thickness) and stained with hematoxylin & eosin. No change was observed in fiber cross sectional area in either gastrocnemius/plantaris (A) or soleus (B) whereas there is a significant decrease in diaphragm (C, scale bar= 25 μm).
Chronic hypoxia increases the capillary to fiber contact ratio in diaphragm but not in limb muscles
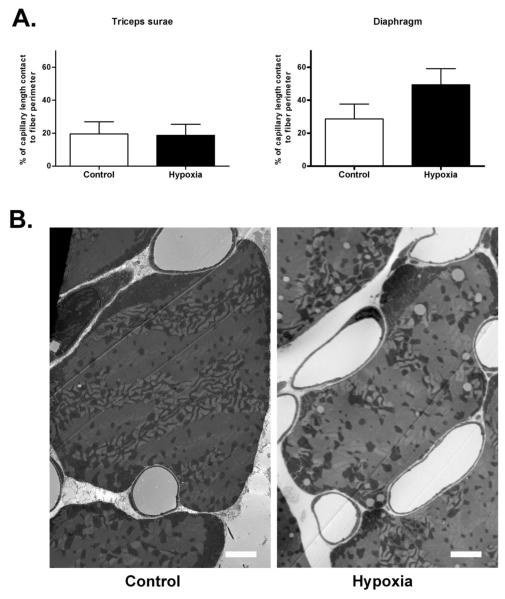
Capillary surface per fiber surface is a critical factor to determine maximal oxygen flux to muscle [37]. Thus, we measured the ratio between capillary contact length and fiber perimeter. We found that the ratio was higher in the Hypoxia diaphragm compared to Control but was same in the triceps surae between the groups (figure 3, p<0.001, a total of 104 fibers from 4 different mice in each group).
Figure 3.
Ratio of capillary surface contact and fiber perimeter in triceps surae and diaphragm. There was a significant increase (p<0.001) in the capillary contact length to fiber perimeter ratio in Hypoxia diaphragm compared to Control (A). No change was observed in triceps surae. Representative electron micrographs of diaphragm showing the increased capillary length contact in the Hypoxia group (B, scale bar= 2 μm).
Chronic hypoxia alters mitochondrial function in the mouse diaphragm and limb muscles
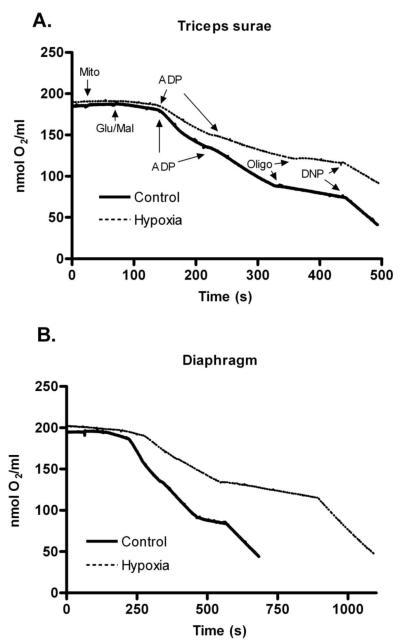
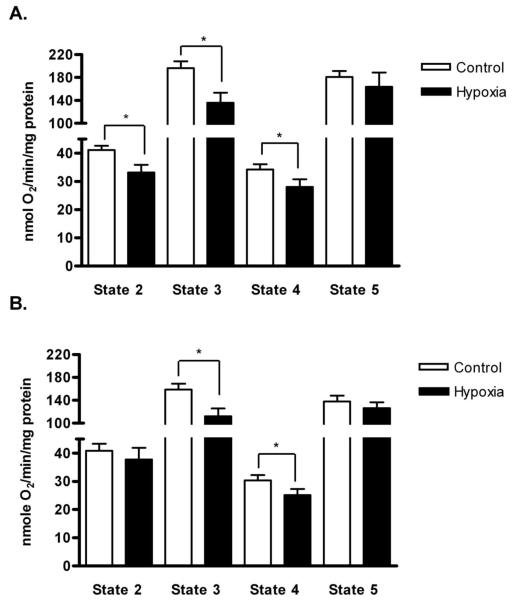
The mitochondria are the most important cellular sink for oxygen use. We used mitochondria isolated from diaphragm and triceps surae to examine the consequences of chronic hypoxia on oxygen consumption rates. Figure 4 shows representative oxygen consumption records of triceps surae and diaphragm mitochondria from the Control and Hypoxia groups. State 2 respiration is the small change in oxygen consumption following the addition of substrates (glutamate and malate). The slope becomes more negative (oxygen is consumed faster) when ADP is added to the medium, and that is called state 3 respiration. State 4 is low-level oxygen consumption when ATP synthase is blocked (oligomycin). Finally, state 5 is the fast oxygen consumption rate when mitochondria are fully uncoupled with DNP. The RCR (ratio of state 3 to state 4) values were not different between treatments: 5.4±0.5 and 4.6±0.5 in diaphragm and 5.8±0.4 and 4.9±0.5 in triceps surae, Control and Hypoxia respectively. These values are in the acceptable range to document mitochondrial integrity. The most noticeable change in the Hypoxia group was a reduction in the slope of the substrate- and ADP-stimulated respiration (state 3) in both muscle groups. In other words, chronic hypoxia appears to decrease oxygen consumption in actively respiring mitochondria. Overall, states 3 and 4 were significantly slower in the Hypoxia triceps surae and diaphragm (p<0.01 for state 3 comparisons, p<0.05 for state 4, figure 5). In addition, state 2 respiration was significantly slower in triceps surae from the Hypoxia group (p<0.01; figure 5A). Chronic hypoxia did not change the uncoupled state 5 respiration in either muscle.
Figure 4.
Representative oxygen consumption tracings by mitochondria (Mito, 360ug/ml) isolated from Control (solid lines) and Hypoxia (dashed lines) triceps surae (A) and diaphragm (B) from the Control (solid lines) and Hypoxia (dashed lines) groups. After equilibration, oxygen consumption was initiated by addition of glutamate and malate (Glu/Mal, state 2). ADP was added to measure state 3. State 4 was measured in the presence of oligomycin (Oligo). Finally, dinitrophenol (DNP) was used to measure the uncoupled oxygen consumption (state 5). Oxygen consumption rates (line slopes) are noticeable slower in triceps surae and diaphragm from the Hypoxia group.
Figure 5.
Mitochondrial respiration rates in triceps sure and diaphragm from the Control and Hypoxia groups. Oxygen consumption rates were normalized to mitochondrial protein. (A) With the exception of state 5, all the respiration rates were lower in Hypoxia triceps surae compared to Control. (B) For the diaphragm, states 3 and 4 were significantly lower in Hypoxia compared to Control. Data are means ± SEM, n=8 muscles per group, *p<0.05.
Chronic hypoxia does not change muscle ATP content
To assess the consequences of altered mitochondrial function, we measured ATP content in the triceps surae and diaphragm from the Control and Hypoxia groups. In triceps surae ATP levels were 4.9 ± 0.4 and 4.8 ± 0.4 μmoles/g tissue (Control and Hypoxia, respectively, p= not significant). Diaphragm ATP content was 5.7 ± 0.6 and 5.3 ± 0.9 μmoles/g tissue (Control and Hypoxia, respectively, p= not significant).
Hypoxia alters the content of mitochondrial respiratory complexes
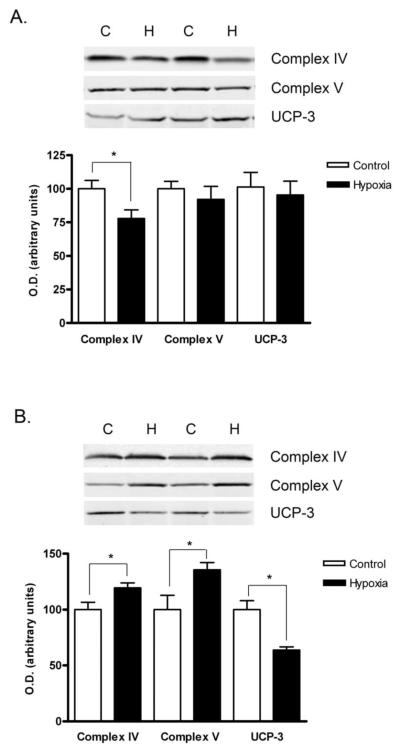
Given the changes in mitochondrial function after chronic hypoxia, we used western blotting to evaluate the effect of hypoxia on mitochondrial respiratory complex content. Complex IV (cytochrome c oxidase) content was significantly lower in Hypoxia triceps surae (p<0.02, figure 6A). Complexes I and II tended to be lower in the Hypoxia triceps surae, but the differences did not reach statistical significance (p=0.10 and p=0.06 for complex I and II respectively, figure 6A). By contrast, 4 weeks of chronic hypoxia significantly increased the content of complexes IV (cytochrome c oxidase, p<0.04) and V (ATP synthase, p<0.05) in the mouse diaphragm (Figure 6B). Complex III content showed a tendency to be higher in the Hypoxia diaphragm but this difference did not reach statistical significance (p=0.07, Figure 6B).
Figure 6.
Western blot analysis of proteins from isolated mitochondria. Representative western blots and densitometric quantification of mitochondrial proteins of interest from Control and Hypoxia triceps surae (A) and diaphragm (B). The content of respiratory complex IV was lower in triceps surae mitochondria from the Hypoxia Group; there were no other significant differences. Mitochondria from Hypoxia diaphragms had increased content of complexes IV and V and less UCP-3. Data are means ± SEM, n=6 animals per group, *p<0.05.
Hypoxia decreases UCP-3 content in mouse diaphragm
Changes in uncoupling protein 3 (UCP-3), a muscle-specific mitochondrial uncoupling protein, could explain the decrease in state 3 respiration without a corresponding decrease in state 5 seen in the Hypoxia group. We measured UCP-3 content in mitochondria isolated from Control and Hypoxia triceps surae and diaphragm. UCP-3 content did not change in triceps surae, but it was significantly lower in the Hypoxia diaphragm, (figure 6, p=0.70 and p<0.01, respectively).
Discussion
The purpose of this study was to contrast the effect of chronic hypoxia on fatigue resistance and mitochondrial function in the mouse diaphragm and limb muscles. As expected, the mouse diaphragm did not become more fatigable after 4 weeks of normobaric hypoxia while the soleus, a limb muscle that is part of the triceps surae complex, did. Surprisingly, chronic hypoxia decreased mitochondrial respiration rates in the diaphragm and the triceps surae. However, the changes in mitochondrial composition in response to chronic hypoxia were different in each muscle. The only significant change in triceps surae was a decrease in subunit VIb of complex IV content, whereas in diaphragm there is an increased content of subunit VIb of complex IV and subunit α of complex V but decreased content of UCP-3. This study is the first to show that chronic hypoxia produces a differential change in mitochondrial protein content, which may explain the differences in endurance after chronic hypoxia between soleus and diaphragm.
Chronic hypoxia and skeletal muscle endurance
The effects of hypoxia on endurance are still controversial. Acute hypoxia exposure (hours to 1 day) does increase fatigability in human limb muscles [11;17]. However, the effects of chronic hypoxia are less understood: rodent limb muscles consistently show increased fatigability after chronic hypoxia, but the results are somewhat contradictory in humans,[6;17;32]. In addition, few studies have evaluated the effect of chronic hypoxia on diaphragm function: One study showed decreased diaphragm endurance in chronically hypoxemic humans [55], while another study in rats showed that 6 weeks of hypobaric hypoxia have no effect on diaphragm fatigability [12]. A recent study also found that diaphragm become more resistant to fatigue after chronic hypoxia exposure [38]. The consensus is that the diaphragm may be more tolerant to hypoxia compared to limb muscles [31]. Our findings agree with this postulate: 4 weeks of normobaric hypoxia did not change endurance of the mouse diaphragm in vitro, whereas the soleus fatigues more rapidly. While this result could be explained at least in part by inherent differences in oxidative capacity between the two muscles [46;51], we found evidence of further adaptation of the mouse diaphragm to chronic hypoxia. One such example is the reduction in fiber cross sectional area in the Hypoxia diaphragm, but not in triceps surae. Degens et al. recently described that fiber cross sectional area is decreased in diaphragm fibers, particularly in type IIa fibers [10]. In addition, we found that capillary contact surface is increased in the Hypoxia diaphragm. A similar finding was observed in muscles of finches living at high altitude [24]. These two adaptive changes would facilitate oxygen and substrate diffusion into the diaphragm and would explain the sustained endurance in the diaphragm after chronic hypoxia. The differences in fatigability between diaphragm and soleus from the Hypoxia group may also be explained by a shift in skeletal muscle fiber type. Thus, a muscle with a greater proportion of slow twitch fiber type (rich in mitochondria) is more resistant to fatigue. We have not measured fiber type composition in this study to support this hypothesis; however, most evidence pointed to no change in fiber type with chronic high altitude exposure [22;23]. Moreover, mouse soleus is already mostly type I and IIa (mitochondria-rich).
Chronic hypoxia and mitochondrial function
Since the mitochondria are the final oxygen acceptor, it is surprising that so few studies have evaluated the consequences of chronic hypoxia on mitochondrial function. Three weeks of hypoxia reduces oxygen consumption in isolated mitochondria and decreases cytochrome c oxidase activity in mouse brains [4;7;33]. In rats, Costa et al. found no change in mitochondrial respiration in samples obtained from both cardiac ventricles after 9 months of hypobaric hypoxia [9], while others demonstrated decreased oxygen consumption after more than 7 days of hypoxia [13;42]. This difference may be related to tissue sampling (right vs. left ventricle) and the duration of hypoxia. In general, most studies of human and non-human skeletal muscles point to decreased mitochondrial oxidative capacity after chronic hypoxia [21;29;30]. Mitochondrial oxygen consumption rates decrease in rodent hind limb muscles after acute (state 3 and 4) and chronic hypoxia (state 2 and 3) [18;35]. Our results concur: mitochondria from triceps surae had lower respiration rates after 4 weeks of hypoxia. This change could be explained by reduction in either activity or content of respiratory complexes. We did not measure activity, but we found lower complex IV content in the triceps surae mitochondria after hypoxia. To the best of our knowledge, oxygen consumption in isolated mitochondria had not been measured in the diaphragm after chronic hypoxia. Despite the lack of effect of chronic hypoxia on endurance and contrary to our initial hypothesis, the increased workload imposed by hypoxia did not prevent changes in mitochondrial function. Instead, mitochondrial respiration was decreased in the diaphragm after four weeks of hypoxia. To complicate matters, the content of complexes IV and V increased in the mitochondria isolated from diaphragm after four weeks of hypoxia, the opposite effect of what the respiration rates predicted. However, we cannot exclude that respiratory complex activities changed as well: we have already shown that concordance between the content and activity of respiratory complexes is non-existent in some muscles [43].
Metabolic integration in skeletal muscles after chronic hypoxia
Chronic hypoxia did not alter the fatigue resistance of the mouse diaphragm but it changed mitochondrial function and composition. These seemingly incongruent results might be explained by the lower UCP-3 in diaphragm mitochondria after chronic hypoxia. UCP-3 is a member of a family of inner membrane mitochondrial proteins responsible for dissipating the proton gradients; UCP-3 is particularly abundant in skeletal muscles [53]. UCP-3 knockout mice have lower mitochondrial respiration rates, particularly state 4, whereas UCP-3 overexpression results in higher state 4 [5;20;52]. It should be noted that 7 days of hypoxia is also associated with reduced UCP-3 mRNA levels in the left ventricle of rats [13]. Newborns and adult rats exposed to chronic hypoxia have lower levels of UCP-1 in brown fat [40;41]. Thus, it appears that chronic hypoxia decreases the expression of uncoupler protein genes. Since mitochondrial proton leak accounts for about 20% of mitochondrial oxygen consumption, lower UCP-3 should serve to optimize mitochondrial respiration when oxygen levels are low [1]. In other words, lower UCP-3 content would reduce the proton leak and as result decrease the amount of oxygen (i.e. mitochondrial respiration) needed to meet the metabolic demands. These are the type of changes we observed in diaphragm but not in triceps surae: lower mitochondrial respiration rates and no effect on fatigue, a combination explained by lower UCP-3 levels. Consistent with this argument, others have shown that endurance training results in lower UCP-3 content in skeletal muscles [39;45]. Another unique adaptation of the diaphragm to hypoxia, that we have previously shown, is the redistribution of mitochondria to clusters under the sarcolemma, close to the capillaries [19]. This finding (in addition to the smaller fiber cross sectional area and the increase in surface contact between capillaries and fibers) would enhance the oxygen flux and diffusion from the capillaries to mitochondria, increasing the oxygen transfer efficiency [36;37].
In conclusion, chronic hypoxia triggers a unique combination of adaptive changes in the mouse diaphragm, including reduction in fiber size, increased surface contact between the capillary and fiber, and reduced UCP-3 content that allow this muscle to remain highly fatigue resistant, in contrast to the effects on hind limb muscles. However, lower mitochondrial respiration seems to be a common response of skeletal muscles to chronic hypoxia, regardless of recruitment levels. Hypometabolism and lower oxygen consumption have been characterized as adaptive mechanisms in hypoxia tolerant animals [25;44;48]. Therefore, decreased mitochondrial oxygen consumption would be part of the adaptive response to chronic hypoxia rather than a negative consequence of it. Furthermore, this study is the first to show that chronic hypoxia produce a differential change in mitochondrial proteins content that may explain the functional differences observed
Acknowledgments
This study was supported by a National Institute of Health / National Institute of General Medical Sciences grant to JLG (F31GM846552).
References
- [1].Bickler PE, Buck LT. Hypoxia Tolerance in Reptiles, Amphibians, and Fishes: Life with Variable Oxygen Availability. Annu. Rev. Physiol. 2007;69:145. doi: 10.1146/annurev.physiol.69.031905.162529. [DOI] [PubMed] [Google Scholar]
- [2].Bigard AX, Brunet A, Serrurier B, Guezennec CY, Monod H. Effects of endurance training at high altitude on diaphragm muscle properties. Pflugers Arch. 1992;422:239–244. doi: 10.1007/BF00376208. [DOI] [PubMed] [Google Scholar]
- [3].Bradford MM. A rapid and sensitive method for the quantitation of microgram quantities of protein utilizing the principle of protein-dye binding. Analytical Biochemistry. 1976;72:248–254. doi: 10.1016/0003-2697(76)90527-3. [DOI] [PubMed] [Google Scholar]
- [4].Caceda R, Gamboa JL, Boero JA, Monge C, Arregui A. Energetic metabolism in mouse cerebral cortex during chronic hypoxia. Neurosci. Lett. 2001;301:171–174. doi: 10.1016/s0304-3940(01)01630-5. [DOI] [PubMed] [Google Scholar]
- [5].Cadenas S, Echtay KS, Harper JA, Jekabsons MB, Buckingham JA, Grau E, Abuin A, Chapman H, Clapham JC, Brand MD. The basal proton conductance of skeletal muscle mitochondria from transgenic mice overexpressing or lacking uncoupling protein-3. J Biol Chem. 2002;277:2773–2778. doi: 10.1074/jbc.M109736200. [DOI] [PubMed] [Google Scholar]
- [6].Caquelard F, Burnet H, Tagliarini F, Cauchy E, Richalet JP, Jammes Y. Effects of prolonged hypobaric hypoxia on human skeletal muscle function and electromyographic events. Clin. Sci. 2000;98:329–337. [PubMed] [Google Scholar]
- [7].Chavez JC, Pichiule P, Boero J, Arregui A. Reduced mitochondrial respiration in mouse cerebral cortex during chronic hypoxia. Neurosci. Lett. 1995;193:169–172. doi: 10.1016/0304-3940(95)11692-p. [DOI] [PubMed] [Google Scholar]
- [8].Close RI. Dynamic properties of mammalian skeletal muscles. Physiol. Rev. 1972;52:129–197. doi: 10.1152/physrev.1972.52.1.129. [DOI] [PubMed] [Google Scholar]
- [9].Costa LE, Boveris A, Koch OR, Taquini AC. Liver and heart mitochondria in rats submitted to chronic hypobaric hypoxia. Am J Physiol. 1988;255:C123–C129. doi: 10.1152/ajpcell.1988.255.1.C123. [DOI] [PubMed] [Google Scholar]
- [10].Degens H, Bosutti A, Gilliver S, Slevin M, van Heijst A, W++st R. Changes in contractile properties of skinned single rat soleus and diaphragm fibres after chronic hypoxia. Pfl++gers Archiv European Journal of Physiology. 2010;460:863–873. doi: 10.1007/s00424-010-0866-5. [DOI] [PubMed] [Google Scholar]
- [11].Eiken O, Tesch PA. Effects of hyperoxia and hypoxia on dynamic and sustained static performance of the human quadriceps muscle. Acta Physiol Scand. 1984;122:629–633. doi: 10.1111/j.1748-1716.1984.tb07553.x. [DOI] [PubMed] [Google Scholar]
- [12].El-Khoury R, O’Halloran KD, Bradford A. Effects of chronic hypobaric hypoxia on contractile properties of rat sternohyoid and diaphragm muscles. Clin. Exp. Pharmacol. Physiol. 2003;30:551–554. doi: 10.1046/j.1440-1681.2003.03874.x. [DOI] [PubMed] [Google Scholar]
- [13].Essop MF, Razeghi P, McLeod C, Young ME, Taegtmeyer H, Sack MN. Hypoxia-induced decrease of UCP3 gene expression in rat heart parallels metabolic gene switching but fails to affect mitochondrial respiratory coupling. Biochemical and Biophysical Research Communications. 2004;314:561–564. doi: 10.1016/j.bbrc.2003.12.121. [DOI] [PubMed] [Google Scholar]
- [14].Fiskum G, Murphy AN, Beal MF. Mitochondria in Neurodegeneration: Acute Ischemia and Chronic Neurodegenerative Diseases. J Cereb Blood Flow Metab. 1999;19:351–369. doi: 10.1097/00004647-199904000-00001. [DOI] [PubMed] [Google Scholar]
- [15].Fitts RH. Cellular mechanisms of muscle fatigue. Physiol. Rev. 1994;74:49–94. doi: 10.1152/physrev.1994.74.1.49. [DOI] [PubMed] [Google Scholar]
- [16].Frezza C, Cipolat S, Scorrano L. Organelle isolation: functional mitochondria from mouse liver, muscle and cultured fibroblasts. Nat. Protocols. 2007;2:287–295. doi: 10.1038/nprot.2006.478. [DOI] [PubMed] [Google Scholar]
- [17].Fulco CS, Cymerman A, Muza SR, Rock PB, Pandolf KB, Lewis SF. Adductor pollicis muscle fatigue during acute and chronic altitude exposure and return to sea level. J Appl Physiol. 1994;77:179–183. doi: 10.1152/jappl.1994.77.1.179. [DOI] [PubMed] [Google Scholar]
- [18].Galbes O, Goret L, Caillaud C, Mercier J, Obert P, Candau R, Py G. Combined effects of hypoxia and endurance training on lipid metabolism in rat skeletal muscle. Acta Physiol (Oxf) 2008;193:163–173. doi: 10.1111/j.1748-1716.2007.01794.x. [DOI] [PubMed] [Google Scholar]
- [19].Gamboa JL, Andrade FH. Mitochondrial content and distribution changes specific to mouse diaphragm after chronic normobaric hypoxia. Am J Physiol Regul. Integr. Comp Physiol. 2010;298:R575–R583. doi: 10.1152/ajpregu.00320.2009. [DOI] [PMC free article] [PubMed] [Google Scholar]
- [20].Gong DW, Monemdjou S, Gavrilova O, Leon LR, Marcus-Samuels B, Chou CJ, Everett C, Kozak LP, Li C, Deng C, Harper ME, Reitman ML. Lack of obesity and normal response to fasting and thyroid hormone in mice lacking uncoupling protein-3. J Biol Chem. 2000;275:16251–16257. doi: 10.1074/jbc.M910177199. [DOI] [PubMed] [Google Scholar]
- [21].Green HJ, Sutton JR. The effects of altitude on skeletal muscle. In: Hornbein TF, Schoene RB, editors. High Altitude: An Exploration of Human Adaptation. Marcel Dekker, Inc.; New York: 2001. pp. 443–492. [Google Scholar]
- [22].Green HJ, Sutton JR, Cymerman A, Young PM, Houston CS. Operation Everest II: adaptations in human skeletal muscle. J. Appl. Physiol. 1989;66:2454–2461. doi: 10.1152/jappl.1989.66.5.2454. [DOI] [PubMed] [Google Scholar]
- [23].Green HJ, Sutton JR, Wolfel EE, Reeves JT, Butterfield GE, Brooks GA. Altitude acclimatization and energy metabolic adaptations in skeletal muscle during exercise. J Appl Physiol. 1992;73:2701–2708. doi: 10.1152/jappl.1992.73.6.2701. [DOI] [PubMed] [Google Scholar]
- [24].Hepple RT, Agey PJ, Hazelwood L, Szewczak JM, MacMillen RE, Mathieu-Costello O. Increased capillarity in leg muscle of finches living at altitude. J Appl Physiol. 1998;85:1871–1876. doi: 10.1152/jappl.1998.85.5.1871. [DOI] [PubMed] [Google Scholar]
- [25].Hochachka PW, Buck LT, Doll CJ, Land SC. Unifying theory of hypoxia tolerance: molecular/metabolic defense and rescue mechanisms for surviving oxygen lack. Proceedings of the National Academy of Sciences of the United States of America. 1996;93:9493–9498. doi: 10.1073/pnas.93.18.9493. [DOI] [PMC free article] [PubMed] [Google Scholar]
- [26].Holloszy JO, Coyle EF. Adaptations of skeletal muscle to endurance exercise and their metabolic consequences. J Appl Physiol. 1984;56:831–838. doi: 10.1152/jappl.1984.56.4.831. [DOI] [PubMed] [Google Scholar]
- [27].Hood DA. Plasticity in Skeletal, Cardiac, and Smooth Muscle: Invited Review: Contractile activity-induced mitochondrial biogenesis in skeletal muscle. J Appl Physiol. 2001;90:1137–1157. doi: 10.1152/jappl.2001.90.3.1137. [DOI] [PubMed] [Google Scholar]
- [28].Hoppeler H, Kleinert E, Schlegel C, Claassen H, Howald H, Kayar SR, Cerretelli P. Morphological adaptations of human skeletal muscle to chronic hypoxia. Int. J. Sports Med. 1990;11(Suppl 1):S3–S9. doi: 10.1055/s-2007-1024846. [DOI] [PubMed] [Google Scholar]
- [29].Hoppeler H, Vogt M. Muscle tissue adaptations to hypoxia. J. Exp. Biol. 2001;204:3133–3139. doi: 10.1242/jeb.204.18.3133. [DOI] [PubMed] [Google Scholar]
- [30].Hoppeler H, Vogt M, Weibel ER, Fluck M. Response of skeletal muscle mitochondria to hypoxia. Exp. Physiol. 2003;88:109–119. doi: 10.1113/eph8802513. [DOI] [PubMed] [Google Scholar]
- [31].Jammes Y, Zattara-Hartmann MC, Badier M. Functional consequences of acute and chronic hypoxia on respiratory and skeletal muscles in mammals. Comp Biochem. Physiol A Physiol. 1997;118:15–22. doi: 10.1016/s0300-9629(96)00371-4. [DOI] [PubMed] [Google Scholar]
- [32].Kayser B, Narici M, Binzoni T, Grassi B, Cerretelli P. Fatigue and exhaustion in chronic hypobaric hypoxia: influence of exercising muscle mass. J Appl Physiol. 1994;76:634–640. doi: 10.1152/jappl.1994.76.2.634. [DOI] [PubMed] [Google Scholar]
- [33].LaManna JC, Kutina-Nelson KL, Hritz MA, Huang Z, Wong-Riley MT. Decreased rat brain cytochrome oxidase activity after prolonged hypoxia. Brain Res. 1996;720:1–6. doi: 10.1016/0006-8993(95)01495-0. [DOI] [PubMed] [Google Scholar]
- [34].MacDougall JD, Green HJ, Sutton JR, Coates G, Cymerman A, Young P, Houston CS. Operation Everest II: structural adaptations in skeletal muscle in response to extreme simulated altitude. Acta Physiol Scand. 1991;142:421–427. doi: 10.1111/j.1748-1716.1991.tb09176.x. [DOI] [PubMed] [Google Scholar]
- [35].Magalhaes J, Ascensao A, Soares JMC, Ferreira R, Neuparth MJ, Marques F, Duarte JA. Acute and severe hypobaric hypoxia increases oxidative stress and impairs mitochondrial function in mouse skeletal muscle. J Appl Physiol. 2005;99:1247–1253. doi: 10.1152/japplphysiol.01324.2004. [DOI] [PubMed] [Google Scholar]
- [36].Mainwood GW, Rakusan K. A model for intracellular energy transport. Can. J Physiol Pharmacol. 1982;60:98–102. doi: 10.1139/y82-016. [DOI] [PubMed] [Google Scholar]
- [37].Mathieu-Costello O, Hepple RT. Muscle Structural Capacity for Oxygen Flux from Capillary to Fiber Mitochondria. Exercise and Sport Sciences Reviews. 2002;30 doi: 10.1097/00003677-200204000-00007. [DOI] [PubMed] [Google Scholar]
- [38].McMorrow C, Fredsted A, Carberry J, OΓÇÖConnell RA, Bradford A, Jones JFX, OΓÇÖHalloran KD. Chronic hypoxia increases rat diaphragm muscle endurance and sodiumΓÇôpotassium ATPase pump content. European Respiratory Journal. 2011;37:1474–1481. doi: 10.1183/09031936.00079810. [DOI] [PubMed] [Google Scholar]
- [39].Mogensen M, Bagger M, Pedersen PK, Fernstr+¦m M, Sahlin K. Cycling efficiency in humans is related to low UCP3 content and to type I fibres but not to mitochondrial efficiency. The Journal of Physiology. 2006;571:669–681. doi: 10.1113/jphysiol.2005.101691. [DOI] [PMC free article] [PubMed] [Google Scholar]
- [40].Mortola JP, Naso L. Brown adipose tissue and its uncoupling protein in chronically hypoxic rats. Clin. Sci. 1997;93:349–354. doi: 10.1042/cs0930349. [DOI] [PubMed] [Google Scholar]
- [41].Mortola JP, Naso L. Thermogenesis in newborn rats after prenatal or postnatal hypoxia. J Appl Physiol. 1998;85:84–90. doi: 10.1152/jappl.1998.85.1.84. [DOI] [PubMed] [Google Scholar]
- [42].Nouette-Gaulain K, Malgat M, Rocher C, Savineau JP, Marthan R, Mazat JP, Sztark F. Time course of differential mitochondrial energy metabolism adaptation to chronic hypoxia in right and left ventricles. Cardiovasc Res. 2005;66:132–140. doi: 10.1016/j.cardiores.2004.12.023. [DOI] [PubMed] [Google Scholar]
- [43].Patel SP, Gamboa JL, McMullen CA, Rabchevsky A, Andrade FH. Lower respiratory capacity in extraocular muscle mitochondria: evidence for intrinsic differences in mitochondrial composition and function. Invest Ophthalmol. Vis. Sci. 2009;50:180–186. doi: 10.1167/iovs.08-1911. [DOI] [PMC free article] [PubMed] [Google Scholar]
- [44].Ramirez JM, Folkow LP, Blix AS. Hypoxia Tolerance in Mammals and Birds: From the Wilderness to the Clinic. Annu. Rev. Physiol. 2007;69:113–143. doi: 10.1146/annurev.physiol.69.031905.163111. [DOI] [PubMed] [Google Scholar]
- [45].Russell AP, Wadley G, Hesselink MK, Schaart G, Lo S, Leger B, Garnham A, Kornips E, Cameron-Smith D, Giacobino JP, Muzzin P, Snow R, Schrauwen P. UCP3 protein expression is lower in type I, IIa and IIx muscle fiber types of endurance-trained compared to untrained subjects. Pflugers Arch. 2003;445:563–569. doi: 10.1007/s00424-002-0943-5. [DOI] [PubMed] [Google Scholar]
- [46].Sharp JT, Hyatt RE. Mechanical and electrical properties of respiratory muscles. In: American Physiological Society, editor. Handbook of Physiology. Section 3: The respiratory system. Bethesda: 1986. pp. 389–414. [Google Scholar]
- [47].Snyder GK, Wilcox EE, Burnham EW. Effects of hypoxia on muscle capillarity in rats. Respiration physiology. 1985;62:135–140. doi: 10.1016/0034-5687(85)90057-x. [DOI] [PubMed] [Google Scholar]
- [48].St-Pierre J, Tattersall GJ, Boutilier RG. Metabolic depression and enhanced O2 affinity of mitochondria in hypoxic hypometabolism. Am J Physiol Regul Integr Comp Physiol. 2000;279:R1205–R1214. doi: 10.1152/ajpregu.2000.279.4.R1205. [DOI] [PubMed] [Google Scholar]
- [49].Sullivan SM, Pittman RN. Relationship between mitochondrial volume density and capillarity in hamster muscles. American Journal of Physiology - Heart and Circulatory Physiology. 1987;252:H149–H155. doi: 10.1152/ajpheart.1987.252.1.H149. [DOI] [PubMed] [Google Scholar]
- [50].Svedenhag J, Henriksson J, Sylven C. Dissociation of training effects on skeletal muscle mitochondrial enzymes and myoglobin in man. Acta Physiol Scand. 1983;117:213–218. doi: 10.1111/j.1748-1716.1983.tb07199.x. [DOI] [PubMed] [Google Scholar]
- [51].Totsuka Y, Nagao Y, Horii T, Yonekawa H, Imai H, Hatta H, Izaike Y, Tokunaga T, Atomi Y. Physical performance and soleus muscle fiber composition in wild-derived and laboratory inbred mouse strains. J Appl Physiol. 2003;95:720–727. doi: 10.1152/japplphysiol.00946.2002. [DOI] [PubMed] [Google Scholar]
- [52].Vidal-Puig AJ, Grujic D, Zhang CY, Hagen T, Boss O, Ido Y, Szczepanik A, Wade J, Mootha V, Cortright R, Muoio DM, Lowell BB. Energy metabolism in uncoupling protein 3 gene knockout mice. J Biol Chem. 2000;275:16258–16266. doi: 10.1074/jbc.M910179199. [DOI] [PubMed] [Google Scholar]
- [53].Vidal-Puig A, Solanes G, Grujic D, Flier JS, Lowell BB. UCP3: An Uncoupling Protein Homologue Expressed Preferentially and Abundantly in Skeletal Muscle and Brown Adipose Tissue. Biochemical and Biophysical Research Communications. 1997;235:79–82. doi: 10.1006/bbrc.1997.6740. [DOI] [PubMed] [Google Scholar]
- [54].Wen JJ, Bhatia V, Popov VL, Garg NJ. Phenyl-{alpha}-tert-Butyl Nitrone Reverses Mitochondrial Decay in Acute Chagas’ Disease. Am J Pathol. 2006;169:1953–1964. doi: 10.2353/ajpath.2006.060475. [DOI] [PMC free article] [PubMed] [Google Scholar]
- [55].Zattara-Hartmann MC, Badier M, Guillot C, Tomei C, Jammes Y. Maximal force and endurance to fatigue of respiratory and skeletal muscles in chronic hypoxemic patients: the effects of oxygen breathing. Muscle Nerve. 1995;18:495–502. doi: 10.1002/mus.880180504. [DOI] [PubMed] [Google Scholar]


