

Abstract
Extracellular stiffness has been shown to alter long timescale cell behaviors such as growth and differentiation, but the cellular response to changes in stiffness on short timescales is poorly understood. By studying the contractile response of cells to dynamic stiffness conditions using an atomic force microscope, we observe a seconds-timescale response to a step change in extracellular stiffness. Specifically, we observe acceleration in contraction velocity (μm/min) and force rate (nN/min) upon a step decrease in stiffness and deceleration upon a step increase in stiffness. Interestingly, this seconds-timescale response to a change in extracellular stiffness is not altered by inhibiting focal adhesion signaling or stretch-activated ion channels and is independent of cell height and contraction force. Rather, the response timescale is altered only by disrupting cytoskeletal mechanics and is well described by a simple mechanical model of a constant velocity actuator pulling against an internal cellular viscoelastic network. Consistent with the predictions of this model, we find that an osmotically expanding hydrogel responds to step changes in extracellular stiffness in a similar manner to cells. We therefore propose that an initial event in stiffness sensing is establishment of a mechanical equilibrium that balances contraction of the viscoelastic cytoskeleton with deformation of the extracellular matrix.
Introduction
The stiffness of the extracellular microenvironment has been shown to affect a broad set of cellular behaviors including cell spreading (1), motility (2), proliferation, differentiation (3), and tumorigenesis (4,5). Studies have implicated over 150 signaling and structural proteins involved in responding to mechanical cues such as stiffness and force (6,7). Actomyosin contraction is known to play an important role in mechanosensing, as it is required for stiffness-directed stem cell differentiation (3), cytoskeletal coherence (8), and vinculin recruitment and reinforcement via focal adhesion kinase (FAK)-mediated paxillin phosphorylation (9). Actomyosin stress fibers, which are linked to the extracellular matrix (ECM) via focal adhesions, pull not only against the ECM as the cell changes shape or moves but must compress the internal structure of the cell as well. Although it is known that local changes in applied force can directly induce biochemical signaling over short timescales (10,11), the response of cells to changes in extracellular stiffness is not well understood.
The cell is often represented in a state of tensional equilibrium in which contraction of stress fibers is balanced by resistance of the extracellular matrix to deformation (12–14). In this view, the cell is poised to rapidly respond to external changes in force, which in turn change the tension across mechanosensory proteins such as talin or p130cas, exposing phosphorylation sites or binding sites and initializing a cascade of signaling events (7,10,15). Recent studies of the cellular response to a step change in force show that signaling events such as Src activation and calcium spikes can occur on subsecond timescales (16,17).
It remains unclear, however, whether changes in extracellular stiffness will immediately result in altered biochemical signaling or in movement that depend on biochemical signaling. Microenvironmental stiffness can be altered on longer timescales through ECM degradation by matrix metalloproteinases or ECM cross-linking by lysyl oxidase. Tissue stiffness can even change by an order of magnitude on the seconds timescale during muscle contraction (18). Fundamentally, changes in force boundary conditions and changes in stiffness boundary conditions should have different effects on mechanosensitive proteins. External force changes can directly stretch proteins and open binding sites, whereas external stiffness changes—which can be thought of as altering the force required for a given displacement—result in opening of binding sites only when stretched by internally generated forces that act through the cell's cytoskeleton. This suggests that response timescales and mechanisms involved in force and stiffness sensing may be different.
Testing the adaptation of cells to rapid changes in stiffness requires a method that can alter only stiffness felt by the cell, independent of changes in cell height or tension. Several recent studies have presented platforms to vary the stiffness cues exposed to a single cell. Novel gels have been produced to enable changes in stiffness over the course of minutes to hours by photo exposure (19), DNA cross-linking (20), polymer cross-linking dynamics (21), or pH changes (22). To create more rapid changes in stiffness (<1 s) that do not simultaneously alter cell force or displacement, feedback algorithms have been employed on microplate or atomic force microscope (AFM) systems to reversibly control stiffness signals exposed to a single cell extended between two substrates in real time (23,24). We refer to this technique as an AFM stiffness clamp, as previously described (24). Employing a stiffness clamp in this geometry moves beyond traditional two-dimensional flexible substrate studies, in that the cell experiences a resistance to vertical contraction in addition to substrate rigidity, though this is by no means equivalent to a completely three-dimensional configuration.
Here, we use an AFM stiffness clamp to directly address the question of how single cells sense changes in extracellular stiffness. Previous work has demonstrated that contraction of single cells is stiffness dependent (23–26), but it remains unclear what role force-dependent signaling mechanisms play in the short timescale response to stiffness changes. Indeed, recent models suggest differing roles for players such as focal adhesions and actomyosin contraction (12,27,28), and our work provides experimental data that can be used to evaluate the model predictions.
In this study, we impose a step change in stiffness on a contractile cell and observe an immediate (within the subsecond resolution of our system) change in both contraction velocity (μm/min) and force rate (nN/min), as previously reported (24). High-resolution measurements of the contractile response with AFM reveal a new and repeatable equilibration response in contraction on a timescale of seconds as the cell adapts to a new extracellular stiffness condition. Surprisingly, we found that this seconds-timescale response to changes in stiffness is not affected by disruption of focal adhesion signaling or stretch-activated channels. Rather, it is well described by a simple viscoelastic mechanical model that includes only cytoskeletal relaxation under a constant velocity contractile actuator. We confirm that the observed response is dependent only on mechanical properties in the absence of biochemical signaling by showing a similar response in expanding hydrogels. We therefore propose that the initial response of contractile cells to stiffness changes is mechanical equilibration of the cytoskeleton to the new boundary conditions, a process that is independent of focal adhesion signaling.
Materials and Methods
Cell culture and sample preparation
NIH 3T3 fibroblasts were cultured in Dulbecco's modified Eagle's medium (Mediatech, Manassas, VA) supplemented with 10% fetal bovine serum (Lonza, Walkersville, MD), and 1% Penicillin/Streptomycin (Sigma, St Louis, MO). Before experiments, cells were trypsinized and resuspended in CO2-independent media (Invitrogen, Carlsbad, CA) supplemented with 10% fetal bovine serum, and 1% Penicillin/Streptomycin. For inhibition experiments, cells were resuspended in CO2-independent media containing the appropriate drug concentration and incubated for 30 min before experiments. Drugs used include pp2 (Calbiochem, Gibbstown, NJ), FAK inhibitor (Tocris, Ellisville, MO), gadolinium chloride (Sigma), cytochalasin D (Sigma), nocodazole (Sigma), and blebbistatin (Sigma). Control experiments conducted in the presence of 0.33% dimethylsulfoxide, the maximum percentage required for any drug experiments, showed no distinct behavior from CO2-independent media without dimethylsulfoxide or drug additions.
Experimental setup
Experiments were conducted with a modified Bioscope AFM (Veeco Metrology, Santa Barbara, CA) with a closed-loop piezoelectric platform stage (Mad City Labs, Madison, WI), and temperature control (Warner Instrument, Hamden, CT) atop an inverted microscope (Zeiss Axiovert 25, Carl Zeiss, Thornwood, NY) allowing brightfield imaging and alignment of the cantilever and cell (see Fig. 1 b). Data acquisition and the stiffness clamp feedback algorithm are controlled by custom software (LabVIEW, National Instruments, Austin, TX). For further details on the feedback algorithm please see (24). Tipless PNP cantilevers from Nanoworld (NeuChatel, Switzerland) were used in all experiments with spring constants ranging from 50 to 800 nN/μm as determined by fitting thermal fluctuations of each cantilever in air.
Figure 1.
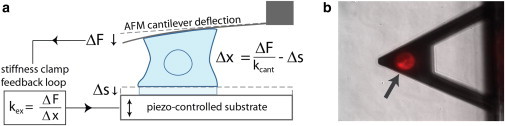
AFM-based control of stiffness during single-cell contraction. (a) Setup of single-cell contraction experiments. Cell-generated forces and cell height are measured by deflection of the AFM cantilever (of stiffness kcant), whereas extracellular stiffness, kex, is controlled in real time using the stiffness clamp feedback algorithm (24). (b) Top-down view of cell adhered to AFM cantilever and substrate. The cell membrane is fluorescently labeled for visual clarity (arrow).
Stiffness cycling experiment
Before adding cells, the AFM cantilever and glass substrate were incubated with 50 μg/ml fibronectin (Sigma) in phosphate buffered saline for at least 30 min and then rinsed. Concanavalin A (Sigma) and poly-L-Lysine (MW > 300,000, Sigma) were also used as alternatives to fibronectin for experiments where indicated. All experiments were performed at 37°C with perfusion of media exchanging the chamber volume every hour to compensate for evaporation. The point of contact between the glass substrate and AFM cantilever was recorded as zero height and cell height was measured with respect to this point. Prepared cells in suspension were flowed into the system and within minutes of settling, a single cell was brought into contact with both the AFM cantilever and glass substrate with a 4 nN contact force. The cell was then allowed to adhere and contract a minimum of several nN before stiffness cycling began. Step changes in stiffness were imposed every 20 s. Multiple time intervals were tested to confirm that a steady-state contraction velocity and tensile rate are reached within 20 s.
Measurement of response by ratio analysis
The nonlinearity of the contractile response to step changes in stiffness was established by measuring the slope of the traction force and cell height over the first quarter of the interval and the last quarter of the interval. A ratio of these slopes >1 indicates acceleration, whereas a ratio <1 indicates deceleration. The p-value was determined using a binomial test with a null hypothesis of equal probability of acceleration or deceleration.
Measurement of response timescale by curve fitting
The response timescale was determined by fitting a linear-plus-exponential equation to each stiffness interval:
| (1) |
where c0 is a constant offset, c1 is the slope after equilibration, c2 is the multiplier of the exponential term, and τ is the response timescale. For the accelerating intervals, c1 and c2 have opposite signs. This results in an extremum where the exponential contribution exactly cancels out the linear contribution. When the fitting step decreases in stiffness, this extremum point was constrained to be within 2 s of the beginning of the stiffness interval. For increases in stiffness, c1 and c2 have the same sign and t = 0 is defined as the start of the interval. To compare response timescales, an F-test comparing the nested linear model to the linear-plus-exponential was used with only traces with p < 0.1 used. This was done to exclude data whose noise precluded an accurate measurement of the response timescale.
Given the shorter response timescales for high stiffnesses, the F-value criterion yields fewer usable values at high stiffnesses for inhibition experiments where data are noisier. Therefore, comparison of response timescales between inhibition experiments is based on low stiffnesses and analysis of the height trace.
The steady-state contraction velocity is measured as the slope during the last 5 s of the interval where the velocity is constant (equivalent to c1 from Eq. 1).
Statistical analysis
The significance of drug treatment response timescales was investigated using a nonparametric rank sum test (Mann-Whitney U test) comparing each condition to the control. The underlying data are not normally distributed, and thus a nonparametric test was used. Levels of significance are reported for given conditions in the text. Box plot percentile values are calculated based on discrete stiffness intervals (n = number of intervals) across multiple cells (N = number of cells). Each stiffness interval was considered as independent because no greater correlation existed within a cell than between cells.
Osmotic swelling of polyacrylamide hydrogel
A polyacrylamide hydrogel with an elasticity of ∼100 Pa was osmotically swelled by replacing the 10× phosphate buffered saline surrounding the gel with deionized water. As the gel swelled against the AFM cantilever, the stiffness clamp was applied, and the change in gel height and gel expansion force were measured in the same manner as for the contracting cells. Step changes in stiffness were imposed every 40 s to allow ample time for equilibration. Multiple time intervals were tested to confirm that a steady-state contraction velocity and force rate is reached within 40 s.
Results
Cells spreading between an AFM cantilever and surface exhibit uniform contraction velocity and force rates for a given extracellular stiffness
We determined the whole-cell contractile response to extracellular stiffness using an AFM-based stiffness clamp. Briefly, a single fibroblast is simultaneously brought into contact with a fibronectin-coated tipless AFM cantilever and a fibronectin-coated glass substrate. As the cell adheres to the two surfaces and contracts, we record the cell-generated forces and height changes with nanometer precision. Without feedback to control the cantilever deflection, cell contraction is resisted by a single extracellular stiffness in the vertical direction defined by the spring constant of the cantilever. Under these conditions, the contraction increases to a constant contraction velocity (μm/min) and force rate (nN/min) as the cell spreads onto both surfaces, consistent with previous studies (24,26). A sample trace of this linear region under constant stiffness is shown in Fig. S1 in the Supporting Material with a subset shown in Fig. 2 a.
Figure 2.
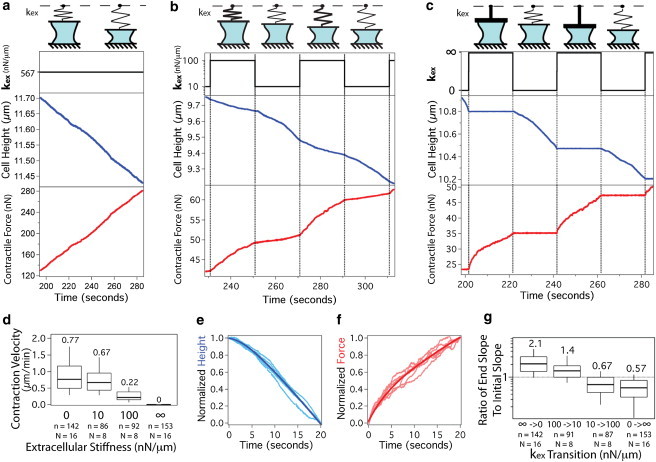
Contracting cells adapt to a step change in extracellular stiffness on a timescale of seconds. (a) Typical trace of cell height and contractile force of a single cell contracting under a constant extracellular stiffness as illustrated by the top row cartoons. Once contact with both surfaces is established, the cell contracts at a constant rate for several minutes before slowing. (full trace shown in Fig. S1.) (b) Step changes in extracellular stiffness between 10 and 100 nN/μm every 20 s yield changes in both contraction velocity and force rate (the rate at which force changes in time). (c) Extreme step changes in stiffness between kex = 0 and kex = ∞ clearly reveal a response period following the step change. (d) Steady-state contraction velocity depends directly on extracellular stiffness. (e) The response timescale is consistent across the entire contractile period of the cell as shown by the normalization and overlay of all kex = 0 intervals from a single trace. The dark line is the average over all the intervals. (f) Normalization and overlay of all kex = ∞ intervals from a single trace. (g) The ratio of the slope over the last quarter of the interval to the slope over the first quarter of the interval is calculated for each 20-s stiffness interval for the height traces. n represents number of stiffness transitions, N represents number of cells, and box plot presents median, 25th and 75th percentile and 10 and 90th percentile outliers. The median value is indicated above each box for clarity.
Contracting cells adapt to step changes in extracellular stiffness on a timescale of seconds
To dynamically change the extracellular stiffness felt by the contracting cell, we employ a feedback algorithm for the AFM-based stiffness clamp, as previously described (24). Briefly, the stiffness clamp allows a rapid and reversible tuning of extracellular stiffness, independent of cell-generated force or contraction, by adjustment of the substrate position. For example, in the extreme case of infinite stiffness: , no change in height is achieved regardless of the force applied by the cell. To achieve this, every incremental deflection of the cantilever is accompanied by an identical step of the substrate such that cell height remains constant. This feedback technique is referred to as a position clamp. By a similar argument, a force clamp yields an extracellular stiffness of 0. Any intermediate stiffness is obtained by appropriate adjustment of the substrate position based on cell-generated cantilever deflection.
We expose single contracting cells to a series of step changes in extracellular stiffness every 20 s during the linear region of contraction. Fig. 2 b shows a typical cellular response to a series of step changes between 10 and 100 nN/μm, which are equivalent to cells contracting against an extracellular matrix with an elasticity of ∼1 and 10 kPa, respectively, which is within the range of sensitivity previously reported for fibroblasts (2,4,29) (see the Supporting Material for conversion calculation). Contraction velocity (and force rate) is stiffness dependent, as shown in Fig. 2 d, where a step change in stiffness results in a rapid change in both force rate and contraction velocity, as described previously (23,24). However, examination of the high-resolution traces enabled by the AFM reveals a response period on a timescale of seconds immediately following a change in stiffness that has not been previously identified. Specifically, the cell accelerates to a constant rate upon a step decrease in stiffness and decelerates to a constant rate upon a step increase in stiffness. This response is even more pronounced when cycling between the extremes of kex = 0 (force clamp) and kex = ∞ (position clamp) every 20 s, as shown in Fig. 2 c.
To quantify this response, we take the ratio of the slope during the last quarter of the stiffness interval to the slope during the first quarter of the stiffness interval. For an increase in stiffness (from 10 to 100 nN/μm or 0 to ∞) the ratio is <1 indicating a deceleration. For a decrease in stiffness, the ratio is >1 indicating an acceleration. These ratios, illustrated in Fig. 2 g, are consistently distinct from 1 with p < 0.001. The identical trend is observed in the force trace as in the height trace (see Fig. S2), indicating proper functioning of the stiffness clamp.
Notably, this response is consistent across the entire contractile regime of the cell. As demonstrated by normalizing and overlaying each stiffness interval for the entire contractile period (Fig. 2, e and f), the shape of the response is preserved despite an increasing contractile force and decreasing cell height over the course of contraction. Indeed, the observed adaptation behavior is independent of force, cell height, force rate, and contraction velocity (see Fig. S3). On the basis of the previously described cellular responses to changes in force (16,17), we expected focal adhesion signaling to be involved in the consistently observed seconds-timescale response to changes in stiffness.
Focal adhesion signaling does not affect the seconds-timescale response to a step change in extracellular stiffness
Multiple studies have directly linked cellular stiffness sensing with focal adhesion activity. Specifically, the kinase activity of FAK is regulated by mechanical stretching and likely plays a role in stiffness-sensitive adhesion turnover (7). Src family kinases (SFKs) are proposed to play an early role in the rigidity sensing cycle and are activated within 300 ms of mechanical perturbation via fibronectin linkages (7,16). We therefore expected FAK and SFKs to be involved in the seconds-timescale contractile response to a step change in extracellular stiffness.
Focal adhesion activity was inhibited using a FAK inhibitor or pp2, a SFK inhibitor, and contraction experiments with step changes in extracellular stiffness between kex = 0 and kex = ∞ were performed as previously described. In the presence of the 30 μM FAK inhibitor, the contraction velocity was significantly slower (p < 0.0001) than the control; whereas 25 μM pp2 did not statistically significantly alter contraction velocity compared to the control (Fig. 3 a). To quantify the response timescale under these drug conditions, we fit a linear-plus exponential curve (Eq. 1) to each interval of kex = 0 (Fig. 3 b). The resulting response timescale in the presence of the 30 μM FAK inhibitor and 25 μM pp2 was not statistically significantly different from the control response timescale, as shown in Fig. 3 d. These results indicate that although focal adhesion signaling is known to be involved in long timescale stiffness-dependent behaviors, the seconds-timescale response to a step change in extracellular stiffness is independent of focal adhesion activity.
Figure 3.
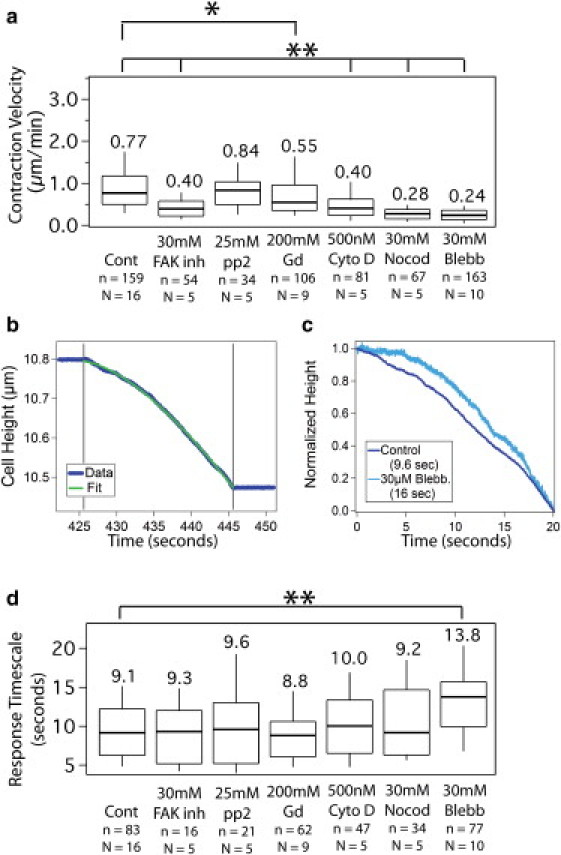
Inhibition experiments reveal a consistent response timescale dependent on cell mechanics rather than adhesion signaling. (a) Steady-state contraction velocity for the control, FAK inhibitor, SFK inhibitor pp2, gadolinium chloride, cytochalasin D, nocodazole, and blebbistatin. All conditions are statistically significantly slower than the control except pp2. (b) Linear plus exponential fit to typical height trace. (c) Demonstration of distinct adaptation timescales. Normalized traces from kex = 0 under control and 30 μM blebbistatin conditions are overlaid for comparison. See Fig. S4 for multiple cycles of stiffness changes in the presence of blebbistatin. (d) Response timescale from kex = 0 intervals remains unchanged under all conditions except 30 μM blebbistatin. For all box plots, n represents number of transitions or intervals and N represents number of cells. Median values are shown below each box plot while the plot presents median, 25th and 75th percentile and 10 and 90th percentile outliers. ∗p < 0.01; ∗∗p < 0.0001.
At high concentrations of either drug (50 μM), cells are able to adhere, as indicated by significant forces of de-adhesion required to detach the cell from either surface, but were unable to contract. The ability to adhere without contraction is consistent with the reported ability to form nascent adhesions in the absence of myosin II (30). Similarly, attachment by either poly-L-lysine or concanavalin A yields no contraction (data not shown), illustrating the need for integrin-mediated adhesion to generate contractile force in this system.
Partial inhibition of myosin lengthens the seconds-timescale response to a step change in extracellular stiffness
We next tested if disrupting the cytoskeleton of the cell using cytochalasin D, nocodazole, or blebbistatin would affect the response timescale. Intermediate concentrations of all three drugs decreased the steady-state contraction velocity, as shown in Fig. 3 a (500 nM cytochalasin D, 30 μM nocodazole, and 30 μM blebbistatin). Interestingly, the response timescale was not significantly affected by disruption of the actin cytoskeleton with cytochalasin D or microtubules with nocodazole at concentrations that decreased the steady-state contraction velocity, as shown in Fig. 3 d. Only partial disruption of myosin ATPase activity with 30 μM blebbistatin showed a significant change in response timescale compared to control (p < 0.0001). As expected, lower concentrations of all three drugs showed no significant difference in either steady-state contraction velocity or response timescale. Higher concentrations of the drugs completely disrupted contraction (1 μM cytochalasin D and 50 μM blebbistatin, data not shown), thereby indicating the requirement of an intact cytoskeleton and active myosin for the buildup of traction forces.
Stretch-activated ion channels are not involved in the seconds-timescale response to a step change in extracellular stiffness
Stretch-activated ion channels are another proposed sensor of extracellular mechanics, and calcium signaling is expected to operate within the seconds timescale observed here (31–33). We therefore explored whether the response timescale was dependent on the activity of stretch-sensitive ion channels. Gadolinium chloride has been used previously to inhibit stretch-activated ion channels resulting in decreased traction forces and migration (32). In our experiments, blocking of stretch-activated ion channels with a high dose of gadolinium chloride slightly decreased the steady-state contraction velocity during the force clamp (p = 0.0025 compared to control), but it did not affect the response timescale compared to the control, as shown in Fig. 3. This result indicates that stretch-activated ion channels do not play a significant role in the seconds-timescale stiffness response observed here.
A simple mechanical model predicts the seconds-timescale response to a step change in extracellular stiffness
The repeatability of the seconds-timescale response at different contractile forces over the course of contraction of a single cell and from cell to cell, combined with the robustness of the response timescale against inhibition of focal adhesion signaling and stretch-activated ion channel activity, suggests that the response might be mechanical in nature rather than a biochemically controlled event. We therefore sought a simple mechanical model to describe the observed behavior. Because cell contraction changes immediately with a change in stiffness, independent of the tensile force, we hypothesized that the passive viscoelasticity of the whole cell was influencing the coupling of the extracellular stiffness to an underlying contractile process that is independent of force and stiffness.
A simple mechanical model that has a transient response to both step increases and decreases in stiffness is the standard linear solid viscoelastic model, which is a spring in parallel with a spring and dashpot in series, as shown in Fig. 4 a. We found that a constant velocity actuator representing a simple spring with a reference length changing at a fixed rate captures the measured response of the cell to step changes in stiffness, suggesting that active biochemical changes in the contractile response, such as force-dependent changes in myosin contraction velocities, are dwarfed by passive whole-cell viscoelasticity on the seconds-timescale. The viscoelastic network couples the internal contraction of the actuator to the extracellular stiffness resisting contraction. The actuator is independent of the current state of the transducer and also independent of the instantaneously applied extracellular stiffness.
Figure 4.
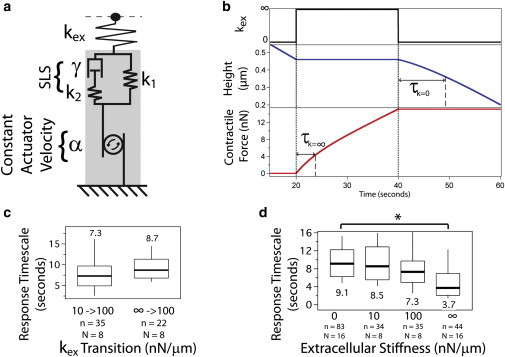
Simple mechanical model describes contractile response upon a step change in stiffness. (a) Cartoon illustrating an independent actuator moving at a constant velocity α in series with the standard linear solid element consisting of a spring k1 in parallel with a dashpot γ and spring k2 in series. As extracellular stiffness conditions change, different elements of the standard linear solid absorb the sudden change in stiffness as illustrated in Fig. S5. (b) Predictions of the model successfully simulate the observed response timescale for a step increase and step decrease in stiffness, for both the height and force behavior. Response timescale, τ, is indicated for both the kex = 0 and kex = ∞ cases. (c) Experimental validation of the model prediction that response timescale is independent of the previous stiffness. (d) Experimental validation of the model prediction that response timescale is longer for lower stiffness and shorter for higher stiffness. The differences between the groups were confirmed with a Kruskal-Wallis one-way analysis of variance across all four groups. ∗p < 0.0001.
As shown in Fig. 4 b, the model predicts the observed deceleration upon a step increase in stiffness and acceleration upon a step decrease in stiffness. Derivation of the response of the model to step changes in stiffness is described in the Supporting Material. The model predicts the response timescale for any step change to extracellular stiffness kex:
| (2) |
where γ is the damping parameter, and k1 and k2 are the stiffness values of the two internal springs as labeled in Fig. 4 a. The extreme cases of the force clamp (kex = 0) and position clamp (kex = ∞) follow:
| (3) |
| (4) |
The model makes two important predictions. First, the model predicts a lack of hysteresis. In other words, the response timescale is only dependent on the current kex and not on the previous extracellular stiffness, assuming consecutive stiffness intervals that are greater than the response timescale. Second, the model predicts a shorter response timescale at higher stiffness and longer response timescale at lower stiffness, as indicated in Fig. 4 b. We tested and confirmed both of these predictions experimentally. As shown in Fig. 4 c, the response timescale at 100 nN/μm is the same regardless of whether the previous stiffness was 10 nN/μm or ∞, confirming the prediction of no hysteresis. Next, we measured the response timescale for a range of extracellular stiffness values and observed statistically significantly different values at kex = 0 vs. kex = ∞ as shown in Fig. 4 d, again confirming the model prediction.
Swelling hydrogels exhibit a similar seconds-timescale response to a step change in external stiffness
Our simple mechanical model suggests that the observed response to step changes in extracellular stiffness should occur for any system with an independent actuator and standard linear solid viscoelastic material properties. We tested whether this was true using a polyacrylamide hydrogel, which exhibits seconds-timescale viscoelastic behavior (34) and can be driven to expand by changes in osmotic pressure. The hydrogel was subjected to a change in osmotic pressure and exposed to the same stiffness cycling between kex = 0 and kex = ∞, but for 40 s intervals to accommodate longer response times. As shown in Fig. 5, we indeed observe the same acceleration upon a step decrease in stiffness and deceleration upon a step increase in stiffness with response timescales longer than those observed for cells, but still dependent on the current external stiffness. This supports that the mechanical equilibration of the viscoelastic properties of the cell is sufficient to describe the observed short-timescale adaptation to a step change in extracellular stiffness.
Figure 5.
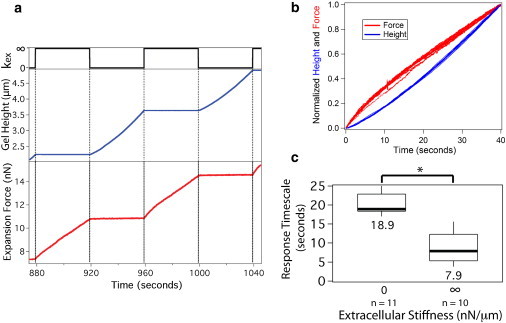
Swelling hydrogel exhibits a seconds-timescale response to a step change in extracellular stiffness. (a) Step changes in stiffness between kex = 0 and kex = ∞ applied to an expanding hydrogel every 40 s yield changes in both expansion velocity and force rate. (b) Force and height traces for each stiffness interval are normalized and overlaid, revealing a deceleration for a step increase in stiffness (force trace) and an acceleration for a step decrease in stiffness (height trace). Force and height traces are displayed on the same plot to emphasize curvature. (c) Gel response timescale for extreme extracellular stiffness values. ∗p < 0.001. n represents number of stiffness transitions and box plot presents median, 25th and 75th percentile and 10 and 90th percentile outliers.
Discussion
Our measurements of cellular contraction upon a step change in extracellular stiffness reveal a seconds-timescale response that shows the importance of cytoskeletal mechanics for models of stiffness sensing. Using an AFM stiffness clamp to control the extracellular stiffness exposed to contractile fibroblasts, we consistently observe acceleration to a constant contraction velocity and force rate upon a step decrease in stiffness and deceleration upon a step increase in stiffness. Experiments with drugs that disrupt adhesion signaling and the cytoskeleton suggest that the response timescale depends only on the extracellular stiffness and intracellular mechanical properties. In our experiments the adaptation of cells to changes in stiffness is well described by a simple mechanical model of an internal cellular actuator pulling at a constant velocity against both the extracellular stiffness and intracellular mechanics (Fig. 4). Indeed, when we expose an actively swelling gel to the same conditions as the cell, we observe comparable behavior (Fig. 5), reinforcing the idea that the stiffness adaptation results from the viscoelastic properties of the cell.
The simple mechanical model can be used to extract viscoelastic and contractile properties from the experimental data. The actuator velocity, α, is simply the steady-state contractile velocity at kex = 0, as described in the Supporting Material. We find a median actuator velocity of α = 13 nm/s (25th, 75th percentile: 8.3, 20 nm/s), which is consistent with reported velocities of retrograde actin flow in the presence of focal adhesions of 10–20 nm/s (35). As expected, disruption of either the actin network with cytochalasin D or myosin ATPase activity with blebbistatin decreases α as shown in Fig. 3 a. Furthermore, by fitting the model predictions to the control data, we found the viscoelastic components of the actomyosin network to be k1 = 36, k2 = 53 nN/μm, and γ = 140 nN∗s/μm (corresponding to approximately E1 = 3.6, E2 = 5.3 kPa, and γ = 14 kPa∗s, see the Supporting Material for calculation of model parameters and elasticity conversion). These values are consistent with previously published values of E = 0.5–20 kPa (29,36) and γ = 1–100 kPa∗s (36,37). Interestingly, a study by Humphrey et al. (38) showed that actomyosin networks of a similar ratio of actin to myosin as in vivo environments relieve macroscopic stress over an average relaxation time of ∼8 s—remarkably similar to the response timescale observed here. Consistent with this, we expect that the physiological basis of the viscoelastic component of our model is dominated by the actomyosin network, which may include contributions from the cortex and stress fibers.
Close examination of the viscoelastic parameters in Table S1 reveals a robustness of the response timescale such that changes in elastic (k1, k2) and viscous (γ) components have opposing effects on the response timescale. For example, both 500 nM cytochalasin D and 30 μM blebbistatin cause a significant decrease in all viscoelastic parameters compared to control. As seen in Eq. 2, the elastic and viscous components have opposing effects on the response timescale. Therefore, in the case of cytochalasin D, the decrease in the viscous component counteracts the decrease in the elastic components resulting in a response timescale consistent with the control. However, the decrease in the viscous component is smaller for blebbistatin, resulting in a response timescale distinct from the control. These competing effects point to the complexity of the role of intracellular mechanics such that changes in distinct mechanical components may not translate to the whole-cell scale.
The model we propose does not require incorporation of force-dependent motor activity to explain the response timescale. This is distinct from previous models that combine the force-velocity relationship with binding and unbinding kinetics of adhesions to predict stiffness-dependent motility and stress fiber development (12,39). It has also been proposed that actomyosin contraction itself may be stiffness-dependent either due to catch bond behavior (7,40) or load-dependent resistance from internal friction due to cross-linkers (26). Although the inverse force-velocity relationship has been well characterized for skeletal myosin and on the whole-cell scale for muscle cells where load is directly and efficiently applied to myosin networks (26,41,42), the effect of force on less organized actomyosin networks in nonmuscle cells remains unclear. Recent studies of nonmuscle myosins IIa and IIb suggest that load-dependent kinetics are complex (43,44) and are likely further complicated by dynamic reorganization of actin in nonmuscle cells. Only a constant velocity actuator is required in our simple mechanical model, potentially due to activity in a regime of minimal force sensitivity or the reorganization of actin structures that results in approximately constant myosin activity. A simple mechanical model has been proposed recently by Marcq et al., where “adaptation to substrate rigidity results from an interplay between passive elasticity and active contractility” (28). That recent model, however, incorporates a different specific force-velocity relationship and does not address the short timescale equilibration that we report here.
This study finds that viscoelastic equilibration of the cytoskeleton is central to stiffness-dependent contraction over short timescales. We observe a seconds-timescale response to a step change in extracellular stiffness, independent of focal adhesion signaling and dependent only on actomyosin mechanics. In the simple mechanical model we propose, extracellular stiffness is coupled through the viscoelastic cytoskeleton such that stretching of mechanosensory proteins and subsequent intracellular signaling result from a combination of extracellular stiffness and cytoskeletal mechanics that equilibrate after several seconds. Examination of longer timescale responses to stiffness changes will be required to characterize signal transduction from cytoskeletal relaxation and focal adhesion signaling to changes in gene expression.
Acknowledgments
The authors thank Dr. Ross Rounsevell, Dr. Lina Nilsson, Dr. Ben Ricca, Gautham Venugopalan, and other members of the Fletcher Lab for helpful discussions, and Luke Cassereau for donation of polyacrylamide material.
Supporting Material
References
- 1.Peyton S.R., Putnam A.J. Extracellular matrix rigidity governs smooth muscle cell motility in a biphasic fashion. J. Cell. Physiol. 2005;204:198–209. doi: 10.1002/jcp.20274. [DOI] [PubMed] [Google Scholar]
- 2.Lo C.M., Wang H.B., Wang Y.L. Cell movement is guided by the rigidity of the substrate. Biophys. J. 2000;79:144–152. doi: 10.1016/S0006-3495(00)76279-5. [DOI] [PMC free article] [PubMed] [Google Scholar]
- 3.Engler A.J., Sen S., Discher D.E. Matrix elasticity directs stem cell lineage specification. Cell. 2006;126:677–689. doi: 10.1016/j.cell.2006.06.044. [DOI] [PubMed] [Google Scholar]
- 4.Wang H.B., Dembo M., Wang Y.L. Substrate flexibility regulates growth and apoptosis of normal but not transformed cells. Am. J. Physiol. Cell Physiol. 2000;279:C1345–C1350. doi: 10.1152/ajpcell.2000.279.5.C1345. [DOI] [PubMed] [Google Scholar]
- 5.Munevar S., Wang Y., Dembo M. Traction force microscopy of migrating normal and H-ras transformed 3T3 fibroblasts. Biophys. J. 2001;80:1744–1757. doi: 10.1016/s0006-3495(01)76145-0. [DOI] [PMC free article] [PubMed] [Google Scholar]
- 6.Geiger B., Spatz J.P., Bershadsky A.D. Environmental sensing through focal adhesions. Nat. Rev. Mol. Cell Biol. 2009;10:21–33. doi: 10.1038/nrm2593. [DOI] [PubMed] [Google Scholar]
- 7.Moore S.W., Roca-Cusachs P., Sheetz M.P. Stretchy proteins on stretchy substrates: the important elements of integrin-mediated rigidity sensing. Dev. Cell. 2010;19:194–206. doi: 10.1016/j.devcel.2010.07.018. [DOI] [PMC free article] [PubMed] [Google Scholar]
- 8.Cai Y., Rossier O., Sheetz M.P. Cytoskeletal coherence requires myosin-IIA contractility. J. Cell Sci. 2010;123:413–423. doi: 10.1242/jcs.058297. [DOI] [PMC free article] [PubMed] [Google Scholar]
- 9.Pasapera A.M., Schneider I.C., Waterman C.M. Myosin II activity regulates vinculin recruitment to focal adhesions through FAK-mediated paxillin phosphorylation. J. Cell Biol. 2010;188:877–890. doi: 10.1083/jcb.200906012. [DOI] [PMC free article] [PubMed] [Google Scholar]
- 10.Sawada Y., Tamada M., Sheetz M.P. Force sensing by mechanical extension of the Src family kinase substrate p130Cas. Cell. 2006;127:1015–1026. doi: 10.1016/j.cell.2006.09.044. [DOI] [PMC free article] [PubMed] [Google Scholar]
- 11.Wang Y., Botvinick E.L., Chien S. Visualizing the mechanical activation of Src. Nature. 2005;434:1040–1045. doi: 10.1038/nature03469. [DOI] [PubMed] [Google Scholar]
- 12.Schwarz U.S., Erdmann T., Bischofs I.B. Focal adhesions as mechanosensors: the two-spring model. Biosystems. 2006;83:225–232. doi: 10.1016/j.biosystems.2005.05.019. [DOI] [PubMed] [Google Scholar]
- 13.Chen C.S. Mechanotransduction - a field pulling together? J. Cell Sci. 2008;121:3285–3292. doi: 10.1242/jcs.023507. [DOI] [PubMed] [Google Scholar]
- 14.Paszek M.J., Zahir N., Weaver V.M. Tensional homeostasis and the malignant phenotype. Cancer Cell. 2005;8:241–254. doi: 10.1016/j.ccr.2005.08.010. [DOI] [PubMed] [Google Scholar]
- 15.del Rio A., Perez-Jimenez R., Sheetz M.P. Stretching single talin rod molecules activates vinculin binding. Science. 2009;323:638–641. doi: 10.1126/science.1162912. [DOI] [PMC free article] [PubMed] [Google Scholar]
- 16.Na S., Collin O., Wang N. Rapid signal transduction in living cells is a unique feature of mechanotransduction. Proc. Natl. Acad. Sci. USA. 2008;105:6626–6631. doi: 10.1073/pnas.0711704105. [DOI] [PMC free article] [PubMed] [Google Scholar]
- 17.Hayakawa K., Tatsumi H., Sokabe M. Actin stress fibers transmit and focus force to activate mechanosensitive channels. J. Cell Sci. 2008;121:496–503. doi: 10.1242/jcs.022053. [DOI] [PubMed] [Google Scholar]
- 18.Shinohara M., Sabra K., Tanter M. Real-time visualization of muscle stiffness distribution with ultrasound shear wave imaging during muscle contraction. Muscle Nerve. 2010;42:438–441. doi: 10.1002/mus.21723. [DOI] [PubMed] [Google Scholar]
- 19.Frey M.T., Wang Y.-L. A photo-modulatable material for probing cellular responses to substrate rigidity. Soft Matter. 2009;5:1918–1924. doi: 10.1039/b818104g. [DOI] [PMC free article] [PubMed] [Google Scholar]
- 20.Jiang F.X., Yurke B., Langrana N.A. The relationship between fibroblast growth and the dynamic stiffnesses of a DNA crosslinked hydrogel. Biomaterials. 2010;31:1199–1212. doi: 10.1016/j.biomaterials.2009.10.050. [DOI] [PubMed] [Google Scholar]
- 21.Young J.L., Engler A.J. Hydrogels with time-dependent material properties enhance cardiomyocyte differentiation in vitro. Biomaterials. 2011;32:1002–1009. doi: 10.1016/j.biomaterials.2010.10.020. [DOI] [PMC free article] [PubMed] [Google Scholar]
- 22.Yoshikawa H.Y., Rossetti F.F., Tanaka M. Quantitative evaluation of mechanosensing of cells on dynamically tunable hydrogels. J. Am. Chem. Soc. 2011;133:1367–1374. doi: 10.1021/ja1060615. [DOI] [PubMed] [Google Scholar]
- 23.Mitrossilis D., Fouchard J., Asnacios A. Real-time single-cell response to stiffness. Proc. Natl. Acad. Sci. USA. 2010;107:16518–16523. doi: 10.1073/pnas.1007940107. [DOI] [PMC free article] [PubMed] [Google Scholar]
- 24.Webster K.D., Crow A., Fletcher D.A. An AFM-based stiffness clamp for dynamic control of rigidity. PLoS ONE. 2011;6:e17807. doi: 10.1371/journal.pone.0017807. [DOI] [PMC free article] [PubMed] [Google Scholar]
- 25.Lam W.A., Chaudhuri O., Fletcher D.A. Mechanics and contraction dynamics of single platelets and implications for clot stiffening. Nat. Mater. 2011;10:61–66. doi: 10.1038/nmat2903. [DOI] [PMC free article] [PubMed] [Google Scholar]
- 26.Mitrossilis D., Fouchard J., Asnacios A. Single-cell response to stiffness exhibits muscle-like behavior. Proc. Natl. Acad. Sci. USA. 2009;106:18243–18248. doi: 10.1073/pnas.0903994106. [DOI] [PMC free article] [PubMed] [Google Scholar]
- 27.Fouchard J., Mitrossilis D., Asnacios A. Acto-myosin based response to stiffness and rigidity sensing. Cell Adh. Migr. 2011;5:16–19. doi: 10.4161/cam.5.1.13281. [DOI] [PMC free article] [PubMed] [Google Scholar]
- 28.Marcq P., Yoshinaga N., Prost J. Rigidity sensing explained by active matter theory. Biophys. J. 2011;101:L33–L35. doi: 10.1016/j.bpj.2011.08.023. [DOI] [PMC free article] [PubMed] [Google Scholar]
- 29.Solon J., Levental I., Janmey P.A. Fibroblast adaptation and stiffness matching to soft elastic substrates. Biophys. J. 2007;93:4453–4461. doi: 10.1529/biophysj.106.101386. [DOI] [PMC free article] [PubMed] [Google Scholar]
- 30.Choi C.K., Vicente-Manzanares M., Horwitz A.R. Actin and alpha-actinin orchestrate the assembly and maturation of nascent adhesions in a myosin II motor-independent manner. Nat. Cell Biol. 2008;10:1039–1050. doi: 10.1038/ncb1763. [DOI] [PMC free article] [PubMed] [Google Scholar]
- 31.Beningo K.A., Dembo M., Wang Y.-L. Responses of fibroblasts to anchorage of dorsal extracellular matrix receptors. Proc. Natl. Acad. Sci. USA. 2004;101:18024–18029. doi: 10.1073/pnas.0405747102. [DOI] [PMC free article] [PubMed] [Google Scholar]
- 32.Munevar S., Wang Y.-L., Dembo M. Regulation of mechanical interactions between fibroblasts and the substratum by stretch-activated Ca2+ entry. J. Cell Sci. 2004;117:85–92. doi: 10.1242/jcs.00795. [DOI] [PubMed] [Google Scholar]
- 33.Matthews B.D., Thodeti C.K., Ingber D.E. Ultra-rapid activation of TRPV4 ion channels by mechanical forces applied to cell surface beta1 integrins. Integr Biol (Camb) 2010;2:435–442. doi: 10.1039/c0ib00034e. [DOI] [PMC free article] [PubMed] [Google Scholar]
- 34.Constantinides G., Kalcioglu Z.I., Van Vliet K.J. Probing mechanical properties of fully hydrated gels and biological tissues. J. Biomech. 2008;41:3285–3289. doi: 10.1016/j.jbiomech.2008.08.015. [DOI] [PubMed] [Google Scholar]
- 35.Aratyn-Schaus Y., Oakes P.W., Gardel M.L. Dynamic and structural signatures of lamellar actomyosin force generation. Mol. Biol. Cell. 2011;22:1330–1339. doi: 10.1091/mbc.E10-11-0891. [DOI] [PMC free article] [PubMed] [Google Scholar]
- 36.Thoumine O., Ott A. Time scale dependent viscoelastic and contractile regimes in fibroblasts probed by microplate manipulation. J. Cell Sci. 1997;110:2109–2116. doi: 10.1242/jcs.110.17.2109. [DOI] [PubMed] [Google Scholar]
- 37.Bausch A.R., Ziemann F., Sackmann E. Local measurements of viscoelastic parameters of adherent cell surfaces by magnetic bead microrheometry. Biophys. J. 1998;75:2038–2049. doi: 10.1016/S0006-3495(98)77646-5. [DOI] [PMC free article] [PubMed] [Google Scholar]
- 38.Humphrey D., Duggan C., Käs J. Active fluidization of polymer networks through molecular motors. Nature. 2002;416:413–416. doi: 10.1038/416413a. [DOI] [PubMed] [Google Scholar]
- 39.Walcott S., Sun S.X. A mechanical model of actin stress fiber formation and substrate elasticity sensing in adherent cells. Proc. Natl. Acad. Sci. USA. 2010;107:7757–7762. doi: 10.1073/pnas.0912739107. [DOI] [PMC free article] [PubMed] [Google Scholar]
- 40.Guo B., Guilford W.H. Mechanics of actomyosin bonds in different nucleotide states are tuned to muscle contraction. Proc. Natl. Acad. Sci. USA. 2006;103:9844–9849. doi: 10.1073/pnas.0601255103. [DOI] [PMC free article] [PubMed] [Google Scholar]
- 41.Hill A. The heat of shortening and the dynamic constants of muscle. Proc. R. Soc. Lond. B Biol. Sci. 1938;126:136–195. doi: 10.1098/rspb.1949.0019. [DOI] [PubMed] [Google Scholar]
- 42.Piazzesi G., Reconditi M., Lombardi V. Skeletal muscle performance determined by modulation of number of myosin motors rather than motor force or stroke size. Cell. 2007;131:784–795. doi: 10.1016/j.cell.2007.09.045. [DOI] [PubMed] [Google Scholar]
- 43.Kovács M., Thirumurugan K., Sellers J.R. Load-dependent mechanism of nonmuscle myosin 2. Proc. Natl. Acad. Sci. USA. 2007;104:9994–9999. doi: 10.1073/pnas.0701181104. [DOI] [PMC free article] [PubMed] [Google Scholar]
- 44.Norstrom M.F., Smithback P.A., Rock R.S. Unconventional processive mechanics of non-muscle myosin IIB. J. Biol. Chem. 2010;285:26326–26334. doi: 10.1074/jbc.M110.123851. [DOI] [PMC free article] [PubMed] [Google Scholar]
Associated Data
This section collects any data citations, data availability statements, or supplementary materials included in this article.