

Abstract
We present a quantitative fluctuation-based assay to measure the degree of local chromatin compaction and investigate how chromatin density regulates the diffusive path adopted by an inert protein in dividing cells. The assay uses CHO-K1 cells coexpressing untagged enhanced green fluorescent protein (EGFP) and histone H2B tagged mCherry. We measure at the single-cell level the EGFP localization and molecular flow patterns characteristic of each stage of chromatin compaction from mitosis through interphase by means of pair-correlation analysis. We find that the naturally occurring changes in chromatin organization impart a regulation on the spatial distribution and temporal dynamics of EGFP within the nucleus. Combined with the analysis of Ca2+ intracellular homeostasis during cell division, EGFP flow regulation can be interpreted as the result of controlled changes in chromatin compaction. For the first time, to our knowledge, we were able to probe chromatin compaction on the micrometer scale, where the regulation of molecular diffusion may become relevant for many cellular processes.
Introduction
The cell nucleus is a functionally and spatially structured organelle that both stores and translates genetic information (1,2). The nuclear DNA is organized together with structural proteins into a dynamic higher-order chromatin structure that controls several metabolic processes (e.g., transcription, recombination, DNA repair, and replication) during the cell cycle and cellular differentiation (3,4). The manner in which this highly controlled regulation is achieved remains a matter of great debate. Given the absence of membranes separating intranuclear substructures, it has been postulated that other structural features of the nucleus (e.g., the chromatin itself) must impart divisions that control molecular flow and segregate different activities (5). In line with this hypothesis, we recently proved that inert enhanced green fluorescent protein (EGFP) molecules move along but not across chromatin density boundaries. In particular, we found two disconnected molecular flows of EGFP associated with high- and low-chromatin-density regions throughout the nucleus during interphase (6). We also showed that this channeled regulation disappears in dividing cells, where the flow of EGFP across the mitotic chromosome is delayed and no longer obstructed (7). These results suggest the existence of a not-yet-understood interplay between chromatin organization/compaction and the regulation of molecular diffusion within the nucleus. Although investigators have obtained a great deal of information about chromatin compaction, ranging from the scale of entire chromosomes (8–10) or subchromosomal regions (11,12) to nucleosomal arrays (13), how this process affects nuclear protein distribution, mobility, and chromatin accessibility throughout the cell cycle remains unclear. To elucidate this issue, Martin and Cardoso (14) recently showed that changes in chromatin condensation induced by hypertonic treatment are able to modulate the DNA accessibility of inert molecules in live cells. However, in that study, they artificially manipulated the chromatin organization and evaluated the accessibility of proteins by static fluorescence imaging. To overcome these limitations, we combine a pair-correlation function (pCF) approach (for a review, see Hinde and Cardarelli (15)) with real-time imaging of the cell cycle from mitosis through to interphase. This allows us to study and follow the EGFP localization and molecular flow patterns while changes in chromatin organization in live cells are naturally occurring.
We find that EGFP is initially excluded from the compact chromatin environment (chromosome) during early mitosis. It slowly accumulates there during late mitosis, and finally is excluded again at the onset of interphase. In parallel with these observed changes in EGFP localization, we find associated patterns of EGFP molecular flow across the chromatin as revealed by pCF analysis. In particular, we find delayed diffusion into and out of the chromatin, as revealed by a characteristic double-arc shape in the measured pCF during early to mid-mitosis. In late mitosis, the delayed diffusion into and out of this environment becomes highly asymmetric, with the double-arc feature showing a longer delay to access chromatin than to exit (a result that explains the observed accumulation of EGFP in chromatin during this stage of mitosis). Finally, upon cell division, the chromatin of the early interphase daughter nuclei becomes inaccessible and an absence of positive correlation in the measured pCF is observed for flow into and out of the chromatin. As a first attempt to link the observed behavior of the inert EGFP tracer to the complex regulation of intracellular homeostasis, we investigated the variations of intranuclear Ca2+ concentration during cell division. Using the phasor approach to fluorescence lifetime imaging microscopy (FLIM), we found that this cation plays an important role in regulating both interphase and mitotic chromatin compaction. Taken together, our results help elucidate the links among molecular diffusion, calcium homeostasis, chromatin organization/compaction, and the cell cycle.
Materials and Methods
Cell culture and treatments
CHO-K1 cells stably transfected with monomeric EGFP were grown in low-glucose Dulbecco's modified Eagle's medium supplemented with 10% of fetal bovine serum at 37°C and in 5% CO2. Freshly split cells were plated onto MatTek 35-mm glass-bottom dishes coated with 3 μg/mL fibronectin and then transiently transfected with a H2B-mCherry plasmid using Lipofectamine 2000 according to the manufacturer's protocol. The H2B-mCherry plasmid (20972) was purchased from Addgene (www.addgene.com, provided to Addgene by Robert Benezra). For the Ca2+ experiments, CHO-K1 cells were grown, plated, and transiently transfected with the H2B-mCherry plasmid as described above. The plated cells were stained with 5 μM of Calcium Green-1 AM (Invitrogen, Carlsbad, CA) for 20 min at room temperature and then examined by confocal microscopy. In all experiments presented here, the mitotic nuclei were selected by visual inspection of the H2B-mCherry marked chromatin. The morphological characteristics of each stage of mitosis are well defined in the literature (1). Thus, we looked for a nucleus with chromatin characteristic of metaphase (i.e., early mitosis) and followed this cell until division occurred, at which point we observed two daughter nuclei in early interphase.
Microscopy
We performed microscopy measurements on a Zeiss LSM710 Quasar laser scanning microscope (Zeiss, Oberkochen, Germany) using a 40× water immersion objective 1.2 N.A. EGFP was excited with the 488 nm emission line of an Argon laser. mCherry was excited with the 561 nm emission line of a diode pump solid-state laser. EGFP and mCherry were measured sequentially at emission ranges of 492–560 nm and 580–696 nm, respectively. The potential cross talk, bleed-through, and fluorescence resonance energy transfer (FRET) effects between the two fluorophores were tested and found to be nonexistent in the acquisition settings used. For each channel, the pinhole was set to 1 Airy unit. A detailed description of the experimental settings used for the line-scan measurement can be found elsewhere (6). Briefly, we acquired data by rapidly scanning a diffraction-limited laser beam (488 nm) along a line drawn inside the nucleus across a discontinuity in chromatin density. Measuring a line of 32 pixels at maximum zoom, we sampled fluorescence every 100 nm, resulting in a line length of 3.2 μm. The maximum scanning speed for these settings was selected (pixel dwell time 6.3 μs, line time 0.472 ms) so that the EGFP molecules could be correlated in time between lines. In general, for each experiment, 2 × 10⁵ consecutive lines (with no intervals between lines) were acquired. Time regions within each experiment (typically ∼6.4 × 10⁴ lines, corresponding to ∼30 s) with no average change in fluorescence intensity (e.g., photobleaching) were then selected for the correlation analysis.
For the Ca2+ experiments, we also acquired FLIM data with the Zeiss LSM710 Quasar laser scanning microscope coupled to a two-photon Ti:Sapphire laser (Spectra-Physics Mai Tai, Newport Beach, CA) producing 120 fs pulses at a repetition of 80 MHz, and an ISS A320 FastFLIM box. Calcium Green-1 AM was excited at 840 nm with the two-photon laser, and this wavelength caused negligible excitation of the H2B-mCherry. A SP 610 nm dichroic filter was used to separate the fluorescence signal from the laser light in the LSM710. For image acquisition, the frame size was set to 256 × 256 pixels and the pixel dwell time was set to 25.61 μs/pixel. The average laser power at the sample was maintained at the milliwatt level. We calibrated the system and performed phasor plot analysis by measuring fluorescein (pH 9.0), which has a known single exponential lifetime of 4.04 ns.
Data analysis
We calculated the autocorrelation function (ACF) and pCF using the SimFCS software developed at the Laboratory for Fluorescence Dynamics (www.lfd.uci.edu), as described previously (6,7,16,17). The intensity data are presented in a carpet representation in which the x-coordinate corresponds to the point along the line (pixels) and the y-coordinate corresponds to the time of acquisition. The ACF and pCF (pixels) are displayed in pseudo colors in an image in which the x-coordinate corresponds to the point along the line and the y-coordinate corresponds to the correlation time in a log scale. The distances at which the pCF analysis was carried out were not fixed across all experiments, but instead were determined on an individual basis according to the chromatin density variation along each line measured. In general, a distance of 6 or 7 pixels (which corresponds to 600 or 700 nm) was employed.
The phasor transformation and data analysis of the calcium experiments were also performed with the use of the SimFCS software, as described previously (16,18,19). Briefly, the phasor approach to FLIM transforms the fluorescence decay histogram at each pixel in an image into the sine and cosine components, which are then represented in a two-dimensional polar plot (phasor plot). Each pixel of an image therefore gives rise to a single point (phasor) in the phasor plot, and when used in reciprocal mode, enables each point of the phasor plot to be mapped to each pixel of the image (18). Because phasors follow simple vector algebra, it is possible to determine the fractional contribution of two or more independent molecular species coexisting in the same pixel. In the case of two species, all possible weightings give a phasor distribution along a linear trajectory that joins the phasors of the individual species in pure form. Thus, in the case of a calcium indicator, where there is a free and a bound form (pfree and pbound, respectively), the fraction of the dye bound to calcium can be quantified in each pixel of an image, after correction for the relative quantum yield of the bound and free species (19). This fraction can also be converted to calcium concentration, with knowledge of the KD of the indicator dye employed. In the case of the experiments described here, the KD of Calcium Green-1 is 600 ± 50 nM for the nucleoplasmic region (20).
Results
We use CHO-K1 cells stably transfected with monomeric EGFP and transiently transfected with the H2B-mCherry plasmid to measure the role chromatin compaction has on the localization and flow of inert molecules in the nucleus upon mitotic division. In our system, ∼2% of the plated cells are undergoing mitosis. By visual inspection of the H2B-mCherry marked nuclei, we select a cell in the early stage of mitosis and follow it until early interphase. In addition to recording the mitotic process by fluorescence imaging, every 10 min we measure the average localization and flow of EGFP along a line drawn in the nucleus across a heterogeneous chromatin environment. Fig. 1, A–D, depicts four of the distinct nuclear chromatin arrangements identified in a typical CHOK1 cell undergoing mitosis (early mitosis, mid-mitosis, late mitosis, and early interphase) (13). In Fig. 1, E–H, we show the corresponding chromatin environments tested by the line-scanning experiment. The selected line is scanned 2 × 10⁵ times across 32 pixels (3.2 μm) in the EGFP channel with the experimental settings described in the Materials and Methods section. A time segment that is not affected by photobleaching or cell movement is then selected and displayed as an intensity carpet in which the x-coordinate corresponds to the points along the line (pixels) and the y-coordinate corresponds to the time of acquisition (Fig. 1, I–L). A pair correlation analysis between columns located in the different chromatin environments along the line is then performed and constructed into a pCF carpet (x-coordinate: space; y-coordinate: log time; Fig. 1, M–P). In previous work we characterized the localization (and flow) of EGFP in early mitosis, as depicted here in Fig. 1 A. These experiments demonstrated that EGFP is excluded from highly compact regions of chromatin, and its flow into and out of this environment is delayed, causing the pCF carpet to display characteristic arcs upon entry and exit (arc depths indicate a delay of 8 ± 5 ms). Simulations predict that the molecules diffusing through the chromatin zone should accumulate there as consequence of the slower diffusion imparted by this environment (7). In vivo, however, EGFP is excluded from the compact chromatin, a result that can be explained if chromatin represents a compact volume that excludes other molecules from accumulating there. Remarkably, the EGFP accumulation predicted by the simulation becomes significant in vivo throughout the next stages of mitosis (Fig. 1, B and C). From the intensity carpets we detect an increasing degree of EGFP accumulation in the most compact region of chromatin (Fig. 1, I–L). This result may indicate a decrease in compaction of the chromatin from mid- to late mitosis, as also recently suggested by others (13). In parallel, if we perform a pCF analysis on each of these line experiments at a distance that measures molecular flow into and out of the chromatin region, we see that the characteristic arc shapes (delayed diffusion) are retained (Fig. 1, N and O) but with different timing compared with that observed in early mitosis. In the pCF carpet of mid-mitosis (Fig. 1 N), we find that the time delay for EGFP to access and exit the chromatin fiber is 32 ± 8 ms in both cases, which causes a lengthening in the symmetric double-arc feature previously observed for early mitosis. In the pCF carpet of late mitosis (Fig. 1 O), we find that the time delay for EGFP to access the chromatin fiber is 26 ± 6 ms (similar to the timing in mid-mitosis); however, the time delay for EGFP to exit the chromatin is increased to 141 ± 14 ms, which causes the double-arc feature to become highly asymmetric. As a control, if we reverse the direction of the pCF analysis applied to this experiment in late mitosis, we see that molecular flow into the chromatin from the other side occurs with less delay compared with molecular flow out of the chromatin (Fig. 2). This asymmetry in the ability of EGFP to penetrate the chromatin environment as compared with its ability to exit explains the high degree of EGFP accumulation observed in late mitosis. Finally, upon completion of cell division, we measured the EGFP localization and molecular flow in the two early-interphase daughter nuclei (Fig. 1 D). In agreement with our previous results (6), fluorescence imaging detects a clear exclusion of EGFP from the most compact region of chromatin tested across the line (Fig. 1 L), whereas the pCF analysis reveals an absence of correlation upon entry and exit (Fig. 1 P). This is the signature of disconnected communication between the two environments. The results presented in Fig. 1 represent the analysis of six to eight different cells, with three to four line experiments acquired in each cell-cycle stage identified. The overall temporal changes in EGFP mobility into and out of chromatin during cell division are summarized in Fig. 3. As a control experiment, we measured fluorescein mobility into and out of chromatin during mitosis and interphase, and found that the mobility was not impeded by chromatin compaction or dependent on the cell cycle (see Fig. S1 in the Supporting Material).
Figure 1.
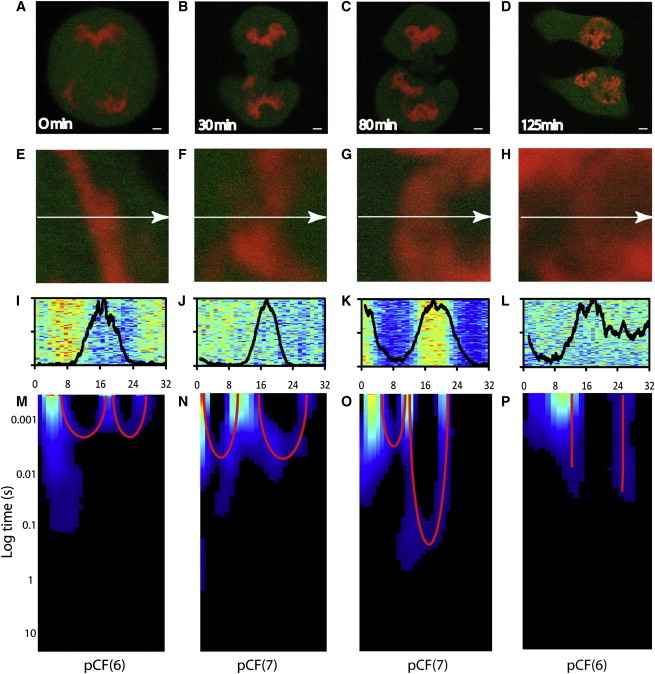
(A–D) CHO-K1 cell stably expressing monomeric EGFP, with the chromatin marked by H2B-mCherry in four nuclear stages identified as being structurally distinct from mid-mitosis to early interphase. Scale bar: 3 μm. (E–H) Overlay of free EGFP and H2B-mCherry localization in the plane of the 3.2 μm line drawn in the four stages identified in A–D, respectively. (I–L) Overlay of the intensity profile of the H2B-mCherry stain with the fluorescence intensity carpet of the line drawn across freely diffusing EGFP (105 lines) in E–H, respectively. (M–P) The pCF carpet derived from the intensity carpets constructed in I–L at a distance measuring EGFP molecular flow into and out of the most compact chromatin regions present along the respective line.
Figure 2.
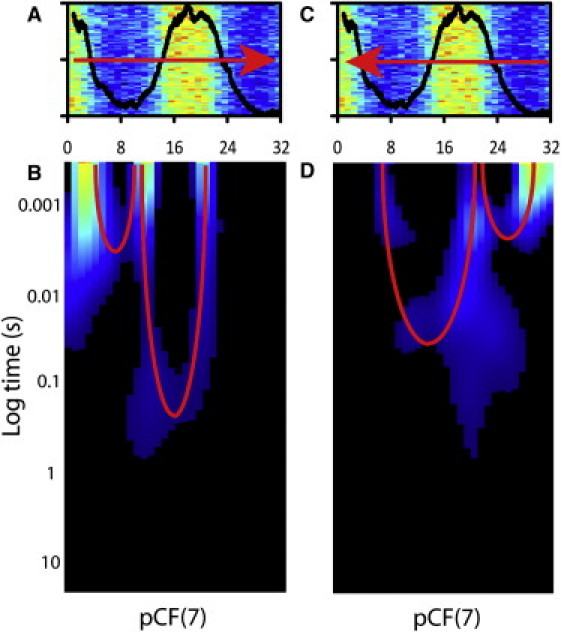
Reverse analysis of asymmetric flow into and out of compact chromatin in late mitosis. (A) Overlay of the intensity profile of the H2B-mCherry stain with the fluorescence intensity carpet of the line drawn across freely diffusing EGFP for analysis from left to right. (B) Overlay of the intensity profile of the H2B-mCherry stain with the fluorescence intensity carpet of the line drawn across freely diffusing EGFP for analysis from right to left. (C) The pCF carpet derived from analysis of molecular flow into and out of the compact chromatin region in the direction indicated in panel A. (D) The pCF carpet derived from reverse analysis of molecular flow into and out of the compact chromatin region in the direction indicated in panel B.
Figure 3.
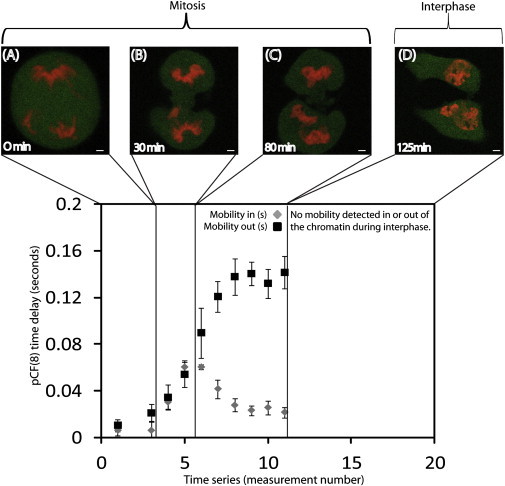
(A–D) EGFP mobility into and out of chromatin (as found from the maximum of the derived pair-correlation profile for these two diffusive routes) for the four distinct nuclear stages identified in Fig. 1 (early mitosis, mid-mitosis, late mitosis, and early interphase). The gray points correspond to EGFP mobility into the chromatin, and the black points correspond to EGFP mobility out of the chromatin for two different experiments. (A) In early mitosis, mobility into and out of the chromatin occurs with a 8 ± 5 ms delay. (B) In mid-mitosis, mobility into and out of the chromatin occurs with a 32 ± 8 ms delay. (C) In late mitosis, mobility into and out of the chromatin occurs with delays of 26 ± 6 ms and 141 ± 14 ms, respectively. Scale bar: 3 μm.
Our results regarding the diffusive behavior of EGFP throughout the cell cycle may be interpreted in terms of controlled changes in chromatin compaction, as this would explain both the EGFP localization and flow patterns observed. As a way to alternatively measure chromatin compaction in our system, we analyzed Ca2+ concentration during cell division, because it is known to play an important role in determining the structural integrity and condensation level of chromosomes (10,21). We find that from mid- to late mitosis (Fig. 4, A–C), when delayed molecular flow into and out of the chromatin is observed by pCF analysis (see Fig. 1), a high concentration of Ca2+ (551 ± 104 nM) is bound in the nucleus (Fig. 4, E–G). Upon completion of cell division (early interphase; Fig. 4 D), when the chromatin behaves as an impenetrable barrier to molecular flow, the Ca2+ content bound in the nucleus is dramatically reduced (36 ± 6 nM) and expelled into the cytoplasm (Fig. 4 H). The presence of Ca2+ on chromatin is known to neutralize charge while at the same time it induces compaction (10,21). Our result suggests that the electrostatic environment of chromatin represents a stronger barrier to diffusion than does physical compactness. That is, when Ca2+ is not bound to the chromatin (a state in which the chromatin is less compact), the net negative charge that results causes a larger barrier to EGFP. The results shown in Fig. 4 represent an analysis of three to five different cells.
Figure 4.
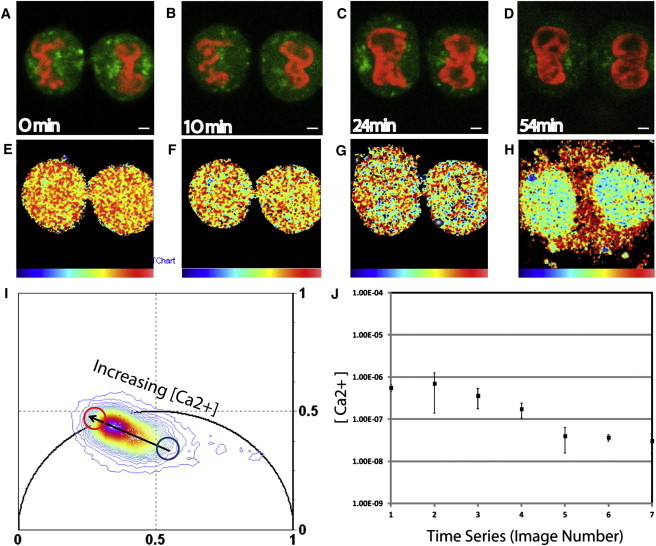
(A–D) Intensity images of a dividing CHO-K1 cell that is stained with Calcium Green-1 AM and has chromatin marked by H2B-mCherry, in four nuclear stages identified as being structurally distinct from late mitosis to early interphase. Scale bar: 3 μm. (E–H) Pseudo-colored FLIM images of A–D, with the palette defined in the phasor plot of panel I. (I) Phasor distribution of the calcium experiment. The blue cursor highlights the phasor of the free form of the calcium indicator, and the red cursor indicates the bound form. (J) The average calcium concentration bound to chromatin over the duration of the experiment. With respect to images E–H, there is a decrease in local calcium concentration from 551 ± 104 nM, to 358 ± 182 nM, to 173 ± 67 nM, and to 36 ± 6 nM.
Discussion
Modulation of protein access and consequently local protein concentration by chromatin could constitute a general mechanism for the regulation of binding dynamics, enzymatic activities, and DNA activity in general. For example, in a series of fluorescence correlation spectroscopy (FCS) studies to examine anomalous subdiffusion in the nucleus, investigators found that the degree of molecular crowding imparted by chromatin is crucial for cell viability as well as cell function (22,23). On the basis of the pair-correlation method, we measure how different chromatin structures affect the intranuclear molecular flow of an inert tracer (EGFP) at the single-molecule, single-cell level upon mitotic cell division. We find that the naturally occurring changes in chromatin organization impart a regulation on the spatial distribution and temporal dynamics of EGFP within the nucleus. In mid-mitosis, EGFP is excluded from the compact chromatin, and access into and out of this environment are equally probable (symmetric double arc in the pCF, occurring on the millisecond timescale). As mitotic division proceeds, EGFP accumulates within the chromatin region and the molecular flow into and out of the chromatin becomes asymmetric, with a longer delay for molecules flowing out of the chromatin as compared with those flowing into it. Upon cell division in the early stage of interphase, EGFP is excluded from the chromatin, and the flow into and out of this environment becomes on average disconnected.
We correlate the distinct modes of regulation imparted by the changing chromatin compaction with measured variations in nuclear Ca2+ concentration upon cell division, rather than with intensity changes in the local chromatin density. This result is in agreement with a recent study carried out by Dross et al. (24) in which a series of single-point FCS measurements in the interphase nucleus revealed that the mobility of EGFP and its oligomers did not correlate locally with the chromatin network. In particular, we find that there is an inversely proportional relationship between the concentration of calcium bound in the nucleus and the accessibility of this environment during cell division. Besides being an indirect proof of the link between chromatin organization and chromatin accessibility to inert molecules, this result confirms the expected role of divalent cations in the regulation of intranuclear architecture and processes (10,21). From these experimental results, we can deduce that chromatin compaction and organization are fundamental to the regulation of protein access within the nucleus throughout the cell cycle.
Activities related to protein interaction with DNA (e.g., transcription, recombination, DNA repair, and replication) stop at the onset of mitosis. Accordingly, the chromatin is highly compact, and thus the surface volume available for interaction is restricted (25,26). This effect was recently shown at the nanometer scale by a series of FRET-based measurements that revealed an overall increase in nucleosome compaction from prometaphase to late anaphase (13). It is also in good agreement with what we observed here on the micrometer scale using EGFP diffusion to evaluate chromatin accessibility during the early mitotic process. Therefore, we suggest that the partial exclusion of inert molecules in early mitosis is due to the structurally restrictive and dense environment inherent to condensed chromatin. As mentioned above, a high Ca2+ concentration bound in the nucleus at this point is required to generate and maintain the highly condensed chromatin structure. During this stage of mitosis, the observed reduced access of proteins could contribute to the mitotic shutdown of transcription, replication, and other DNA-dependent processes. The results based on the FRET measurements also indicate a transition phase between anaphase and telophase, where the nucleosomal compaction is rapidly reversed (13).
Accordingly, in late mitosis we show a high degree of EGFP accumulation in the high chromatin densities of the daughter nuclei. Besides being an indirect proof of a transition at the chromatin compaction level, this result points out a potential mechanism to contain diffusing molecules at this stage. This accumulation may represent a way to localize the molecular factors that are needed to restart the DNA-dependent cellular activities during interphase, in which case the chromatin environment at this stage could be interpreted as a kind of nuclear reactor that is able to create the appropriate chemical conditions for the onset of interphase in the daughter nuclei. Accordingly, the Ca2+ concentration bound in the nucleus at this stage shows a trend toward lower values, typical of interphase (Fig. 4 G). Finally, once interphase is established, a different level of regulation is imposed on EGFP molecular flow, with disconnected communication between chromatin regions. In addition, the bound Ca2+ content reaches its lowest concentration in the nucleus, in keeping with the presence of mostly decondensed chromatin architecture.
In conclusion, our findings provide a basis for understanding the regulation of molecular flow of inert molecules imparted by chromatin during the cell cycle. In future work we plan to investigate whether such regulation also affects specific nuclear factors involved in DNA-dependent activities.
Acknowledgments
The authors thank Milka Stakic for cultivating and transfecting the CHO-K1 cells.
This work was supported by the National Institutes of Health (NIH-P41-RRO3155, P50-GM076516, and NIH-U54 GM064346) and the Cell Migration Consortium (to M.A.D. and E.G.).
Footnotes
Francesco Cardarelli's present address is Center for Nanotechnology Innovation @NEST, Istituto Italiano di Tecnologia, Pisa, Italy.
Supporting Material
References
- 1.Gorski S.A., Dundr M., Misteli T. The road much traveled: trafficking in the cell nucleus. Curr. Opin. Cell Biol. 2006;18:284–290. doi: 10.1016/j.ceb.2006.03.002. [DOI] [PubMed] [Google Scholar]
- 2.Misteli T. Concepts in nuclear architecture. BioEssays. 2005;27:477–487. doi: 10.1002/bies.20226. [DOI] [PubMed] [Google Scholar]
- 3.Belmont A.S., Dietzel S., Tumbar T. Large-scale chromatin structure and function. Curr. Opin. Cell Biol. 1999;11:307–311. doi: 10.1016/S0955-0674(99)80041-6. [DOI] [PubMed] [Google Scholar]
- 4.Cremer T., Küpper K., Dietzel S., Fakan S. Higher order chromatin architecture in the cell nucleus: on the way from structure to function. Biol. Cell. 2004;96:555–567. doi: 10.1016/j.biolcel.2004.07.002. [DOI] [PubMed] [Google Scholar]
- 5.Lanctôt C., Cheutin T., Cremer T. Dynamic genome architecture in the nuclear space: regulation of gene expression in three dimensions. Nat. Rev. Genet. 2007;8:104–115. doi: 10.1038/nrg2041. [DOI] [PubMed] [Google Scholar]
- 6.Hinde E., Cardarelli F., Gratton E. In vivo pair correlation analysis of EGFP intranuclear diffusion reveals DNA-dependent molecular flow. Proc. Natl. Acad. Sci. USA. 2010;107:16560–16565. doi: 10.1073/pnas.1006731107. [DOI] [PMC free article] [PubMed] [Google Scholar]
- 7.Hinde E., Cardarelli F., Gratton E. The impact of mitotic versus interphase chromatin architecture on the molecular flow of EGFP by pair correlation analysis. Biophys. J. 2011;100:1829–1836. doi: 10.1016/j.bpj.2011.02.024. [DOI] [PMC free article] [PubMed] [Google Scholar]
- 8.Mora-Bermúdez F., Ellenberg J. Measuring structural dynamics of chromosomes in living cells by fluorescence microscopy. Methods. 2007;41:158–167. doi: 10.1016/j.ymeth.2006.07.035. [DOI] [PubMed] [Google Scholar]
- 9.Vagnarelli P., Hudson D.F., Earnshaw W.C. Condensin and Repo-Man-PP1 co-operate in the regulation of chromosome architecture during mitosis. Nat. Cell Biol. 2006;8:1133–1142. doi: 10.1038/ncb1475. [DOI] [PMC free article] [PubMed] [Google Scholar]
- 10.Strick R., Strissel P.L., Levi-Setti R. Cation-chromatin binding as shown by ion microscopy is essential for the structural integrity of chromosomes. J. Cell Biol. 2001;155:899–910. doi: 10.1083/jcb.200105026. [DOI] [PMC free article] [PubMed] [Google Scholar]
- 11.Robinett C.C., Straight A., Belmont A.S. In vivo localization of DNA sequences and visualization of large-scale chromatin organization using lac operator/repressor recognition. J. Cell Biol. 1996;135:1685–1700. doi: 10.1083/jcb.135.6.1685. [DOI] [PMC free article] [PubMed] [Google Scholar]
- 12.Strukov Y.G., Belmont A.S. Mitotic chromosome structure: reproducibility of folding and symmetry between sister chromatids. Biophys. J. 2009;96:1617–1628. doi: 10.1016/j.bpj.2008.10.051. [DOI] [PMC free article] [PubMed] [Google Scholar]
- 13.Llères D., James J., Lamond A.I. Quantitative analysis of chromatin compaction in living cells using FLIM-FRET. J. Cell Biol. 2009;187:481–496. doi: 10.1083/jcb.200907029. [DOI] [PMC free article] [PubMed] [Google Scholar]
- 14.Martin R.M., Cardoso M.C. Chromatin condensation modulates access and binding of nuclear proteins. FASEB J. 2010;24:1066–1072. doi: 10.1096/fj.08-128959. [DOI] [PMC free article] [PubMed] [Google Scholar]
- 15.Hinde E., Cardarelli F. Measuring the flow of molecules in cells. Biophys. Rev. 2011;3:119–129. doi: 10.1007/s12551-011-0051-x. [DOI] [PMC free article] [PubMed] [Google Scholar]
- 16.Cardarelli F., Gratton E. In vivo imaging of single-molecule translocation through nuclear pore complexes by pair correlation functions. PLoS ONE. 2010;5:e10475. doi: 10.1371/journal.pone.0010475. [DOI] [PMC free article] [PubMed] [Google Scholar]
- 17.Digman M.A., Gratton E. Imaging barriers to diffusion by pair correlation functions. Biophys. J. 2009;97:665–673. doi: 10.1016/j.bpj.2009.04.048. [DOI] [PMC free article] [PubMed] [Google Scholar]
- 18.Digman M.A., Caiolfa V.R., Gratton E. The phasor approach to fluorescence lifetime imaging analysis. Biophys. J. 2008;94:L14–L16. doi: 10.1529/biophysj.107.120154. [DOI] [PMC free article] [PubMed] [Google Scholar]
- 19.Celli A., Sanchez S., Mauro T. The epidermal Ca(2+) gradient: measurement using the phasor representation of fluorescent lifetime imaging. Biophys. J. 2010;98:911–921. doi: 10.1016/j.bpj.2009.10.055. [DOI] [PMC free article] [PubMed] [Google Scholar]
- 20.Thomas D., Tovey S.C., Lipp P. A comparison of fluorescent Ca2+ indicator properties and their use in measuring elementary and global Ca2+ signals. Cell Calcium. 2000;28:213–223. doi: 10.1054/ceca.2000.0152. [DOI] [PubMed] [Google Scholar]
- 21.Engelhardt M. Condensation of chromatin in situ by cation-dependent charge shielding and aggregation. Biochem. Biophys. Res. Commun. 2004;324:1210–1214. doi: 10.1016/j.bbrc.2004.09.175. [DOI] [PubMed] [Google Scholar]
- 22.Wachsmuth M., Waldeck W., Langowski J. Anomalous diffusion of fluorescent probes inside living cell nuclei investigated by spatially-resolved fluorescence correlation spectroscopy. J. Mol. Biol. 2000;298:677–689. doi: 10.1006/jmbi.2000.3692. [DOI] [PubMed] [Google Scholar]
- 23.Guigas G., Kalla C., Weiss M. Probing the nanoscale viscoelasticity of intracellular fluids in living cells. Biophys. J. 2007;93:316–323. doi: 10.1529/biophysj.106.099267. [DOI] [PMC free article] [PubMed] [Google Scholar]
- 24.Dross N., Spriet C., Langowski J. Mapping eGFP oligomer mobility in living cell nuclei. PLoS ONE. 2009;4:e5041. doi: 10.1371/journal.pone.0005041. [DOI] [PMC free article] [PubMed] [Google Scholar]
- 25.Belmont A.S. Mitotic chromosome structure and condensation. Curr. Opin. Cell Biol. 2006;18:632–638. doi: 10.1016/j.ceb.2006.09.007. [DOI] [PubMed] [Google Scholar]
- 26.Daban J.R. High concentration of DNA in condensed chromatin. Biochem. Cell Biol. 2003;81:91–99. doi: 10.1139/o03-037. [DOI] [PubMed] [Google Scholar]
Associated Data
This section collects any data citations, data availability statements, or supplementary materials included in this article.