Abstract
Hypothalamic α-melanocyte-stimulating hormone (α-MSH) plays a central role in regulating energy uptake and expenditure. Prolyl carboxypeptidase (PRCP), a protease expressed in the hypothalamus, is responsible for the degradation of α-MSH. PRCP null animals (PRCPgt/gt mice) display elevated α-MSH in the hypothalamus, lower body weight, and are protected from diet induced obesity. Here, we report that PRCPgt/gt mice have a significant decrease in fat mass, although an increase in lean mass was also observed. In agreement with low fat accumulation, reduced leptin levels were found. Consistent with the effect of α-MSH on energy metabolism, PRCPgt/gt mice had increased energy expenditure with elevated circulating thyroid hormone levels and brown adipose tissue uncoupling protein 1 mRNA levels compared with control mice when exposed to regular diet. TRH mRNA levels in the PVN were significantly higher in fed PRCPgt/gt animals compared with fed wild-type controls. Fasting significantly decreased TRH mRNA levels in both PRCPgt/gt and wild-type (WT) mice. However, TRH mRNA levels in fasted PRCPgt/gt animals were significantly higher than those of fasted WT mice. Refeeding analysis after fasting showed a reduced food intake in PRCPgt/gt compared with WT mice. Finally, TRH mRNA levels in T3-treated hypothyroid PRCPgt/gt mice showed a non significant reduction compared with those of hypothyroid PRCPgt/gt mice, supporting the impairment of the hypothalamo-pituitary-thyroid axis in PRCPgt/gt mice. All together, these data confirm that PRCP plays a role in the regulation of energy metabolism.
Hypothalamic proopiomelanocortin neurons are important regulators of energy metabolism. The activity of these neurons is regulated by circulating signals such as hormones and nutrients (1–3). Proopiomelanocortin gene encodes several peptides, including α-melanocyte-stimulating hormone (α-MSH). Once produced, α-MSH regulates the hypothalamo-pituitary-thyroid (HPT) axis via activation of TRH-containing neurons in the paraventricular nucleus (PVN) of the hypothalamus (4, 5). α-MSH neurons have shown to innervate paraventricular TRH neurons, and this innervation is excitatory in nature (5). Indeed, intracerebroventricular administration of α-MSH has been shown to increase TRH mRNA levels (4). However, the neuro-anatomical and functional organization of TRH cells in the PVN is heterogeneous. TRH cells in the medial portion of PVN are the neuroendocrine neurons that project to the external layer of the median where TRH is released and regulate the production of TSH from the anterior pituitary (6). The TRH neurons in the anterior and posterior portion of PVN, on the other hand, project to other brain areas, including brain stem nuclei, where they regulates energy expenditure (7–10).
We have recently shown that α-MSH degradation is an important event in the regulation of energy metabolism (11). The enzyme responsible for this process is a serine protease called prolyl carboxypeptidase (PRCP). PRCP acts by cleaving the last amino acid at the carboxy terminus of short peptides containing a proline as penultime amino acid. We showed that PRCP cleaves hypothalamic α-MSH(1–13) producing the biologically inactive form of α-MSH(1–12) (11). Mice with PRCP ablation have increased hypothalamic α-MSH levels and reduced body weight when they are exposed to both regular chow and high-fat diet compared with wild-type (WT) mice (11). This study was undertaken to assess the effect of PRCP ablation on energy expenditure and on the HPT axis.
Materials and Methods
Animals
All animal work in these studies was approved by Yale University Institutional Animal Care and Use Committee. Male mice (3 months old) were used in these studies. Animals were housed in a temperature-controlled environment (25 C) with a 12-h light, 12-h dark (1800–0600 h) photoperiod.
Measurement of energy expenditure and body composition
A group of animals (n = 12 for both PRCPgt/gt and control) were individually housed 1 wk before the measurements. Animals were then individually housed in the metabolic cages (TSE PhenoMaster System, Inc., Midland, MI), where parameters were automatically measured every 30 min for 1 wk. Body composition was measured in vivo by magnetic resonance imaging (EchoMRI; Echo Medical Systems, Houston, TX).
Measurement of circulating leptin and thyroid hormones
Serum from each blood sample (n = 8 in fed, n = 9 in fasting in PRCPgt/gt; n = 7 in fed, n = 6 in fasting in the control) was obtained by centrifugation at 3000 rpm for 15 min. Circulating free T4 and T3 levels were analyzed using ELISA kits [Free T4 Test kit (product no. T182) and Free T3 Test kit (product no. T183), respectively; Leinco Technologies, St. Louis, MO] followed by the manufacturer's protocol. Serum leptin was also determined using commercially available kit (Mouse Leptin ELISA kit; Millipore, Bedford, MA).
Real-time PCR
Brown adipose tissue (BAT) RNA (n = 4 per group) was extracted to quantify uncoupling protein 1 (UCP1) gene expression by using a QIAGEN RNAeasy kit (QIAGEN, Valencia, CA). Pituitary RNA was also extracted from (n = 4 per group) for the TSH gene expression. Total RNA (0.5–1 μg) was reverse transcribed using High Capacity cDNA RT kit (Applied Biosystems, Foster City, CA). Real-time PCR with diluted cDNA was performed using the LightCycler 480 (Roche, Indianapolis, IN) and TaqMan Gene Expression Assay primers (catalog no. Mm 00494069_m1 for the UCP1 and Mm03990915_g1 for the TSH; Applied Biosystems) in a 20-μl reaction volume in triplicates. The calculations of average crossing point values, sd, and resulting expression ratios for each target gene were performed using the Roche LightCycler 480 software.
Radioactive in situ hybridization
To detect and compare mRNA expression level of TRH in the PVN, we generated 33P-labeled sense and antisense riboprobes specific to rat TRH (12) and purified them using G-50 columns as described elsewhere (13, 14). Mice were divided in four groups: WT (n = 5) and PRCPgt/gt (knockout) (n = 4) fed ad libitum and WT (n = 5) and PRCPgt/gt (n = 5) overnight fasted. Brains were dissected and coronal sections cut (10 μm) on a cryostat (Leica CM 1850; Leica, Wetzlar, Germany) and stored at −80 C until use. In situ hybridization was performed as previously reported (12). Briefly, after fixation at room temperature in 3% paraformaldehyde, slides were dehydrated through alcohol series (70, 95, and 100% for 2 min each). The slides were then acetylated for 10 min at room temperature in 0.0135% triethanolamine and 0.0025% acetic anhydride in ribonuclease-free water and dehydrated again through an alcohol series. Slides were then hybridized with either sense or antisense riboprobes (500,000 cpm per section) at 60 C in a mineral oil bath. The next day, the sections went through several washing steps, dehydrated, and subjected to phosphorimager screening (STORM 860 II phosphorimager; GE Healthcare, Princeton, NJ) and further emulsion autoradiography performed as previously reported (13).
Nissl staining
Slides were removed from −80 C and dehydrated through sequential ascending movement of alcohol series (50, 70, 95, and 100% alcohol) and incubated in zylene for 10 min. Slides were rehydrated through descending alcohol series and filtered water and incubated in 0.1% cresyl violet solution for 15 min. After quick movement of ascending alcohol series, slides were stored in xylene for 10 min and coversliped using Cytoseal mounting medium (Thermo Scientific, Rockford, IL). The antero-, mid-, and posterior-PVN from Nissl-stained sections were identified depending on the shape as described in detail somewhere else (6). It was also clear to distinguish compact part of the PVN by cell density from midpart of the PVN. Because the localization of hypophysiotropic TRH neurons as well as hypothyroidism-dependent negative feedback of TRH gene activity in mice are observed only in the mid-PVN (6), we analyzed TRH gene expression only in the mid-PVN for this study.
Fasting and refeeding
Animals (n = 6 per group) were food deprived overnight and food reintroduced and measured at 1, 2, 3, and 24 h.
Hypothyroidism and T3 treatment
To test whether Prcpgt/gt mice have impaired thyroid hormone negative feedback loop, we induced hypothyroidism in WT and Prcpgt/gt mice. For this study, animals were grouped as follow: hypothyroid WT and Prcpgt/gt (n = 4 each) treated with saline and hypothyroid WT and Prcpgt/gt (n = 4 each) treated with low doses of T3 (14). Hypothyroidism was induced by sc implantation of microosmotic pumps (model 1002, 0.25 μl/h for 14 d; DURECT Corp., Cupertino, CA) filled with methimazole (250 μg/ml in sterile water). After 1 wk from the implantation, serum-free T4 levels were analyzed to verify the development of hypothyroidism. Animals were then injected ip either with saline or T3 (5 ng/g body weight) for 3 d (14). Animals were killed 12 h after the last injection, and brains were dissected for TRH mRNA expression in the PVN.
Statistical analysis
Radioactive in situ data were analyzed using National Institutes of Health ImageJ program. A background density outside of the PVN was used to normalize the data. The values of each group were normalized to the value of fed WT (considered as 100). All data are expressed as means ± se and were compared by either Student's t test or two-way ANOVA, followed by Bonferroni test, and P < 0.05 was considered significant.
Results
Body weight, body composition, and energy expenditure
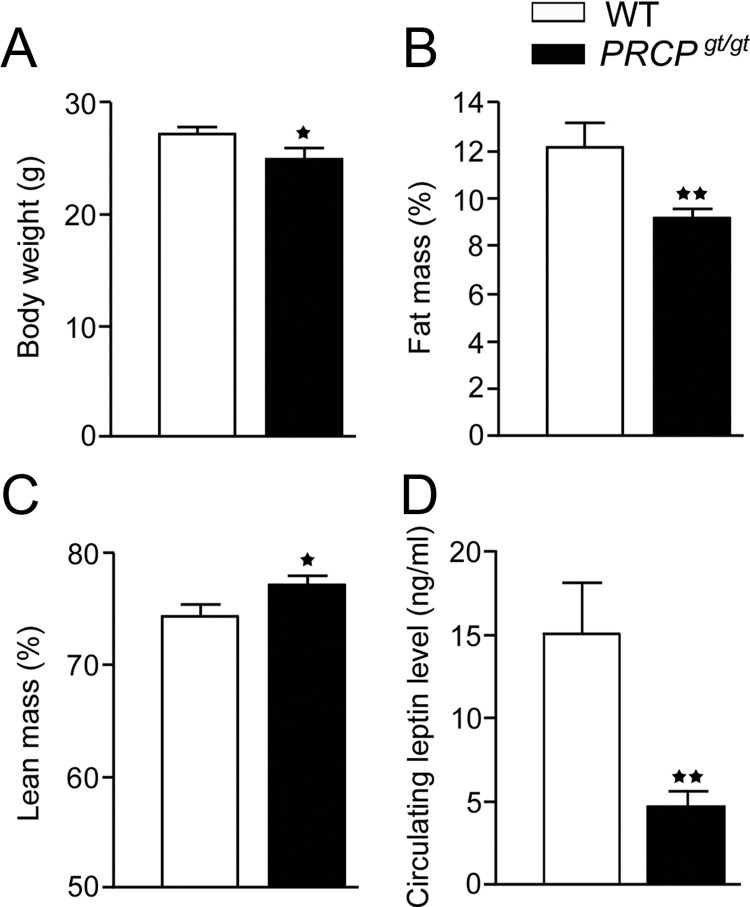
As previously reported (11), PRCPgt/gt mice (12 wk old) were significantly lighter than WT controls (27.4 ± 1.8 g WT and 25.0 ± 2.8 g PRCPgt/gt mice; n = 10 and 9, respectively; P = 0.038) (Fig. 1A). EchoMRI analysis showed that PRCPgt/gt had a reduced fat mass (12.2 ± 3.2 and 9.2 ± 1.2% in WT and PRCPgt/gt, respectively; n = 6; P = 0.006) (Fig. 1B) and an increased lean mass (74.5 ± 3.2 and 77.3 ± 2.4% in WT and PRCPgt/gt, respectively; P = 0.026) (Fig. 1C), compared with those of WT mice, and this pattern was observed also in older mice (data not shown). These differences were also found when the total fat and lean mass were expressed in grams (fat mass, 3.7 ± 0.37 g in WT mice and 2.39 ± 0.13 g in PRCPgt/gt mice; lean mass, 21.08 ± 0.53 g in WT mice and 18.47 ± 0.62 g in PRCPgt/gt mice). In agreement with a reduced fat mass, circulating leptin levels were lower in PRCPgt/gt mice than the controls (15.13 ± 11.5 and 4.7 ± 3.0 ng/ml, n = 13 and 11, P = 0.008, WT and PRCPgt/gt, respectively) (Fig. 1D).
Fig. 1.
Body weight (A), percent of fat (B) and lean mass (C), and circulating leptin level (D) in PRCPgt/gt and WT mice. Data are expressed as means ± se; *, P < 0.05; **, P < 0.01.
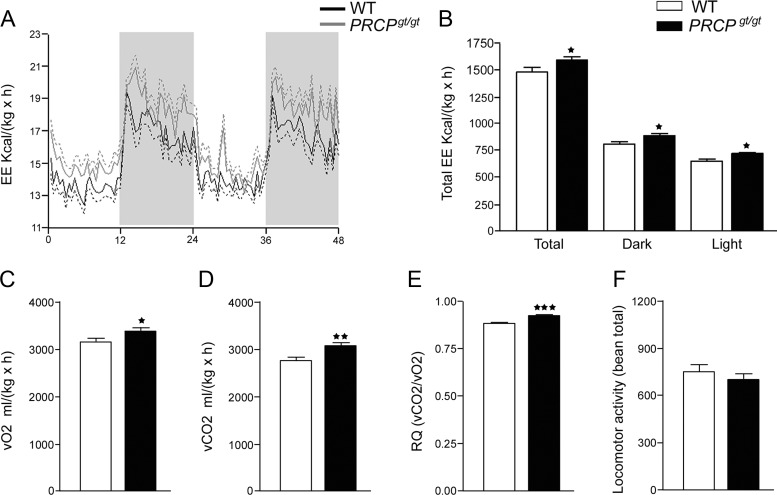
Analysis of indirect calorimetry revealed that PRCPgt/gt animals had an overall increased energy expenditure (1601.1 ± 110.7 kcal/kg·h) compared with that of WT controls (1480 ± 130.8 kcal/kg·h; P = 0.023) (Fig. 2, A and B). Both during the light and dark phases, energy expenditure was significantly greater in PRCPgt/gt mice than in control animals (888.9 ± 66.8 and 817.9 ± 80.9 kcal/kg·h dark phase, P = 0.029; 712.2 ± 48.4 and 662.3 ± 53.2 kcal/kg·h light phase, P = 0.025 in PRCPgt/gt and WT, respectively, n = 12 each). PRCPgt/gt mice had an increased level of O2 consumption (3371 ± 65.7 and 3144 ± 77 ml/h, P = 0.035 in PRCPgt/gt and WT, respectively) (Fig. 2C), CO2 production (3087 ± 70 and 2751 ± 79.9 ml/h, P = 0.0045 in PRCPgt/gt and WT, respectively) (Fig. 2D), and respiratory exchange rate (0.9154 ± 0.007 and 0.8743 ± 0.007, P = 0.0004 in PRCPgt/gt and WT, respectively) (Fig. 2E). No differences in locomotor (698.6 ± 43.2 and 751.7 ± 45.4, P = 0.4 in PRCPgt/gt and WT, respectively) (Fig. 2F) and ambulatory activities (473.1 ± 36.5 and 508.2 ± 37.6, P = 0.5 in PRCPgt/gt and WT, respectively; data not shown) were observed.
Fig. 2.
A and B, Results of the analysis of energy expenditure (EE) by indirect calorimetry in WT and PRCPgt/gt mice (n = 6 for both groups). C–F, Results of O2 consumption (vO2) (C), CO2 production (vCO2) (D), respiratory exchange rate (RQ) (E), as well as locomotor activity (F), in WT and PRCPgt/gt mice. Data are expressed as means ± se; *, P < 0.05; **, P < 0.01; ***, P < 0.001.
PRCP affects circulating thyroid hormones level
Because thyroid hormones are important regulators of energy expenditure, we measured serum-free T4 and T3 in PRCPgt/gt and WT mice (Fig. 3, A and B). In fed state, serum-free T4 levels were significantly higher in PRCPgt/gt (3.3 ± 0.1 ng/dl; n = 8) than WT mice (2.9 ± 0.1 ng/dl; n = 7; P = 0.01). On the other hand, no difference in free T3 levels were observed in fed state between the two groups (4.4 ± 0.6 pg/dl vs. 4.3 ± 0.7 ng/dl in WT and PRCPgt/gt, respectively; n = 8/6 per group). When animals were fasted, serum-free T4 level significantly decreased in both groups (P = 0.046 for WT and P = 0.0004 for PRCPgt/gt mice). However, free T4 was still significantly elevated in fasted PRCPgt/gt mice (2.9 ± 0.2 ng/dl; n = 9) compared with fasted WT controls (2.5 ± 0.3 ng/dl; n = 6; P = 0.007), reaching levels similar to those observed in WT controls in fed state (2.9 ± 0.1 ng/dl; P = 0.97). Although serum-free T3 levels did not differ between groups in fed state, in fasted state, a significant difference in free T3 levels was observed between PRCPgt/gt mice (3.3 ± 0.9 pg/dl; n = 6) and WT controls (1.8 ± 1.2 pg/dl; n = 6).
Fig. 3.

A and B, Results of the analysis of serum-free T4 (A) and T3 (B) levels in WT and PRCPgt/gt fed on a regular chow diet or overnight fasted. C and D, Results of TSH mRNA levels in the pituitary of fed and fasted WT and PRCPgt/gt mice and UCP1 mRNA expression levels in BAT of fed WT and PRCPgt/gt mice by real-time PCR. Data are expressed as means ± se; *, P < 0.05; **, P < 0.01; ***, P < 0.001.
Pituitary TSH mRNA levels
Analysis of TSH mRNA levels n the pituitary of fed WT and PRCPgt/gt mice showed no difference between the two groups (100 ± 18.42 in WT and 80.70 ± 10.94, n = 4 in PRCPgt/gt mice, P = 0.4) (Fig. 3C). Fasting significantly lowered TSH mRNA levels in both WT and PRCPgt/gt mice (24.03 ± 1.28 in WT and 25.71 ± 11.10 in PRCPgt/gt, P = 0.01; n = 4) (Fig. 3C). No differences were observed between fasted WT and fasted PRCPgt/gt mice (P = 0.9).
BAT UCP1 mRNA levels
Because thyroid hormones play a key role in the regulation of constitutive and adaptive thermogenesis (15) mainly through UCP1 signaling in the BAT (16), we then measured mRNA expression level of UCP1 from the BAT of WT and PRCPgt/gt animals. We found that UCP1 mRNA levels were statistically higher in PRCPgt/gt (1.86 ± 0.3; n = 4) than WT mice (1.02 ± 0.1; n = 4; P = 0.03) (Fig. 3D).
PRCP affects TRH gene expression in the PVN
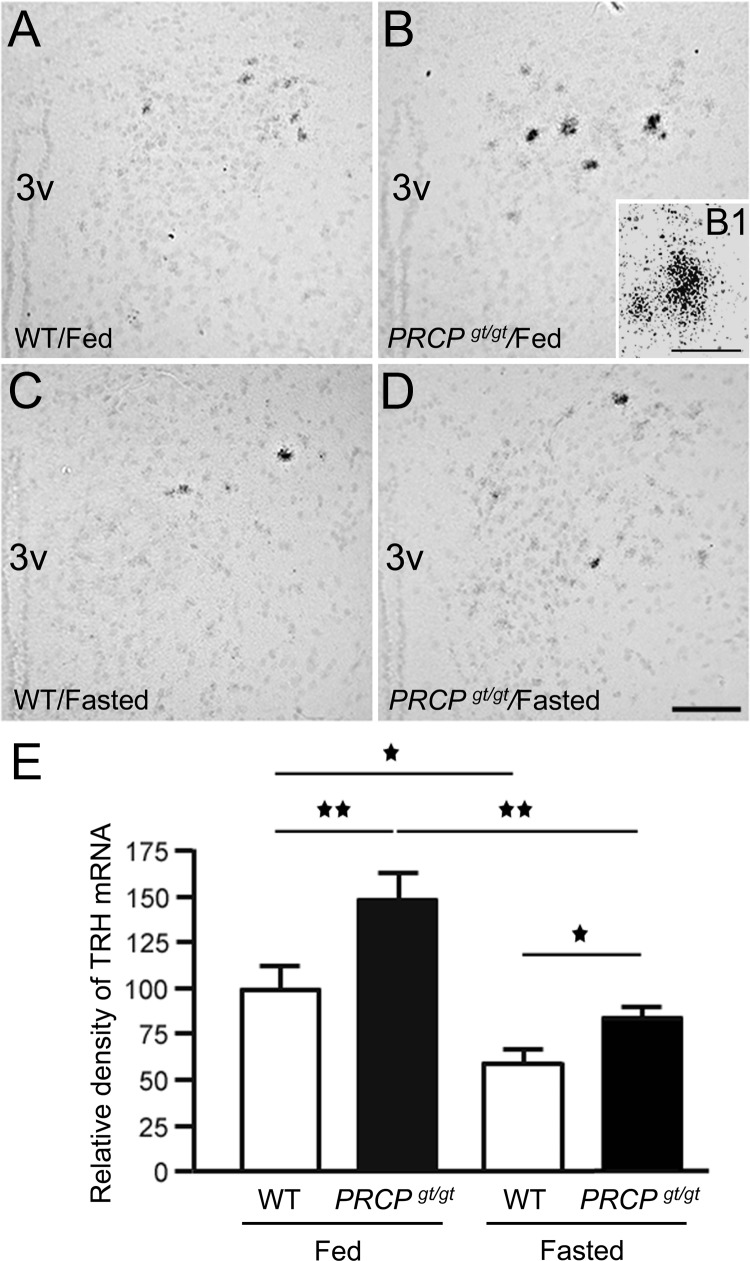
Because thyroid hormones levels are regulated by the HPT axis, we then analyzed the levels of TRH mRNA in the hypothalamus of fed and fasted WT and PRCPgt/gt mice by measuring the density of the silver grains after emulsion autoradiography in situ hybridization (Fig. 4, A–E). Overall, PVN TRH mRNA levels were higher in PRCPgt/gt mice than the WT regardless of the metabolic state. Density analysis revealed that fed PRCPgt/gt mice had greater TRH mRNA expression levels compared with the fed control mice (148.4 ± 14.2 in PRCPgt/gt and 100 ± 12.9 in WT, P < 0.01, n = 3 and 4, respectively) (Fig. 4E). As expected, fasting induced a decrease of TRH mRNA levels in both animal group (83.28 ± 4.1 for fasted PRCPgt/gt, P < 0.01 to fed PRCPgt/gt; 58.8 ± 5.8 for fasted WT, P = 0.028 to fed WT) (Fig. 4E). In addition, TRH mRNA levels in fasted PRCPgt/gt mice were significantly greater than those of fasted WT mice (P = 0.027) but not statistically different from those of fed WT (P = 0.26) (Fig. 4E).
Fig. 4.
Representative micrographs of PVN from WT and PRCPgt/gt mice fed on a regular chow diet (A and B, respectively) and overnight-fasted condition (C and D, respectively) showing the silver grains from radioactive in situ hybridization of TRH mRNA on Nissl-stained background. 3V, Third ventricle. B1, A high power micrograph of a PVN neuron of the fed PRCPgt/gt mouse showing silver grains labeling. E, Results from the analysis of the expression levels of TRH mRNA from each group. TRH mRNA expression levels were measured using ImageJ program and relative density of silver grains was compared between groups. *, P < 0.05; **, P < 0.01. Scale bars, 50 μm (A–D) and 10 μm (B1).
PRCP affect feeding after fasting
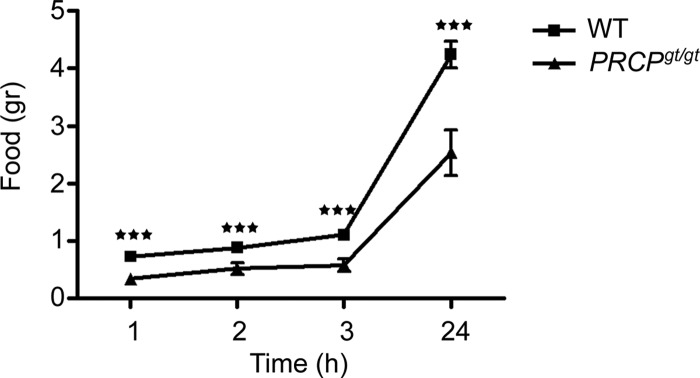
Analysis of food intake after an overnight fasting showed that PRCPgt/gt mice ate significantly less than fasted WT controls after 1 h (0.33 ± 0.09 g PRCPgt/gt vs. 0.73 ± 0.07 g WT), 2 h (0.51 ± 0.10 g PRCPgt/gt vs. 0.88 ± 0.09 g WT), 3 h (0.57 ± 0.11 g PRCPgt/gt vs. 1.10 ± 0.09 g WT) and 24 h (2.54 ± 0.40 g PRCPgt/gt vs. 4.24 ± 0.23 g WT) (Fig. 5).
Fig. 5.
Graph showing the results from food intake after overnight fasting. ***, P < 0.001.
PRCPgt/gt mice have impaired thyroid hormone negative feedback
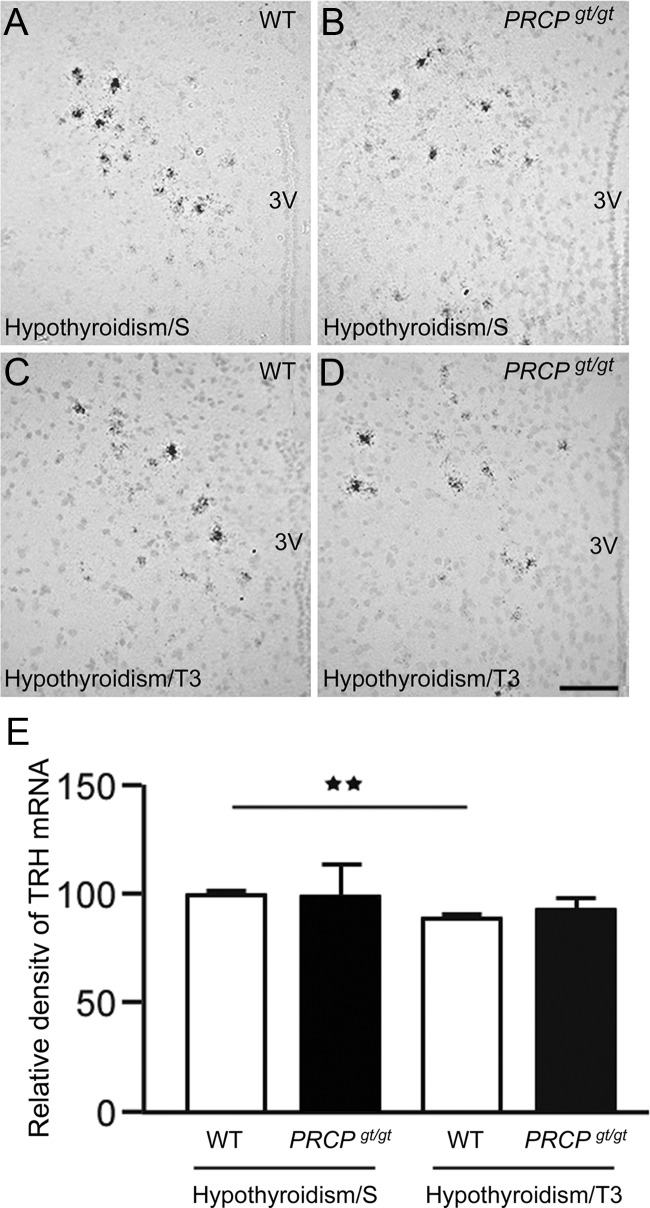
We found that TRH mRNA levels were significantly higher in fasted PRCPgt/gt mice compared with fasted controls. Interestingly, PRCPgt/gt mice also showed elevated levels of blood thyroid hormones, suggesting a possible impairment of the thyroid hormones negative feedback loop in this animal model. To test this hypothesis, we induced hypothyroidism in both WT and PRCPgt/gt mice by sc implantation of microosmotic pump filled with methimazole. After 1 wk, serum T4 levels were measured and found undetectable (data not shown). T3 treatment for 3 d was then performed and TRH mRNA expression in the PVN compared with those of saline-treated mice (Fig. 6). Hypothyroid WT and PRCPgt/gt mice had comparable levels of TRH mRNA (100 ± 1.3 in WT/saline and 99.3 ± 13.9 in PRCPgt/gt/saline). T3-treated WT mice showed a significant decrease of TRH mRNA levels (89.8 ± 1.4, P < 0.01) compared with WT controls. However, this was not the case for PRCPgt/gt mice, in which TRH mRNA levels were not statistically different from those of hypothyroid PRCPgt/gt mice treated with saline (92.8 ± 3.9 in PRCPgt/gt/T3, P = 0.67).
Fig. 6.
A–D, Representative photographs of PVN from hypothyroid WT and PRCPgt/gt mice treated either with saline (A and B, respectively) or T3 (C and D, respectively) showing the silver grains from radioactive in situ hybridization of TRH mRNA on Nissl-stained background. 3v, Third ventricle. E, Results from the analysis of the expression levels of TRH mRNA from each group. TRH mRNA expression levels were measured using ImageJ program, and relative density of silver grains was compared between groups. **, P < 0.01. Scale bar in D, 50 μm (for A–D).
Discussion
Our data show that animals with PRCP ablation have reduced body weight and adiposity and increased energy expenditure and BAT UCP1 mRNA levels. We have previously shown that PRCP plays an important role in the degradation of hypothalamic α-MSH (11), a critical regulator of energy expenditure, which functions in part by modulating the HPT axis. Thus, we measured thyroid hormones levels and found that PRCPgt/gt have elevated levels of free T4, although no significant changes in free T3 levels in fed condition were observed. The central component of the HPT axis is the TRH-expressing neural population in the PVN of the hypothalamus. By in situ hybridization, we found that TRH mRNA levels were significantly increased in the PVN of PRCPgt/gt compared with WT controls. However, when we analyzed TSH mRNA levels in the pituitary, no differences were found between WT and PRCPgt/gt mice in both fed and fasted conditions. Because thyroid hormones negatively regulate TRH neurons, this indicates an impairment of thyroid hormone feedback in PRCPgt/gt possibly due to elevated α-MSH levels. Similar to WT mice, when hypothyroid PRCPgt/gt mice were treated with T3, TRH mRNA levels in the PVN decreased. However, the levels of TRH mRNA in the T3-treated PRCPgt/gt mice were not statistically significant from those of hypothyroid PRCPgt/gt mice. In support of a possible role of increased α-MSH levels in the impairment of the thyroid feedback, refeeding after fasting showed a reduced food intake in PRCPgt/gt compared with WT mice.
It has been reported that arcuate α-MSH-expressing neurons project to the paraventricular TRH neurons and that this input onto TRH cells is excitatory in nature (5). Previous studies have also shown that during fasting, when circulating leptin and arcuate α-MSH mRNA levels are reduced, TRH mRNA levels are also decreased (4, 17, 18). Thus, two mechanisms of action have been hypothesized to explain the reduced TRH mRNA levels and peptide release in the median eminence: the direct effect of leptin on TRH neurons and the indirect effect via arcuate neurons. Consistent with the fact that PRCPgt/gt mice have higher α-MSH levels (11) and concomitantly lower circulating leptin levels compared with WT controls, it is conceivable that in PRCPgt/gt mice, the indirect pathway may dominate over the direct one. Supporting these data, during fasting, the level of TRH gene expression in PRCPgt/gt mice did not differ from that of fed WT controls, suggesting that α-MSH signaling itself is sufficient for the induction of TRH gene expression that appeared in normal-fed condition, independent of leptin level. Furthermore, food intake in PRCPgt/gt mice after an overnight fasting was significantly lower than that of fasted WT controls, suggesting the possibility that fasted PRCPgt/gt mice have higher hypothalamic levels of α-MSH than fasted WT animals.
Our results on the increased energy expenditure of PRCPgt/gt are in agreement with previous studies, in which elevated energy metabolism was observed in mice in which either α-MSH was genetically overexpressed (19) or in which AgRP was genetically ablated (20). As for these mice, our PRCPgt/gt animals did not show any difference in locomotor activity.
TRH cells in the PVN are a heterogeneous population of neurons. For example, most of the neuroendocrine TRH cells that project to median eminence are located in the medial portion of the PVN (6). However, TRH cells in the anterior- and posterior-PVN are not neuroendocrine, and their projection fields include hypothalamic and extrahypothalamic brain areas, including the brain stem, controlling behavior, locomotor activity, and thermogenesis (7). Thus, increased hypothalamic α-MSH levels (11) may affect energy expenditure via two mechanisms: by activating the HPT axis and by regulating the sympathetic output to the BAT (21) and the white adipose tissue (22). Furthermore, α-MSH may also act directly on adipocytes stimulating lipolysis, because melanocortin receptors have been found to be expressed in these cells (23). However, we have previously reported that although an increase in α-MSH levels was found in the hypothalamus of PRCPgt/gt mice compared with WT, no difference in the circulating levels of α-MSH were detected (11), thus suggesting that a direct effect of α-MSH on adipocytes may not be likely.
Finally, besides the known effect of PRCP on α-MSH (11), we cannot exclude the possibility that the phenotype observed in PRCPgt/gt mice is due to other substrates of PRCP. These include TRH peptide, which precursor has a proline as penultime amino acid at the carboxyl terminus (24). Thus, future studies will address this issue.
All together, our data support the role of PRCP in energy metabolism and point to PRCP as a potential pharmaceutical target against metabolic disorders, such as obesity and diabetes.
Acknowledgments
Present address for G.S.: Institute of Pathology, Liebermeisterstraße 8, University of Tübingen, D-72076 Tübingen, Germany.
This work was supported by National Institutes of Health Grant DK 084065 (to S.D.).
Disclosure Summary: The authors have nothing to disclose.
Footnotes
- BAT
- Brown adipose tissue
- HPT
- hypothalamo-pituitary-thyroid
- α-MSH
- α-melanocyte-stimulating hormone
- PRCP
- prolyl carboxypeptidase
- PVN
- paraventricular nucleus
- UCP1
- uncoupling protein 1
- WT
- wild type.
References
- 1. Schwartz MW, Woods SC, Porte D, Jr, Seeley RJ, Baskin DG. 2000. Central nervous system control of food intake. Nature 404:661–671 [DOI] [PubMed] [Google Scholar]
- 2. Plum L, Belgardt BF, Brüning JC. 2006. Central insulin action in energy and glucose homeostasis. J Clin Invest 116:1761–1766 [DOI] [PMC free article] [PubMed] [Google Scholar]
- 3. Hill JW, Williams KW, Ye C, Luo J, Balthasar N, Coppari R, Cowley MA, Cantley LC, Lowell BB, Elmquist JK. 2008. Acute effects of leptin require PI3K signaling in hypothalamic proopiomelanocortin neurons in mice. J Clin Invest 118:1796–1805 [DOI] [PMC free article] [PubMed] [Google Scholar]
- 4. Fekete C, Légrádi G, Mihály E, Huang QH, Tatro JB, Rand WM, Emerson CH, Lechan RM. 2000. α-Melanocyte-stimulating hormone is contained in nerve terminals innervating thyrotropin-releasing hormone-synthesizing neurons in the hypothalamic paraventricular nucleus and prevents fasting-induced suppression of prothyrotropin-releasing hormone gene expression. J Neurosci 20:1550–1558 [DOI] [PMC free article] [PubMed] [Google Scholar]
- 5. Mihály E, Fekete C, Tatro JB, Liposits Z, Stopa EG, Lechan RM. 2000. Hypophysiotropic thyrotropin-releasing hormone-synthesizing neurons in the human hypothalamus are innervated by neuropeptide Y, agouti-related protein, and α-melanocyte-stimulating hormone. J Clin Endocrinol Metab 85:2596–2603 [DOI] [PubMed] [Google Scholar]
- 6. Kádár A, Sánchez E, Wittmann G, Singru PS, Füzesi T, Marsili A, Larsen PR, Liposits Z, Lechan RM, Fekete C. 2010. Distribution of hypophysiotropic thyrotropin-releasing hormone (TRH)-synthesizing neurons in the hypothalamic paraventricular nucleus of the mouse. J Comp Neurol 518:3948–3961 [DOI] [PMC free article] [PubMed] [Google Scholar]
- 7. Wittmann G, Füzesi T, Singru PS, Liposits Z, Lechan RM, Fekete C. 2009. Efferent projections of thyrotropin-releasing hormone-synthesizing neurons residing in the anterior parvocellular subdivision of the hypothalamic paraventricular nucleus. J Comp Neurol 515:313–330 [DOI] [PMC free article] [PubMed] [Google Scholar]
- 8. Swanson LW, Sawchenko PE, Wiegand SJ, Price JL. 1980. Separate neurons in the paraventricular nucleus project to the median eminence and to the medulla or spinal cord. Brain Res 198:190–195 [DOI] [PubMed] [Google Scholar]
- 9. Swanson LW, Sawchenko PE. 1980. Paraventricular nucleus: a site for the integration of neuroendocrine and autonomic mechanisms. Neuroendocrinology 31:410–417 [DOI] [PubMed] [Google Scholar]
- 10. Ishikawa K, Taniguchi Y, Inoue K, Kurosumi K, Suzuki M. 1988. Immunocytochemical delineation of thyrotrophic area: origin of thyrotropin-releasing hormone in the median eminence. Neuroendocrinology 47:384–388 [DOI] [PubMed] [Google Scholar]
- 11. Wallingford N, Perroud B, Gao Q, Coppola A, Gyengesi E, Liu ZW, Gao XB, Diament A, Haus KA, Shariat-Madar Z, Mahdi F, Wardlaw SL, Schmaier AH, Warden CH, Diano S. 2009. Prolylcarboxypeptidase regulates food intake by inactivating α-MSH in rodents. J Clin Invest 119:2291–2303 [DOI] [PMC free article] [PubMed] [Google Scholar]
- 12. Coppola A, Hughes J, Esposito E, Schiavo L, Meli R, Diano S. 2005. Suppression of hypothalamic deiodinase type II activity blunts TRH mRNA decline during fasting. FEBS Lett 579:4654–4658 [DOI] [PubMed] [Google Scholar]
- 13. Jeong JK, Velho TA, Mello CV. 2005. Cloning and expression analysis of retinoic acid receptors in the zebra finch brain. J Comp Neurol 489:23–41 [DOI] [PubMed] [Google Scholar]
- 14. Trajkovic M, Visser TJ, Mittag J, Horn S, Lukas J, Darras VM, Raivich G, Bauer K, Heuer H. 2007. Abnormal thyroid hormone metabolism in mice lacking the monocarboxylate transporter 8. J Clin Invest 117:627–635 [DOI] [PMC free article] [PubMed] [Google Scholar]
- 15. Silva JE. 1995. Thyroid hormone control of thermogenesis and energy balance. Thyroid 5:481–492 [DOI] [PubMed] [Google Scholar]
- 16. Enerback S, Jacobsson A, Simpson EM, Guerra C, Yamashita H, Harper ME, Kozak LP. 1997. Mice lacking mitochondrial uncoupling protein are cold-sensitive but not obese. Nature 387:90–94 [DOI] [PubMed] [Google Scholar]
- 17. Légrádi G, Emerson CH, Ahima RS, Flier JS, Lechan RM. 1997. Leptin prevents fasting-induced suppression of prothyrotropin-releasing hormone messenger ribonucleic acid in neurons of the hypothalamic paraventricular nucleus. Endocrinology 138:2569–2576 [DOI] [PubMed] [Google Scholar]
- 18. Legradi G, Emerson CH, Ahima RS, Rand WM, Flier JS, Lechan RM. 1998. Arcuate nucleus ablation prevents fasting-induced suppression of ProTRH mRNA in the hypothalamic paraventricular nucleus. Neuroendocrinology 68:89–97 [DOI] [PubMed] [Google Scholar]
- 19. Lee M, Kim A, Chua SC, Jr, Obici S, Wardlaw SL. 2007. Transgenic MSH overexpression attenuates the metabolic effects of a high-fat diet. Am J Physiol Endocrinol Metab 293:E121–E131 [DOI] [PubMed] [Google Scholar]
- 20. Wortley KE, Anderson KD, Yasenchak J, Murphy A, Valenzuela D, Diano S, Yancopoulos GD, Wiegand SJ, Sleeman MW. 2005. Agouti-related protein-deficient mice display an age-related lean phenotype. Cell Metab 2:421–427 [DOI] [PubMed] [Google Scholar]
- 21. Dunbar JC, Lu H. 1999. Leptin-induced increase in sympathetic nervous and cardiovascular tone is mediated by proopiomelanocortin (POMC) products. Brain Res Bull 50:215–221 [DOI] [PubMed] [Google Scholar]
- 22. Song CK, Jackson RM, Harris RB, Richard D, Bartness TJ. 2005. Melanocortin-4 receptor mRNA is expressed in sympathetic nervous system of neurons to white adipose tissue. Am J Physiol Regul Integr Comp Physiol 289:1467–1476 [DOI] [PubMed] [Google Scholar]
- 23. Boston BA, Cone RD. 1996. Characterization of melanocortin receptor subtype expression in murine adipose tissues and in the 3T3-L1 cell line. Endocrinology 137:2043–2050 [DOI] [PubMed] [Google Scholar]
- 24. Nillni EA. 2007. Regulation of prohormone convertases in hypothalamic neurons: implications for prothyrotropin-releasing hormone and proopiomelanocortin. Endocrinology 148:4191–4200 [DOI] [PubMed] [Google Scholar]


