

Abstract
The quality of sensing and response to external stimuli constitutes a basic element in the selective performance of living organisms. Here we consider the response of Escherichia coli to chemical stimuli. For moderate amplitudes, the bacterial response to generic profiles of sensed chemicals is reconstructed from its response function to an impulse, which then controls the efficiency of bacterial motility. We introduce a method for measuring the impulse response function based on coupling microfluidic experiments and inference methods: The response function is inferred using Bayesian methods from the observed trajectories of bacteria swimming in microfluidically controlled chemical fields. The notable advantages are that the method is based on the bacterial swimming response, it is noninvasive, without any genetic and/or mechanical preparation, and assays the behavior of the whole flagella bundle. We exploit the inference method to measure responses to aspartate and α-methylaspartate—measured previously by other methods—as well as glucose, leucine, and serine. The response to the attractant glucose is shown to be biphasic and perfectly adapted, as for aspartate. The response to the attractant serine is shown to be biphasic yet imperfectly adapted, that is, the response function has a nonzero (positive) integral. The adaptation of the response to the repellent leucine is also imperfect, with the sign of the two phases inverted with respect to serine. The diversity in the bacterial population of the response function and its dependency upon the background concentration are quantified.
Keywords: bacterial chemotaxis, signal transduction, statistical inference
Bacterial chemotaxis constitutes a paradigmatic example of a molecular signaling pathway, transducing information from the external environment to the interior of the cell. The model organism Escherichia coli senses the environmental concentration of chemicals to regulate the rotation of flagellar motors and orient its motion (1). Counterclockwise (CCW) rotation of the flagella corresponds to runs in the trajectories, whereas bacteria tumble when the flagellar bundle is destabilized by one or several flagella rotating clockwise (CW). The second messenger in the chemotaxis pathway is the protein CheY: Its phosphorylated form, CheYp, binds the flagellar motors and increases the switching rate CCW→CW. Information on the chemical concentration sensed by the receptors is relayed via the kinase CheA, whose activity is reduced by receptors’ binding. Other components of the pathway include the scaffold protein CheW, the phosphatase CheZ, the methyltransferase CheR, and the methylesterase CheB, responsible for the feedback on the receptors and adaptation (see ref. 2 for a recent review). Additional features of the pathway are the clustering of receptors at the membrane (3), well-described by allosteric models (4–7), and the mutual interaction among receptors known as “assistance neighborhood” (8, 9).
An approach in the spirit of physiology, aimed at capturing the net effect of the molecular mechanisms just recalled, hinges on the input–output relationship (10). The idea is to assay the effect of controlled stimuli on bacterial behavior. In particular, the response to a short chemical impulse defines the so-called chemotaxis response function (or impulse response). The classical experimental method to implement this idea is the tethering assay (11): E. coli is pretreated chemically, genetically, or mechanically to be attached by a single flagellum to a glass slide, and the counterrotation of the bacterial body is visualized under the microscope. An alternative is the attachment of a bead to a flagellum to visualize its sense of rotation. The experimentally measured quantity is the fraction of time spent by the flagellum rotating CCW or CW (averaged over the population). Applications of the tethering assay include the classical measure of the chemotaxis response to aspartate (10, 12) and more recent work in refs. 13–15. An important result is that for a relatively wide range of perturbations, linear response theory applies (12). In other words, the response to complex stimuli is reconstructed by convolution of the stimulus with the response to an impulse and quasiequilibrium ideas are relevant (14). It is noteworthy that the response function shape is invariant for different levels of background concentrations (16–18). Previous points account for the importance of the response function, which motivated recent theoretical work on functional reasons for its observed shape (19–21).
Although the tethering assay was instrumental in achieving our present understanding of bacterial chemotaxis, it has limitations. First, preparation of the bacteria is a relatively long and stressful procedure, whose effect upon the response function is not quite under control. Second, as shown in ref. 22, the dynamics of the flagellar bundle does not simply reflect the behavior of individual flagella. Third, mechanical load affects the behavior of the bacterial flagellar switching (23). The previous points are exemplified by the observation that the fraction of CCW-to-CW rotation of a single flagellum (figure 1 in ref. 12) deviates substantially from the ratios of running and tumbling times in swimming bacteria (24). Finally, the strong noise in tethering assays usually requires averages over tens of bacteria. This raises the issue of single-bacterium behavior and the effect of averaging, especially in view of the diversity of running times (13, 25). It is of particular interest to identify those properties of the response function that feature strong diversity and those that do not.
The purpose of the present work is to introduce an alternative experimental method to measure the chemotaxis response function. The bottom line is the application of inference methods to extract from the observed trajectories of swimming bacteria the most likely response function. The notable advantage of the technique is its noninvasive nature: Bacteria are observed under the microscope while swimming, no pretreatment is required, and the bacterial behavior with the whole flagellar bundle is assayed. Furthermore, averaging over different individuals is less demanding than in tethering, and even single-bacterium responses are shown to be accessible. Finally, the simplicity and flexibility of the present approach make it an excellent tool to sample the responses of other bacteria and/or to other stimuli.
Here we use the technique to measure the wild-type response function to various chemoattractants (aspartate, α-methylaspartate, glucose, and serine) and to the chemorepellent leucine. As for aspartate and α-methylaspartate, the response function is confirmed to be perfectly adapted, that is, the areas of the positive and the negative parts of the response are equal. Similar properties are found here for glucose. Conversely, we found that the response to serine does have positive and negative parts, yet it is imperfectly adapted, the integral of the response function being positive. For leucine, the signs in the response function are reversed with respect to serine, and the response is not perfectly adapted either. The substantial diversity in the decay time (memory) of the response function is found to be comparable to that of running times (25). Fluctuations of the integral of the response function are much weaker, being almost absent in the adapted cases and limited in the imperfectly adapted cases. We also measured the dependency of the amplitude and the memory of the response function on the background concentration.
Results
Bayesian Methods Allow Inferring the Bacterial Chemotaxis Response.
Controlled chemical gradients were generated by the microfluidic setup shown in Fig. 1A. Hundreds of trajectories of bacteria swimming in those fields were tracked and segmented, as detailed in Materials and Methods, in running and tumbling intervals (Fig. 1 B–D). The result is a series of experimental points, recording, for each time interval on a given bacterial trajectory, the state of the bacterium (tumbling/running) and the corresponding concentration field. In a linear gradient, the latter is proportional to the coordinate along the gradient direction. The likelihood of the observed trajectories is calculated under the assumption of moderate variations of the chemicals (which is indeed the case here). Because the likelihood depends on the impulse response function, inference methods (26) can be used to extract it. In the experimental conditions we considered, three parameters {λ, α0, α1} were sufficient to describe the impulse response K(t) = e−λt (α0 − λα1t) (Materials and Methods). The independence of the results with respect to the parameterization is discussed below.
Fig. 1.

Bacterial tracks. (A) The chemotaxis setup was designed so as to obtain a stable concentration gradient of chemoattractant. The gradient is established through diffusion between two large reservoirs to obtain a stable equilibrium. The setup is obtained by superposing a glass slide, a thin (200-μm height) inox steel piece that separates the reservoirs by a channel 1-mm wide and 3-mm long, and a Plexiglas slide with filling holes. A photo of the resulting setup is shown. (B) Results of a 100-s data acquisition. Fifty-one different tracks, marked by different colors, are displayed. The attractant gradient is directed rightward. (C) From individual trajectories, the absolute instantaneous speed (red line, in μm/s) and the angular variation (green curve, in degrees per frame, vertically shifted by −80°/s for viewing purposes) are extracted. From this information, tumble phases are detected by threshold on both speed and turning angles, as described in Materials and Methods (blue line, arbitrary units, positive for tumbles, negative for runs). (D) Twenty seconds of a recorded trajectory are shown. Tumble phases are marked by filled red circles.
We first present the results for aspartate and α-methylaspartate, where tethering results are available (12). We extracted the response for individual trajectories whenever this was possible and grouped different trajectories when individual trajectories did not provide enough information for a reliable inference. The response functions for an ensemble of individual trajectories are shown in Fig. 2A. Responses are normalized to appreciate the diversity of the memory time 1/λ over the individuals in the bacterial population. Fig. 2B presents some of the same responses without normalization, to highlight the diversity of the response amplitude. Fig. 2C shows another set of normalized responses where groups of trajectories had to be pooled. Note that, even though the inference procedure is nonlinear upon addition of trajectories, the resulting curves have properties similar to those of typical response functions inferred from single trajectories. Fig. 2D shows the agreement between the result of tethering assays (12) and the curve computed (Materials and Methods) using a typical response function obtained by our inference procedure.
Fig. 2.

Inferring the chemotactic response. (A) The (normalized) chemotactic response functions to α-methylaspartate for an ensemble of E. coli individual trajectories as obtained by the inference method described here. Estimated parameters are the maximum likelihood of the posterior distribution (Materials and Methods). The colors encode the frequency of occurrence over the population of the corresponding decay time (low/high frequencies are in blue/red). (B) Some of the curves shown in A, now without normalization, are shown to highlight the diversity in the population of the response amplitude α0. The average chemoattractant concentration for the curves shown here is 754 μM. Same color coding as in A. (C) Response functions for groups of trajectories that had to be pooled to obtain a reliable estimate of the response. Notice that, despite the strong nonlinearity of the inference procedure with respect to the number of trajectories, the results are consistent with those shown in A for individual trajectories. (D) The inference results are consistent with the tethering bias response measured in ref. 12, as shown by direct comparison of the latter with a typical inferred bias response (Materials and Methods).
Values of the memory center around λ = 1.6 s−1, which, due to the linear term in the polynomial parameterization for K(t), correspond to the negative lobe decaying to zero around 4 s. Whereas the statistical error on the inference of λ for each response is small, the SD of λ over different individuals in the population is substantial, ∼1 s−1, and comparable to that observed for running times (25). Conversely, diversity in the ratio of the coefficients α0 and α1 is tiny (Fig. 3A). The consequence is that the integral of the response function is close to zero, that is, adaptation is a property of individual bacteria and not solely induced by population averaging.
Fig. 3.

Individual variability of response and uniformity of adaptation to α-methylaspartate (MeAsp). (A) Scatter plot of the coefficient α1 of the linear term in the response function versus the coefficient α0 of the constant term. The green line is the curve α1 = α0, that is, a perfectly adapted response. Black dots (in this and the following panels) correspond to groups of trajectories pooled together for the inference, whereas red dots refer to individual trajectories. (B) The nondimensional integral of the response function 1 − α1/α0 versus the mean attractant concentration. Error bars were obtained as described in Materials and Methods. The green line corresponds to perfect adaptation. (C) The amplitude of the response to MeAsp versus its concentration. The green curve is the scaling α0 ∝ 1/L that holds in the range of logarithmic (Weber–Fechner) response. (D) The dependence of the memory rate λ of the response function on ligand concentration. The constant green curve is the average value. The absence of any systematic trend corresponds to the shape invariance of the response with respect to the background ligand concentration.
The scaling with respect to the background concentration of the adaptation, amplitude, and memory of the response is shown in Fig. 3 B–D. By increasing the concentration in one reservoir of the microfluidic setup while keeping the other one empty, we generated a gradient proportional to the background level in the channel. The gradient of the logarithm is thus kept constant while the background concentration is varied. The observed scaling of the amplitude is compatible with α0 ∝ 1/L, where L is the chemoattractant background concentration, while the memory time is constant. These behaviors agree with Weber's law and fold-change detection (16–18) confirming that the response function's shape is independent of L. An alternative presentation of those properties in terms of sensitivity and adaptation precision is found in Figs. S1 and S2. Note that the observed scaling agrees with the prediction of molecular models in the range Koff ≪ L ≪ Kon, where Koff and Kon are the dissociation constants of the Tar receptor in its two possible states (SI).
We present now the responses to other chemicals. In Fig. 4A, we show the response to glucose of the strain MG1655. Glucose binds the methyl-accepting Trg chemoreceptor, but chemotaxis to glucose is also coupled to the phosphotransferase system (PTS), whose substrates are sensed during their uptake, with concomitant phosphorylation by phosphotransferase cellular components (27–29). Results in Fig. 4A demonstrate that the response again has a biphasic shape. Timescales are slightly longer but comparable to aspartate, and perfect adaptation is observed. Note that whereas adaptation of the Trg chemoreceptor can be explained via assistance neighborhood, we could not find in the literature specific information on the adaptation mechanisms of the PTS-mediated component. Fig. 4B shows that perfect adaptation is lost in the mutant where CheR and CheB are deleted.
Fig. 4.

Responses to glucose, leucine, and serine. The response functions to various chemicals are shown in black, whereas the curves corresponding to the SD error in the inference of the memory parameter λ are plotted in red. (A) The response functions for chemotaxis toward glucose of two different bacteria, chosen with rather different memory times to highlight their diversity. Adaptation is nearly perfect. (B) The response to glucose for the CheRCheB double mutant. Adaptation is lost. (C) An example of a response function to the repellent leucine. Note the inversion with respect to the attractant response. (D) One instance of response function for the chemotaxis toward serine. The response is imperfectly adapted as the value of its integral (represented by the green line) significantly differs from zero.
Fig. 4C shows the response to leucine of the strain HCB1 at concentrations on the order of 10–100 μM, when E. coli is repelled by the amino acid (e.g., 30). The response function is again biphasic, but phases have opposite signs compared with aspartate. As for serine (see below), the response is imperfectly adapted. Leucine has a toxic effect at these concentrations, and inferences were thus performed on a restricted subset of the initial population.
The response to serine, which binds the chemoreceptor Tsr, is shown in Fig. 4D. The response is biphasic, yet the negative and positive areas are different, that is, the response is imperfectly adapted. This agrees with ref. 24, where the running time versus the background concentration was measured for serine and aspartate: Whereas it was roughly constant for the latter, it varied substantially for the former. At the molecular level, loss of adaptation is due to the full methylation of receptors (see ref. 9 and the model in SI), but its functional cause remains an open problem. It should be stressed that bacteria effectively climb serine gradients in the microfluidic setup, despite their lack of adaptation. Previous examples of lack of perfect adaptation were obtained by tethering assays with chemotactic mutants, with some of the adaptation components missing (12) (Fig. 4B). Conversely, the response in Fig. 4D is wild-type, and demonstrates that a biphasic response is not necessarily perfectly adapted and that gradient climbing is not impaired by lack of adaptation. An overview of the diversity in the bacterial population of the adaptation is provided in Fig. 5.
Fig. 5.

Adaptation properties of the responses. The nondimensionalized value 1 − α1/α0 of the response integral is shown for various attractants and for the repellent leucine. In black, data for α-methylaspartate; in red, data for serine; in green, data for leucine; in cyan, data for glucose; and in blue, data for the response to glucose of the CheRCheB double mutant. Error bars were obtained as described in Materials and Methods. The constant black curve corresponds to perfect adaptation.
Likelihood, Estimation of Errors, and Effects of Parameterization.
The posterior distributions for the parameters of the response functions contain all of the information on the inference. When the prior distribution is flat, as assumed here, the posterior is simply proportional to the likelihood of the parameters, and maximum a posteriori and maximum likelihood (ML) estimators coincide. A large number of posterior distributions are well-concentrated around the maximum in all directions, as shown (Fig. S3). These display a nearly Gaussian shape. Therefore, the value of the ML complemented by the Hessian around the ML gives a complete description of both the inferred response and the error in its estimation (26). In some other cases, the likelihood still has a well-defined maximum, yet there is a “soft direction” where the curve is decreasing more slowly (Fig. S3). Intuition for such a direction is as follows. For an adapted response, the constant background is filtered out of the quantity [the convolution Q(t) in Materials and Methods] modulating the running time. It is easy to calculate that, for a perfectly straight trajectory in a concentration gradient, the convolution is proportional to the gradient and to the ratio α0/λ2. Trajectories are, of course, not quite straight, as a result of the curvature induced by rotational diffusivity and to the changes of direction after tumbles. However, these contributions are weak and/or require long trajectories to emerge, and the direction α0 ∝ λ2 is the most demanding to converge in the space of parameters. Possible improvements on this point are discussed in the final section. Even for those situations where the likelihood has a soft direction, we verified that (i) it becomes well-concentrated when more statistics are gathered, for example, by grouping a sufficient number of such trajectories, and (ii) numerical simulations (SI) indicate that the ML inference of parameters provides a reliable estimate of their real values within the SDs estimated by the Gaussian approximation around the ML. This is our rationale for using, in all situations, the ML Gaussian model for the inferences.
As discussed in Materials and Methods, molecular models of the chemotaxis pathway parameterize the impulse response as a sum of exponentials. However, that form is problematic for inference (e.g., 31), and orthogonal expansions (such as the Laguerre expansion we used) are handier. Here we briefly discuss this point. First, the response functions obtained by inference with the Laguerre expansion are well-reproduced when reexpressed as two exponentials,  (this is done by finding parameters for the sum of exponentials that minimize its distance to the inferred response function). Second, direct inference for the four parameters of the exponential parameterization shows that convergence is generally harder for exponential than for Laguerre parameterization, as was expected. The difficulty is somewhat tamed with respect to the general cases (31) because the decay rates are comparable but not too close (see below), yet exponentials are indeed more demanding. The advantage of the sum of exponentials is that molecular parameters are directly readable (SI). Namely, the dephosphorylation and methylation rates λy, λm for aspartate are λy = 1.83 ± 1.15 s−1 and λm = 1.34 ± 0.87 s−1 (average and SD over the bacterial population), remaining comparable throughout the range of concentrations sampled. In summary, results obtained by the two parameterizations agree, and conclusions drawn here, namely the presence/absence of adaptation and the amount of diversity, are independent of the specific form used.
Discussion
We have introduced and exploited an inference method to measure the chemotactic response of bacteria using just their trajectories observed under the microscope. The advantage of the technique is its noninvasive character that allows not dismantling the flagellar bundle. Classical tethering (12) and the responses obtained here for aspartate are in agreement (Fig. 2D). The property of perfect adaptation to aspartate, that is, the negative and positive parts of the response having equal areas, is confirmed. Furthermore, we have shown here that the diversity in the population of the integral of the response function is small, and perfect adaptation is observed even at the individual level. The decay times of the response (its memory) have substantial diversity, yet their typical values are compatible with that of tethering assays (12). The resulting estimation of the phosphorylation time is in close agreement with models and FRET measurements (32). Conversely, the methylation time is shorter than the value obtained from FRET measurements (33) by roughly a 10-fold factor, as already noted (34). The reason for this difference between FRET data and the combination of tethering and inference results is unknown. It is worth stressing that the agreement between the responses obtained by tethering and our inferences was not a priori granted. The effects of tethering preparation and the assay of a single flagellum are indeed not simple. In fact, as we show in SI, the bundle does have a strong effect on the sensitivity and amplitude of the response, yet the shape of the response function manifestly turns out to be similar.
We have obtained the response to serine and shown that it features both a positive and a negative part, yet their areas are different. This implies the absence of perfect adaptation, a property that was already observed in ref. 25 by measuring the running times in various constant levels of serine. We also observed that the absence of perfect adaptation does not prevent E. coli from climbing the concentration span over the channel. This is a counterexample to dynamic-range arguments advocating the necessity of perfect adaptation to avoid saturation of the ultrasensitive flagellar motor (35). An alternative explanation for adaptation based on the role of fluctuations in the chemical fields sensed by E. coli was recently proposed (21). Adaptation (Fig. S4) is there proposed to emerge as a result of the predictability of the environment. Quantitative experiments are needed to understand the functional reasons for the observed adaptation to aspartate and its absence to serine by gauging the environmental and dynamic-range contributions. The inference method proposed here appears to be a highly relevant tool for those studies because it can be applied to freely swimming bacteria without any major perturbation.
We conclude with possible future improvements of the experimental method described here. The constant-gradient microfluidic system we presented has the advantage that a constant gradient is easy to generate and keep stable and its profile in large enough setups is independent of chemoattractant diffusivity, which permits gauging the concentration. The downside is that, as discussed in the section on likelihoods, a profile more variable in space and time would possibly allow acquiring information on the response more rapidly. This would thus reduce the statistics needed for convergence and permit a reliable inference for an even larger number of individual trajectories. Another potential advantage of properly engineered variable gradients is that the total excursion in the amplitude of chemicals could be kept more limited across the field of observation. Indeed, because the background concentration affects the amplitude of the response (Fig. 3), the uncertainty in its estimation is increased. Keeping the total concentration excursion more tamed is therefore potentially beneficial. Variable-gradient profiles are clearly more delicate to control, yet recent progress in microfluidics makes them achievable, and this possibility then constitutes a significant experimental direction for future exploration.
Materials and Methods
Bacterial Strains and Preparation.
We used E. coli strain HCB1 for all of the experiments involving aspartate, α-methylaspartate, leucine, and serine, whereas E. coli strain MG1655 was used for glucose experiments. Experiments were realized using the protocols described in SI Materials and Methods. Mutants ΔCheZ, ΔCheR, and ΔCheRCheB of the MG1655 strain were produced using standard phage P1 transduction protocols.
Microfluidic Setup.
The setup (Fig. 1A and Fig. S5) was designed to obtain a stable chemical concentration gradient without any flow. The gradient is established through diffusion between two large reservoirs to reach equilibrium. The setup is built by superposing a glass slide, a thin (200-μm height) inox steel piece (STEEC) separating the reservoirs by a channel 1-mm wide and 3-mm long, and a Plexiglas slide with filling holes. The three pieces are insulated with vacuum grease. After sequential filling of the chambers, a stable gradient is established in about 2 h, consistently with diffusivities on the order of 100 μm2/s. The injection of a small volume (1 μL) of suspension slightly alters the gradient, which recovers in a few minutes, though, and then remains stable for about 4 h. Experimenting with attractants/repellents, bacteria were introduced into the low/high-concentration chamber and let swim up/down-gradient.
Determination of Chemical Concentration.
The concentration inside the channel was determined by measuring the stable profile of fluorescein (Sigma-Aldrich) added to the solution (Fig. S6). The large volume of the reservoirs ensures that the linear profile established at equilibrium is independent of the diffusivity. All images were acquired through a 10× objective (Plan-Neofluar 10×/0.3 Ph 1; Zeiss) on an inverted microscope (Observer D1; Zeiss) with a fast CCD camera (CoolSNAP HQ2; Roper Scientific). The field of view is 897 × 672 μm2. Images of swimming bacteria are collected in phase-contrast microscopy at a frequency of 10 Hz. A mercury-vapor lamp and a fluorescence cube (GFP-3035-B-000; Semrock) were used to excite the fluorescence, whose intensity was measured with an exposure time of 400 ms. A neutral density filter was placed on the optical path to limit fluorescein photobleaching.
Tracking Bacterial Trajectories.
Image analysis was performed with a plugin working with ImageJ software (National Institutes of Health). After subtracting the background, images were smoothed and a boundary detection algorithm was applied. Individual trajectories were obtained with a minimum distance association between consecutive frames. We deliberately kept low the density of bacteria to reduce distortions of the chemical profile and to prevent mismatched association in the tracking. Up to 100 bacteria were present in the field of view for acquisition times from 20 to 200 s, and the bacteria could disappear up to 10 frames and still be tracked. Tumbles were defined on the basis of joint changes in the speed and direction of motion, as detailed in SI Materials and Methods and shown in Fig. S7.
Definition of the Chemotaxis Response and Its Properties.
For moderate variations of the sensed chemical, the transition probability from the running to the tumbling state in a time interval dt reads  where the convolution
  modulates the probability according to the chemical concentration c(X(s),s) sensed by the bacterium at time s and location X(s) along its past trajectory. The kernel of the convolution is the so-called response function K (t − s), which describes the effect at time t > s of an impulse at time s.
Relationship of the Bias Response in Tethering Experiments.
In tethering assays, the observable is the fraction of bacteria whose tethered flagellum turns CCW, and the bias response indicates how the fraction is affected by an impulse stimulus (10, 12). The relationship between bias and the response K(t) defined above is obtained as follows (see details in SI Materials and Methods). The fractions pr(t) and pt(t) of bacteria in the running/tumbling state obey the equation  with the normalization pr + pt = 1. The running/tumbling times τ′r and τ′t are primed, as they refer to a single flagellum. For an impulse at the origin of moderate intensity I, it follows from the previous equation for pr(t) that the bias variation
 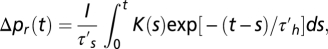 with
with  and the harmonic average
  Note that, because
  is short, the bias variation Δpr(t) and the response K(t) behave similarly, except at the origin, where the bias vanishes even if K does not. In particular, the decay time of the two functions is comparable. It is also checked that the integrals
  and
and  are proportional so that they both vanish or do not, that is, perfect adaptation can be determined by either one of them.
Bayesian Formulation of the Inference Problem.
Trajectories are sampled with a small time interval Δt, and the state of the bacterium (run or tumble) is assigned to each interval as detailed in SI Materials and Methods. The bacterial history of its states and of the chemical concentration sensed along the trajectory is thus represented by two vectors s and c having M = T/Δt components, T being the length of the trajectory. Using Bayes theorem, the posterior probability of the response K(t) reads 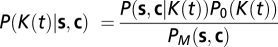 , where P(s, c | K(t)) is the likelihood, P0 is the prior distribution (assumed flat here), and PM is the normalizing constant. The likelihood reads
 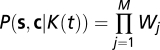 with the weights
  and
and  for running/tumbling intervals if preceded by a running interval, whereas Wj = 1/τt Δt and Wj = 1 − 1/τt Δt if preceded by a tumbling interval.
A standard Bayesian estimator is the maximum a posteriori, that is, the maximum value of the posterior distribution (26), which coincides with maximum likelihood for our case of flat prior. Our inference problem requires the search of the maximum in a multidimensional space. Optimization was performed using variable metric methods and a simplex algorithm combined with a conjugate gradient method. Results obtained by the two methods were consistent. Errors in the parameters were estimated by measuring the eigenvalues of the log-likelihood Hessian (Fig. S8). The whole inference procedure was successfully tested on synthetic trajectories generated according to molecular models of the chemotactic pathway (Fig. S9) with the parameters in Table S1.
Parameterization of the Response Function.
Models of the chemotaxis pathway (SI) give for K(t) a sum of exponentials 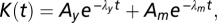 where λy and λm are the phosphorylation and methylation rates. However, fitting multiple exponentials can lead to ill-defined problems (e.g., 31), whereas coefficients of orthogonal functions tend to interact less during the optimization procedure and yield more reliable results. Therefore, we used the parameterization
  in terms of Laguerre orthogonal polynomials, that is, the basis orthogonal over the positive axis with an exponential weight.
Supplementary Material
Acknowledgments
We are grateful to F. Corson, J.-M. Ghigo, S. Letoffe, and T. S. Shimizu for helpful discussions. We thank J. Robert and A. Sekowska for their gift of the strains HCB1 and MG1655. The work was supported by C'Nano Ile de France, Centre National de la Recherche Scientifique “Prise de Risques,” Agence Nationale de la Recherche PiriBio, and the Fondation de France.
Footnotes
The authors declare no conflict of interest.
This article is a PNAS Direct Submission. N.S.W. is a guest editor invited by the Editorial Board.
This article contains supporting information online at www.pnas.org/lookup/suppl/doi:10.1073/pnas.1116772109/-/DCSupplemental.
References
- 1.Berg HC. E. coli in Motion. New York: Springer; 2003. [Google Scholar]
- 2.Vladimirov N, Sourjik V. Chemotaxis: How bacteria use memory. Biol Chem. 2009;390:1097–1104. doi: 10.1515/BC.2009.130. [DOI] [PubMed] [Google Scholar]
- 3.Greenfield D, et al. Self-organization of the Escherichia coli chemotaxis network imaged with super-resolution light microscopy. PLoS Biol. 2009;7:e1000137. doi: 10.1371/journal.pbio.1000137. [DOI] [PMC free article] [PubMed] [Google Scholar]
- 4.Bray D, Levin MD, Morton-Firth CJ. Receptor clustering as a cellular mechanism to control sensitivity. Nature. 1998;393(6680):85–88. doi: 10.1038/30018. [DOI] [PubMed] [Google Scholar]
- 5.Bray D, Duke TAJ. Conformational spread: The propagation of allosteric states in large multiprotein complexes. Annu Rev Biophys Biomol Struct. 2004;33:53–73. doi: 10.1146/annurev.biophys.33.110502.132703. [DOI] [PubMed] [Google Scholar]
- 6.Mello BA, Tu Y. An allosteric model for heterogeneous receptor complexes: Understanding bacterial chemotaxis responses to multiple stimuli. Proc Natl Acad Sci USA. 2005;102:17354–17359. doi: 10.1073/pnas.0506961102. [DOI] [PMC free article] [PubMed] [Google Scholar]
- 7.Keymer JE, Endres RG, Skoge M, Meir Y, Wingreen NS. Chemosensing in Escherichia coli: Two regimes of two-state receptors. Proc Natl Acad Sci USA. 2006;103:1786–1791. doi: 10.1073/pnas.0507438103. [DOI] [PMC free article] [PubMed] [Google Scholar]
- 8.Li M, Hazelbauer GL. Adaptational assistance in clusters of bacterial chemoreceptors. Mol Microbiol. 2005;56:1617–1626. doi: 10.1111/j.1365-2958.2005.04641.x. [DOI] [PubMed] [Google Scholar]
- 9.Hansen CH, Endres RG, Wingreen NS. Chemotaxis in Escherichia coli: A molecular model for robust precise adaptation. PLoS Comput Biol. 2008;4:e1. doi: 10.1371/journal.pcbi.0040001. [DOI] [PMC free article] [PubMed] [Google Scholar]
- 10.Block SM, Segall JE, Berg HC. Impulse responses in bacterial chemotaxis. Cell. 1982;31:215–226. doi: 10.1016/0092-8674(82)90421-4. [DOI] [PubMed] [Google Scholar]
- 11.Silverman M, Simon M. Flagellar rotation and the mechanism of bacterial motility. Nature. 1974;249(452):73–74. doi: 10.1038/249073a0. [DOI] [PubMed] [Google Scholar]
- 12.Segall JE, Block SM, Berg HC. Temporal comparisons in bacterial chemotaxis. Proc Natl Acad Sci USA. 1986;83:8987–8991. doi: 10.1073/pnas.83.23.8987. [DOI] [PMC free article] [PubMed] [Google Scholar]
- 13.Korobkova E, Emonet T, Vilar JMG, Shimizu TS, Cluzel P. From molecular noise to behavioural variability in a single bacterium. Nature. 2004;428:574–578. doi: 10.1038/nature02404. [DOI] [PubMed] [Google Scholar]
- 14.Park H, et al. Interdependence of behavioural variability and response to small stimuli in bacteria. Nature. 2010;468:819–823. doi: 10.1038/nature09551. [DOI] [PMC free article] [PubMed] [Google Scholar]
- 15.Paster E, Ryu WS. The thermal impulse response of Escherichia coli. Proc Natl Acad Sci USA. 2008;105:5373–5377. doi: 10.1073/pnas.0709903105. [DOI] [PMC free article] [PubMed] [Google Scholar]
- 16.Shoval O, et al. Fold-change detection and scalar symmetry of sensory input fields. Proc Natl Acad Sci USA. 2010;107:15995–16000. doi: 10.1073/pnas.1002352107. [DOI] [PMC free article] [PubMed] [Google Scholar]
- 17.Celani A, Shimizu TS, Vergassola M. Molecular and functional aspects of bacterial chemotaxis. J Stat Phys. 2011;144:219–240. [Google Scholar]
- 18.Lazova MD, Ahmed T, Bellomo D, Stocker R, Shimizu TS. Response rescaling in bacterial chemotaxis. Proc Natl Acad Sci USA. 2011;108:13870–13875. doi: 10.1073/pnas.1108608108. [DOI] [PMC free article] [PubMed] [Google Scholar]
- 19.de Gennes PG. Chemotaxis: The role of internal delays. Eur Biophys J. 2004;33:691–693. doi: 10.1007/s00249-004-0426-z. [DOI] [PubMed] [Google Scholar]
- 20.Clark DA, Grant LC. The bacterial chemotactic response reflects a compromise between transient and steady-state behavior. Proc Natl Acad Sci USA. 2005;102:9150–9155. doi: 10.1073/pnas.0407659102. [DOI] [PMC free article] [PubMed] [Google Scholar]
- 21.Celani A, Vergassola M. Bacterial strategies for chemotaxis response. Proc Natl Acad Sci USA. 2010;107:1391–1396. doi: 10.1073/pnas.0909673107. [DOI] [PMC free article] [PubMed] [Google Scholar]
- 22.Turner L, Ryu WS, Berg HC. Real-time imaging of fluorescent flagellar filaments. J Bacteriol. 2000;182:2793–2801. doi: 10.1128/jb.182.10.2793-2801.2000. [DOI] [PMC free article] [PubMed] [Google Scholar]
- 23.Fahrner KA, Ryu WS, Berg HC. Biomechanics: Bacterial flagellar switching under load. Nature. 2003;423:938. doi: 10.1038/423938a. [DOI] [PubMed] [Google Scholar]
- 24.Berg HC, Brown DA. Chemotaxis in Escherichia coli analysed by three-dimensional tracking. Nature. 1972;239:500–504. doi: 10.1038/239500a0. [DOI] [PubMed] [Google Scholar]
- 25.Spudich JL, Koshland DE., Jr Non-genetic individuality: Chance in the single cell. Nature. 1976;262:467–471. doi: 10.1038/262467a0. [DOI] [PubMed] [Google Scholar]
- 26.MacKay D. Information Theory, Inference, and Learning Algorithms. Cambridge, UK: Cambridge Univ Press; 2003. [Google Scholar]
- 27.Adler J, Hazelbauer GL, Dahl MM. Chemotaxis toward sugars in Escherichia coli. J Bacteriol. 1973;115:824–847. doi: 10.1128/jb.115.3.824-847.1973. [DOI] [PMC free article] [PubMed] [Google Scholar]
- 28.Adler J, Epstein W. Phosphotransferase-system enzymes as chemoreceptors for certain sugars in Escherichia coli chemotaxis. Proc Natl Acad Sci USA. 1974;71:2895–2899. doi: 10.1073/pnas.71.7.2895. [DOI] [PMC free article] [PubMed] [Google Scholar]
- 29.Lux R, et al. Elucidation of a PTS-carbohydrate chemotactic signal pathway in Escherichia coli using a time-resolved behavioral assay. Mol Biol Cell. 1999;10:1133–1146. doi: 10.1091/mbc.10.4.1133. [DOI] [PMC free article] [PubMed] [Google Scholar]
- 30.Barak R, Eisenbach M. Acetylation of the response regulator, CheY, is involved in bacterial chemotaxis. Mol Microbiol. 2001;40:731–743. doi: 10.1046/j.1365-2958.2001.02425.x. [DOI] [PubMed] [Google Scholar]
- 31.Waterfall JJ, et al. Sloppy-model universality class and the Vandermonde matrix. Phys Rev Lett. 2006;97:150601. doi: 10.1103/PhysRevLett.97.150601. [DOI] [PubMed] [Google Scholar]
- 32.Tu Y, Shimizu TS, Berg HC. Modeling the chemotactic response of Escherichia coli to time-varying stimuli. Proc Natl Acad Sci USA. 2008;105:14855–14860. doi: 10.1073/pnas.0807569105. [DOI] [PMC free article] [PubMed] [Google Scholar]
- 33.Shimizu TS, Tu Y, Berg HC. A modular gradient-sensing network for chemotaxis in Escherichia coli revealed by responses to time-varying stimuli. Mol Syst Biol. 2010;6:382. doi: 10.1038/msb.2010.37. [DOI] [PMC free article] [PubMed] [Google Scholar]
- 34.Clausznitzer D, Endres RG. Noise characteristics of the Escherichia coli rotary motor. BMC Syst Biol. 2011;5:151. doi: 10.1186/1752-0509-5-151. [DOI] [PMC free article] [PubMed] [Google Scholar]
- 35.Cluzel P, Surette MG, Leibler S. An ultrasensitive bacterial motor revealed by monitoring signaling proteins in single cells. Science. 2000;287:1652–1655. doi: 10.1126/science.287.5458.1652. [DOI] [PubMed] [Google Scholar]
Associated Data
This section collects any data citations, data availability statements, or supplementary materials included in this article.