Abstract
Motivation: A plethora of bioinformatics analysis has led to the discovery of numerous gene sets, which can be interpreted as discrete measurements emitted from latent signaling pathways. Their potential to infer signaling pathway structures, however, has not been sufficiently exploited. Existing methods accommodating discrete data do not explicitly consider signal cascading mechanisms that characterize a signaling pathway. Novel computational methods are thus needed to fully utilize gene sets and broaden the scope from focusing only on pairwise interactions to the more general cascading events in the inference of signaling pathway structures.
Results: We propose a gene set based simulated annealing (SA) algorithm for the reconstruction of signaling pathway structures. A signaling pathway structure is a directed graph containing up to a few hundred nodes and many overlapping signal cascades, where each cascade represents a chain of molecular interactions from the cell surface to the nucleus. Gene sets in our context refer to discrete sets of genes participating in signal cascades, the basic building blocks of a signaling pathway, with no prior information about gene orderings in the cascades. From a compendium of gene sets related to a pathway, SA aims to search for signal cascades that characterize the optimal signaling pathway structure. In the search process, the extent of overlap among signal cascades is used to measure the optimality of a structure. Throughout, we treat gene sets as random samples from a first-order Markov chain model. We evaluated the performance of SA in three case studies. In the first study conducted on 83 KEGG pathways, SA demonstrated a significantly better performance than Bayesian network methods. Since both SA and Bayesian network methods accommodate discrete data, use a ‘search and score’ network learning strategy and output a directed network, they can be compared in terms of performance and computational time. In the second study, we compared SA and Bayesian network methods using four benchmark datasets from DREAM. In our final study, we showcased two context-specific signaling pathways activated in breast cancer.
Availibility: Source codes are available from http://dl.dropbox.com/u/16000775/sa_sc.zip
Contact: dzhu@wayne.edu
Supplementary information: Supplementary data are available at Bioinformatics online.
1 INTRODUCTION
The main goal of computational systems biology is to reveal and explain general organizing principles of living systems. In particular, the structural inference of signaling pathways is important to better understand fundamental cell functions such as growth, metabolism, differentiation and apoptosis, which are driven by simultaneous action of several cascades of reactions from the cell surface to the nucleus (Alberts et al., 2002). Since signaling cascades represent the basic building blocks of signaling pathways, it is necessary to extract useful insights about them from various molecular profiling data. In recent years, gene set compendiums and tools for their analysis have become increasingly available due to rapid advancements in high-throughput data acquisition methods (e.g. Subramanian et al., 2005; Tian et al., 2005; Medina et al., 2009; Glabb et al., 2010; Park et al., 2010). However, challenges remain in exploring signal cascading mechanisms from such data, which can be interpreted as discrete measurements emitted from latent signaling pathway structures.
Many algorithms for biological network inference accommodate discrete inputs (e.g. Altay and Emmert-Streib, 2010a). Discretization has especially proved useful in the structural inference of signaling pathways, which are directed networks containing up to a few hundred nodes and several overlapping signal cascades where each cascade represents a directed or ordered chain of molecular interactions. For example, existing non-metabolic pathway structures in the KEGG database (Kanehisa et al., 2010) contain up to 400 nodes. Significant efforts in the inference of signaling pathway structures include Boolean or Probabilistic Boolean networks (e.g. Shmulevich et al., 2002; Kaderali et al., 2009) and Bayesian networks (e.g. Frideman et al., 2000; Segal et al., 2003), which directly benefit from reduced computational complexity by utilizing discrete inputs. Even in the inference of large-scale undirected network topologies using ARACNE (Margolin et al., 2006), C3NET (Altay and Emmert-Streib, 2010b), CLR (Faith et al., 2007), MRNET (Meyer et al., 2007) and Relevance Networks or RNs (Butte and Kohane, 2000), discrete measurements are employed to estimate mutual information (MI) between gene pairs. Therefore, it is increasingly clear that discrete measurements hold promises for inferring biological networks.
Bayesian network methods are commonly used in the inference of signaling pathway structures. However, these methods primarily focus on statistical causal interactions. Thus, the learned networks need not represent signal cascading mechanisms. How to better use discrete measurements available in the form of unordered gene sets, which may be thought of as the observed overlapping and incomplete signal cascading events, remains an open area of research. A few attempts made toward the inference of communication networks from co-occurrence data find applications in biomedical field (e.g. Rabbat et al., 2008), but significant advantages of inferring signaling pathway structures from gene sets are yet to be demonstrated.
We attempt to overcome the issues raised above by presenting a novel computational approach for inferring the optimal signaling pathway structure from partially observed and overlapping gene sets related to a pathway. Identification of pathways from molecular profiling data is a relatively well-studied problem and has been explored in the literature (Xu et al., 2010). However, issues still remain in reconstructing signal cascading mechanisms in the pathways of interest. In our study, we specifically focus on this problem. Our motivation stems from considering a signaling pathway structure as an ensemble of overlapping and linear signaling cascades, which we refer to as information flows (IFs). In other words, the true signaling pathway structure can be constructed by assembling the IFs into a single unit. As a gene may simultaneously participate in multiple IFs, the extent of overlap among IFs is an integral part of the construction. The set of all genes in an IF, with no information about the order in which they appear in the IF, is called an information flow gene set (IFGS) (Acharya et al., 2011). We observe partial or complete IFGSs but not the order in which their component genes appear in the corresponding IFs. We propose to explore the overlapping information among IFGSs in order to infer underlying IFs, which in turn define the signaling pathway structure.
As there exist L! different gene orderings for an IFGS with L component genes, a total of L!m signaling pathway structures can be constructed by combining m such IFGSs. An exhaustive search for the true structure among L!m candidate structures may be computationally intractable, even when the values of m and L are controlled. To address this issue, we translate our goal of signaling pathway structure inference from IFGSs into a discrete optimization problem. We then propose a simulated annealing (SA) algorithm to locate the optimal signaling pathway structure. SA (Kirkpatrick et al., 1983) is a well-known search algorithm for solving global optimization problems. SA finds its root in the field of metallurgy, where a metal is heated and then cooled down slowly so that the atoms gradually configure themselves in states of lower internal energy, refining the crystalline structure of the metal. Compared with other global search algorithms such as genetic algorithm (Holland, 1992) and tabu search (Glover, 1989), SA is easier to understand and to implement without sacrificing performance. Since genetic algorithm is a population-based search method and tabu search is a memory-based heuristic, each iteration of SA runs faster than the two approaches. SA also requires a small number of user-specified parameters. In the past, SA has inspired various bioinformatics researches (e.g. Baker, 2004; Gonzalez et al., 2007; Chen et al., 2010).
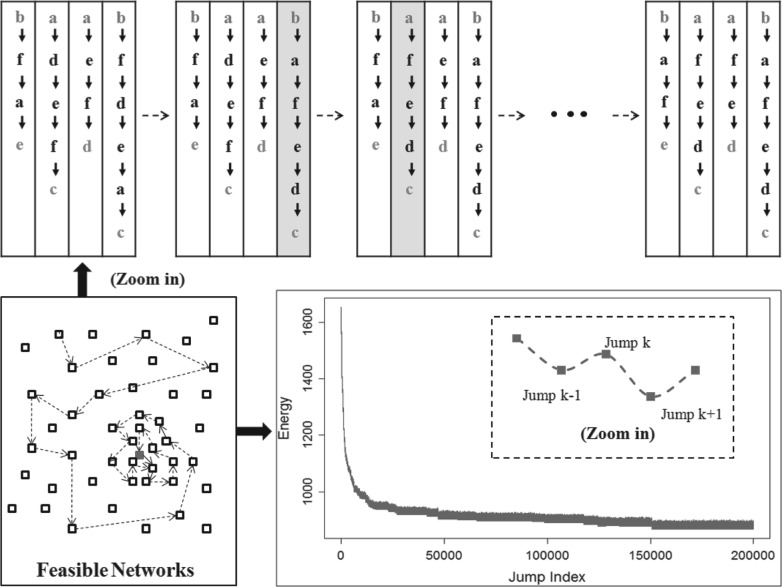
We develop a new gene set-based SA to infer signaling cascades that characterize the optimal signaling pathway structure. Throughout we treat IFGSs as variables and their orders as random. We also introduce a novel score function to measure the optimality, referred to as energy, of a candidate signaling pathway structure. Annealing refers to taking educated jumps in a feasible set of signaling pathway structures, where the true structure has the lowest energy. In the search process, the algorithm may jump to a neighboring structure with lower energy, resulting in a better move, or may accept to jump to a structure possessing higher energy in order to avoid getting trapped in a local minimum. Initially, when the temperature is high, the algorithm actively explores the feasible set. As cooling takes place, it spends more time around the global minimum. At any time instant, the algorithm only needs to keep track of the best-so-far structure. Figure 1 presents the work flow of the proposed approach.
Fig. 1.
SA begins with a randomly chosen signaling pathway structure in the feasible set. It explores the feasible set in order to locate the structure with the minimum energy (the true signaling pathway structure). The feasible set is composed of of signaling pathway structures with the same degree distribution as the true signaling pathway.
We evaluated the performance of SA in three different case studies. The first study was conducted on 83 gene set compendiums derived from the KEGG database, where SA demonstrated a significantly better performance in recovering the true signaling mechanisms than Bayesian network methods. Since both SA and Bayesian network methods accommodate discrete inputs, use a ‘search and score’ network learning strategy and output a directed network, they can be compared in terms of performance and computational time. Non-search-based approaches, e.g. MI-based gene regulatory network inference methods, are computationally more efficient than search algorithms and can be used to infer large-scale networks with thousands of genes. However, these approaches are suitable for inferring undirected pairwise dependencies. Thus, only the comparison between SA and Bayesian network methods is relevant to the present context. In the second study, we compared the performance of SA and Bayesian network methods using four benchmark Escherichia coli datasets available from the DREAM initiative. In the final study, we inferred two context-specific signaling pathway structures activated in breast cancer.
2 METHODS
2.1 Reconstruction of signaling pathway structures as a discrete optimization problem
Throughout we denote an IFGS (unordered gene set) by Xi and an IF (ordered gene set) by (Xi, Θi), where Θi represents an ordering of genes (nodes) in Xi, i=1,…, m. Notations  and
and  are used for an IFGS compendium and a signaling pathway structure, respectively, where
  and
and  . A signaling pathway structure
  is constructed by combining the IFs (Xi, Θi) into a single unit. The length of an IFGS Xi is the number of genes present in it and is denoted by Li. As there exist Li! different gene orderings for Xi, a total of ∏i=1mLi! distinct structures can be constructed from
  . We formulate the reconstruction of true signaling pathway structure as a discrete optimization problem
| (1) |
where  stands for the energy of the signaling pathway
  and
and  , called the feasible set, represents the set of candidate structures corresponding to the IFGS compendium
  . The true signaling pathway can be inferred by (i) defining the energy
  , (ii) defining the feasible set
  of candidate signaling pathway structures such that the true structure has the lowest energy among the candidates and (iii) searching for the true signaling pathway structure in
  .
.
2.2 Energy of a signaling pathway structure
We propose a novel function to score a candidate signaling pathway structure by treating IFGSs as random samples from a first-order Markov chain model. The score of a signaling pathway structure  is interpreted as its energy and is defined as
| (2) |
where ℓ(Xi, Θi) stands for the likelihood of IF (Xi, Θi). Indeed, we compute the likelihood of  as
as
| (3) |
Since log function is monotonically increasing, searching for a structure with the maximum likelihood is equivalent to seeking a structure with the minimum energy. Each likelihood term ℓ(Xi, Θi) is computed using the estimates of two Markov chain parameters, the initial probability vector π0 and the transition probability matrix Π. If there are n distinct genes across the IFs (Xi, Θi), i=1,…, m, we estimate π0 as
| (4) |
where cl is the total number of times l-th gene appears as the first node among m IFs, for l=1,…, n. If crs is the total number of occurrences of a directed edge from r-th gene to s-th gene among m IFs, then
| (5) |
where prs=crs/∑s=1n crs, r, s=1,…, n. Note that Π captures the overlapping information among IFs. The likelihood of an IF, say x→y→z, can now be computed as
| (6) |
where prior and conditional probability terms in the above equation are known from π0 and Π. The energy of a structure  can now be computed using Equation (2).
2.3 Feasible signaling pathway structures
Not all ∏i=1m
Li! signaling pathway structures, which can be constructed from  , exhibit the topological properties of real-world biological networks. To eliminate random structures from the search space, we only consider candidates, which possess certain low-level topological properties such as the degree distribution of underlying structure. The degree distribution of underlying signaling pathway structure, say
  , is a weighted asymmetric adjacency matrix W obtained by counting the number of occurrences of directed edges between all gene pairs among m IFs (Xi, Θi), i=1,…, m. Note that except for the pair of terminal nodes, the incoming and outgoing degrees of all intermediate nodes in an IF is 1. Since we consider
  as a set of information flows, it can be easily verified that structures obtained by randomly permuting the orders of intermediate nodes in each IF (Xi, Θi), i=1,…, m, also have degree distribution W. Such structures preserve the marginal degree distributions of genes and form the feasible set
  of size ∏i=1m (Li−2)!. In simulation studies, W can be obtained from the true signaling cascades. In real-world studies, it can be approximated by using database knowledge.
2.4 Justification of the energy function
We design and perform an empirical statistical test to show that the true signaling pathway structure has the lowest energy in the feasible set. Given the true signaling pathway structure  , we randomly select N feasible structures and compute the empirical P-value M/N, where M is the number of structures with energy lower than that of
  . The true signaling pathway structure has the lowest energy if the empirical P-value is zero. We also perform the above test for a randomly selected feasible structure and expect the empirical P-value to vary in the interval [0 1].
2.5 Search of the optimal signaling pathway structure
For the search procedure, we define the neighborhood of a signaling pathway structure  as the set of ∑i=1m (Li−2)! structures obtained by randomly permuting the orders of Li−2 intermediate genes in the i-th IF (Xi, Θi), keeping the remaining m−1 IFs in
  fixed, for each i=1,…, m. This definition justifies the term ‘neighbor’ as only one IF in the given structure is perturbed at a time. Moreover, if we start our search from a feasible structure, the algorithm is guaranteed to take jumps within the feasible set of candidate structures having the same degree distribution as the true signaling pathway. The above definition also satisfies all the properties of a neighborhood presented in Goldstein and Waterman (1988). We choose the standard cooling schedule, which at the k-th stage is defined as
| (7) |
where c>0 is constant and is referred to as cooling schedule constant. The choice of c is often problem specific. Indeed, a small value of c may lead SA to get trapped in a local solution, whereas a large value may slow down its speed of convergence. The above cooling schedule has been used to study the convergence properties of a general simulated annealing approach (Hajek, 1988). The probability with which the algorithm accepts a move from a current structure  to a neighboring structure
  is called the acceptance probability (Chong and Żak, 2008) and is defined as
| (8) |
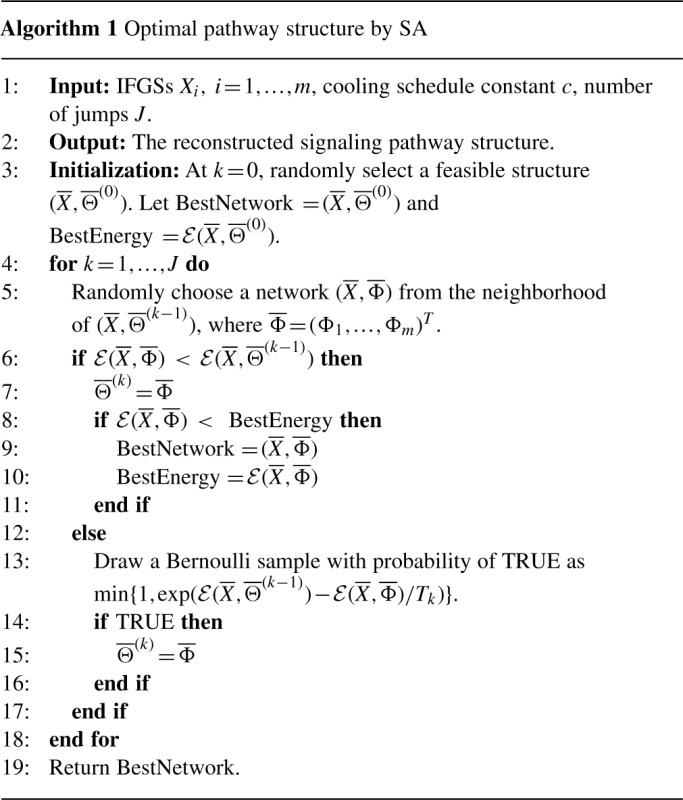
where T represents the current temperature value, which at the k-th iteration is given by Equation (7). Note that the algorithm may accept to move to a worse point in order to avoid getting trapped in a local solution. In Algorithm 1, we present the pseudo-code of SA. Algorithm 1 takes an IFGS compendium as input and returns a list of IFs, which are combined to represent the optimal signaling pathway structure.
2.6 Computational complexity
The worst-case running time of SA is O(JmL), where J is the number of jumps, m is the number of IFGSs and L is the maximum length of an IFGS in the given compendium. We refer to Section 3 in the Supplementary Material for a detailed discussion on the computational complexity of SA. Overall, SA benefits from a manageable computational load compared with similar search heuristics such as sampling-based Meteropolis–Hastings algorithm used in the inference of Bayesian networks. We reemphasize that SA and Bayesian network methods are similar in terms of input, output and network learning strategy. In the inference of Bayesian networks, discrete data are commonly used for a manageable computational complexity. Thus, SA and Bayesian network methods take the same type of input. Both SA and Bayesian network methods share a ‘search and score’ strategy for learning multivariate dependencies. Also, both SA and Bayesian network methods output a directed network. The preceding factors make SA and Bayesian network methods (i) suitable for inferring signaling pathway structures, which are directed networks containing up to a few hundred nodes and (ii) comparable in terms of performance and computational time. Other non-search-based approaches, such as MI-based methods, are computationally more efficient than search methods and can be used for reconstructing gene regulatory networks with thousands of nodes. However, they are suitable for inferring undirected pairwise similarities. Therefore, only the comparison between SA and Bayesian network methods is relevant to the present study.
3 RESULTS
3.1 Case Study I: proof of principle
3.1.1 Description of the datasets
In this study, we evaluate the performance of SA in inferring the true signaling mechanisms, when gene sets are sampled from the true signaling pathway structure. As the input for SA is an IFGS compendium, we first developed a path sampling algorithm (see Section 1 in Supplementary Material) to sample a collection of true IFs from a known pathway structure. The loss of gene ordering information in IFs was simulated by randomly relocating intermediate genes within each IF, keeping the pair of terminal nodes fixed. We used this algorithm on each of the 120 non-metabolic pathways in the KEGG database (Kanehisa et al., 2010) to derive 120 IFGS compendiums. From each compendium, we removed IFGSs of lengths 2 and 3 as they represented true edges and true IFs, respectively. Among the resulting compendiums, we only considered the ones containing a minimum of five IFGSs to allow overlapping among gene sets. The above procedure resulted in 83 non-empty IFGS compendiums composing of under-sampled IFGSs. Since each compendium was derived from a specific KEGG pathway structure, IFGSs in a given compendium shared the same pathway membership. In the derived compendiums, the number and lengths of IFGSs varied in the ranges of 5–723 and 4–13, respectively. We applied SA on each compendium individually to infer the true signaling cascades, i.e. the ones present in the original KEGG pathways. If there are m gene sets with n distinct genes in an IFGS compendium, then the input for SA can be given as an m×n matrix. If there are k genes in the i-th gene set, then the first k locations in the i-th row contain non-zero indices representing these genes, and the remaining n−k locations are set to 0. SA only considers non-zero indices in each row, i.e. genes present in a gene set. The IFs inferred by SA are assembled to reconstruct the signaling pathway structure. We compare the inferred structure with the one constructed from the true IFs.
3.1.2 Description of Bayesian network methods
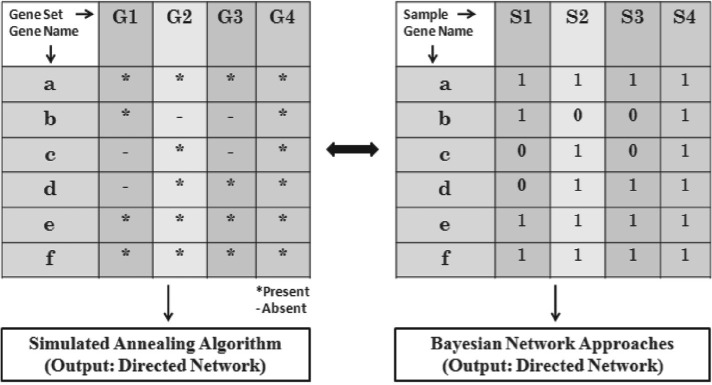
First, we note that a gene set compendium can be written as a matrix of binary discrete values (Fig. 2). A gene set can be naturally interpreted as a set of genes expressed in an experiment and thus corresponds to a vector (sample) of binary values obtained by considering the presence (1) or absence (0) of genes in the gene set. We only consider genes belonging to the given IFGS compendium. For example, if there are m gene sets with n distinct genes in a compendium, then the binary discrete data is an m×n matrix. If there are k genes in the i-th gene set, then the corresponding k locations in the i-th row of data are set to 1 and the remaining n−k locations are set to 0. Such matrices serve as input to Bayesian network methods.
Fig. 2.
Equivalent representation of a gene set compendium as discrete data.
We considered two Bayesian network approaches: K2 (Cooper and Herskovits, 1992) and Metropolis–Hastings or MH (Murphy, 2001a) implemented in the Bayes Net Tool Box (BNT) (Murphy, 2001b). Given an initial ordering of nodes, the K2 approach is based on incrementally assigning a parent to a node whose addition increases the score of the resulting structure the most. MH algorithm starts from an initial directed acyclic network and sequentially samples networks from the neighborhood of the most recent network. Neighborhood in the context of MH is the collection of all directed acyclic networks that differ from the given network by addition, deletion or reversal of a single edge. For scoring a structure, BNT provides the Bayesian Information Criterion (BIC) and Bayesian score function. We used both BIC and Bayesian scoring (with Dirichlet prior) functions to infer Bayesian networks. In the case of K2, the maximum number of parents allowed for a node was set at three for a manageable computational complexity.
3.1.3 The proof-of-principle study
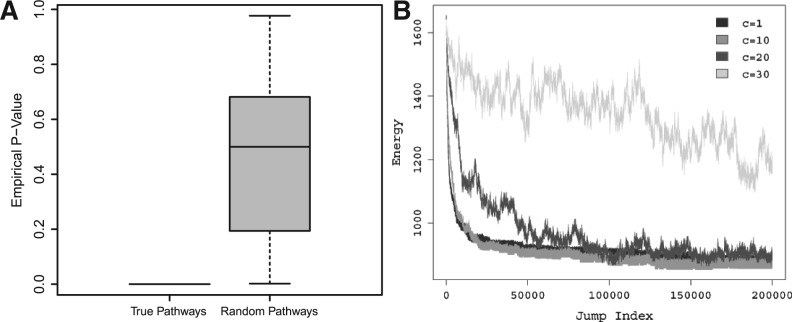
We began by examining that the true signaling pathway structure has the lowest energy in the feasible set. We considered two collections of feasible structures. The first collection composed of all 83 signaling pathway structures constructed from the true IFs. The second collection contained 83 randomly selected structures, one from each of the 83 feasible sets. Figure 3A presents the empirical P-values calculated for each structure in the two collections, where we fixed N=1000 (see Section 2). We observed that the empirical P-value for each of the 83 true structures was always zero while it fluctuated in the interval (0 1) in the case of randomly selected feasible structures. This justified the choice of the energy function used in our algorithm.
Fig. 3.
(A) empirical P-values computed for true signaling pathway structures (Left) and randomly selected feasible pathway structures (Right) corresponding to 83 IFGS compendiums derived from the KEGG pathways. (B) Energy values computed by varying the cooling schedule constant for a total of 2×10⁵ jumps. The IFGS compendium was derived from the generic vascular smooth muscle contraction pathway in KEGG.
For choosing the cooling schedule constant and number of jumps, we considered 10 IFGS compendiums of different sizes. The number of IFGSs in the compendiums varied in the range 30–723. Note that the signaling pathway structures in public databases are often generic in nature. So, only a part of a signaling pathway structure will be activated under a specific context, as opposed to the entire structure. Therefore, the above gene set compendiums are a reasonable representation of underlying context-specific signaling mechanisms. As a result, the choice of parameters based on our evaluation is also applicable to other similar scenarios.
We evaluated the performance of SA by setting the cooling schedule constant at five different levels c=1, 10, 20, 30 and 40 and the number of jumps at four different levels J=1×10⁴, 5×10⁴, 1×10⁵, 2×10⁵. In general, a small value of c may result in a local solution, whereas a large value of c may require large computational time. This fact is also evident from Figure 3B, where we present energy values from four different runs of SA with cooling schedule constant set at c=1, 10, 20 and 30. Thus, a value of c should be chosen to comprise between inference accuracy and computational time. We summarize the performance of SA in terms of F-score and precision averaged over 10 independent runs. F-score is defined as 2pr/(p+r), where p and r stand for precision and recall, respectively. Precision is the proportion of true positives among the inferred edges.
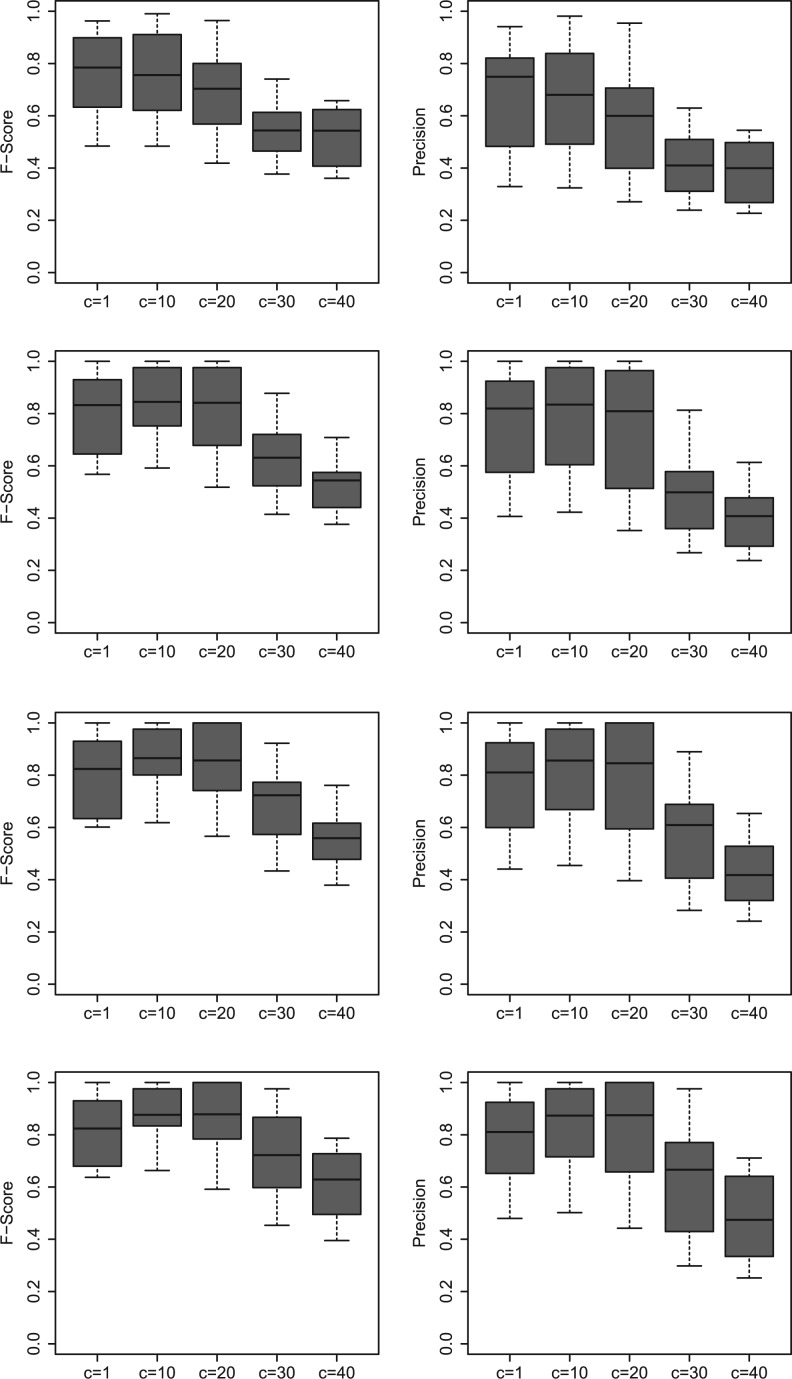
In Figure 4, we observe an increase in the performance of SA with increasing number of jumps (Row 1 to Row 4), for each fixed value of c. Moreover, the F-scores and precision values are overall better in the case of c=10, compared with other values of c. In Table 1, we compare SA, MH and K2 in terms of computational time and F-score, where we use four IFGS compendiums with 54, 108, 195 and 723 IFGSs. We also present the performance of SA and MH at different jump/sample indices. It is clear from Table 1 that the total time required by SA to take 2×10⁵ jumps may be smaller than the time required by MH to sample 103−104 structures. MH also suffers from large memory requirements. Moreover, performance of SA is significantly better than MH at different jump indices. Since K2 does not depend on the number of jumps, we list total time required in a single run of the algorithm. At the end of 2×10⁵ jumps, total time required by SA is higher than K2 by a manageable difference. On the other hand, F-scores from SA are significantly higher than the ones from K2. By considering 2×10⁵ jumps, the F-score could be increased up to 70% in the case of a large compendium with 723 IFGSs. Thus, the parameters c=10 and J=2×10⁵ provide a good compromise between computational time and method performance.
Fig. 4.
F-scores (Left) and precision values (Right) from SA at jump index 1×10⁴ (Row 1), 5×10⁴ (Row 2), 1×10⁵ (Row 3) and 2×10⁵ (Row 4). We used 10 IFGS compendiums with the number of IFGSs in the range 30–723.
Table 1.
Comparison of SA and Bayesian network methods MH and K2 (using Bayesian score) in terms of computational time (in minutes) and F-score
| Time |
F-score |
||||||||
|---|---|---|---|---|---|---|---|---|---|
| 103 | 104 | 105 | 2×10⁵/Final | 103 | 104 | 105 | 2×10⁵/Final | ||
| SA | 0.02 | 0.18 | 1.9 | 3.7 | SA | 0.57 | 0.89 | 1 | 1 |
| MH | 0.49 | 5.14 | 53.37 | 118.1 | MH | 0.11 | 0.16 | 0.17 | 0.21 |
| K2 | 0.10 | K2 | 0.32 | ||||||
| SA | 0.03 | 0.32 | 3.2 | 6.5 | SA | 0.69 | 0.91 | 1 | 1 |
| MH | 2.12 | 27.02 | a | a | MH | 0.08 | 0.11 | – | – |
| K2 | 0.27 | K2 | 0.20 | ||||||
| SA | 0.04 | 0.39 | 3.9 | 7.9 | SA | 0.45 | 0.54 | 0.632 | 0.74 |
| MH | 2.22 | 21.11 | a | a | MH | 0.09 | 0.145 | – | – |
| K2 | 0.32 | K2 | 0.37 | ||||||
| SA | 0.20 | 2.00 | 19.91 | 39.92 | SA | 0.33 | 0.48 | 0.644 | 0.71 |
| MH | 367.5 | a | a | a | MH | 0.022 | – | – | – |
| K2 | 14.99 | K2 | 0.24 | ||||||
Performance of SA and MH is evaluated at jump/sample index 103, 104, 105 and 2×10⁵. In the case of K2, total time and F-score is presented. We considered 4 IFGS compendiums with 54, 108, 195 and 723 IFGSs (in the same order). In the case of MH, a structure with the highest F-score among the sampled structures was used for comparison.
aProgram terminated due to memory crash.
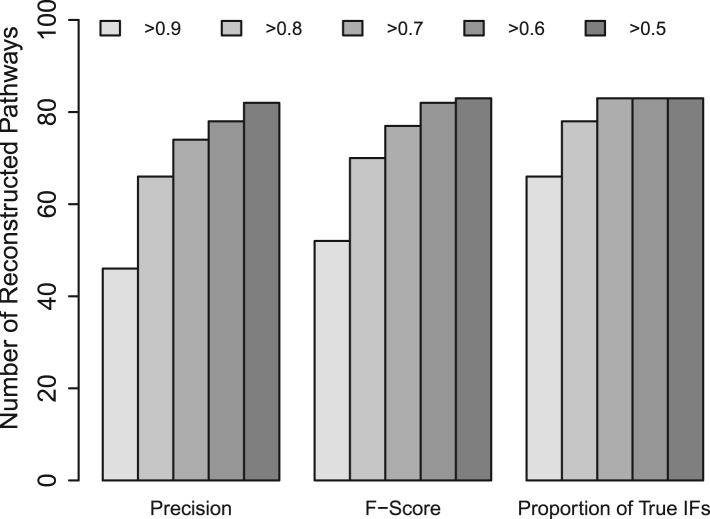
By fixing c=10 and J=2×10⁵, we applied SA on all 83 IFGSs compendiums. Figure 5 demonstrates the performance of SA in reconstructing the true signaling mechanisms. On the left and middle panels of Figure 5, we have plotted the number of structures among 83 reconstructed structures with a certain minimum precision and F-score, respectively. On the right panel, we have considered the proportion of signaling cascades accurately inferred by SA in each compendium. The feasibility and validity of SA is evident from the high precisions, F-scores and high proportions of accurately inferred signaling cascades.
Fig. 5.
Performance of SA in reconstructing the true signaling cascades and signaling pathway structures corresponding to 83 IFGS compendiums derived from the KEGG database.
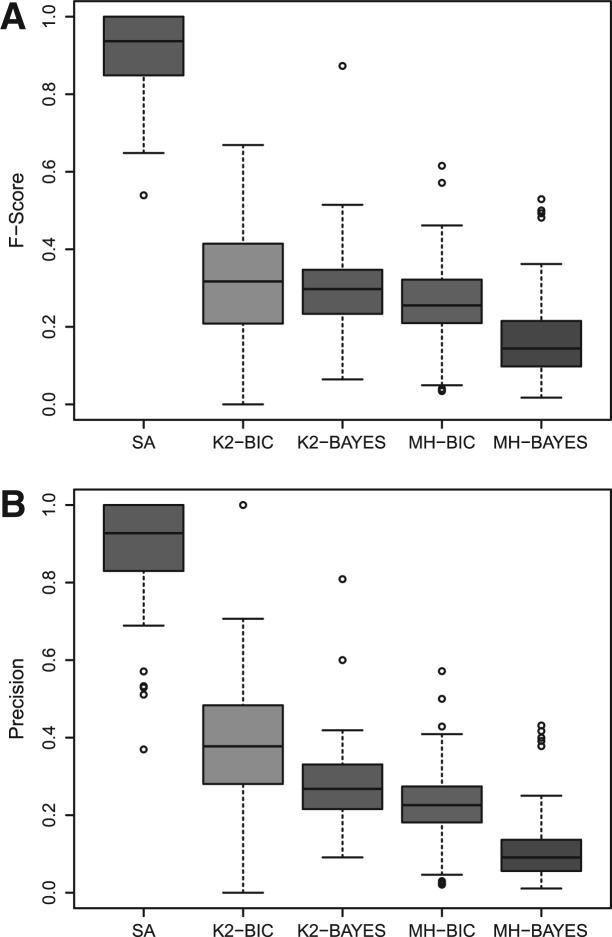
In Figure 6, we present the results from a comparative study performed using each of the 83 IFGS compendiums. We observe a significantly better performance of SA in recovering the true structure compared with the Bayesian network methods. In each run of MH, the first 1000 samples were collected for a manageable computational complexity and the structure giving the highest F-score was selected for comparison. Figure 6 demonstrates the strength of SA in inferring signal cascading mechanisms. As described in Section 3.1.1, each IFGS compendium considered in Figure 6 was composed of gene sets that represented true signaling events in the corresponding KEGG structure. However, we did not know the ordering of genes in the events. As a result, binary discrete data used for Bayesian network methods is also a true representation of underlying signaling events. Note that in each sample (gene set) of binary data matrix, genes that participate in underlying IF always fall in the same bin. Due to the use of this true data representation, we expect all algorithms to perform well. Nonetheless, the strength of Bayesian network methods lies in inferring casual interactions (column–column association), whereas SA explicitly considers signal cascading mechanism in each row. Therefore, we observe a superior performance of SA.
Fig. 6.
Comparison of SA with Bayesian network methods K2 and MH using BIC and Bayesian score functions. (A and B) Shows F-score and precision, respectively.
We also evaluated the performance of SA when IFGSs in a compendium shared multiple pathway memberships (see Section 4 in Supplementary Material). Results from this evaluation were similar to the ones in Figure 6.
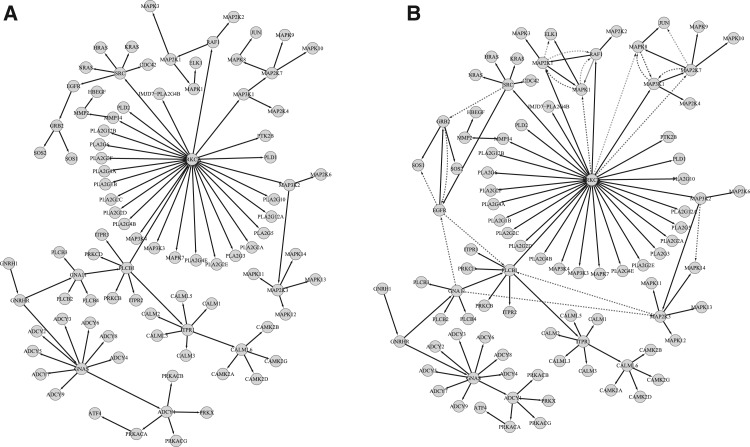
In Figure 7, we present a signaling pathway structure inferred by our approach. Structures on the left and right correspond to the true and inferred signaling pathway structures, respectively. The black (solid) and blue (dashed) edges represent true positives and false positives, respectively. Figure 7 demonstrates high precision and recall in the structure reconstructed by SA, resulting in a high F-score.
Fig. 7.
An example showcasing the performance of SA in recovering the true structure using the IFGS compendium derived from GnRH signaling pathway in KEGG database. Structures represent true (A) and inferred signaling pathways (B), respectively. The black (solid) and blue (dashed) edges represent true positives and false positives, respectively. Figures were generated using Cytoscape (Shannon et al., 2003).
3.2 Case Study II: evaluation using E. coli datasets
3.2.1 Description of the datasets
In this study, we compared the performance of SA and Bayesian network methods using four benchmark E.coli datasets available from DREAM3 network challenges in the DREAM initiative (Marback et al., 2009, 2010; Prill et al., 2010). The first two datasets comprise of 50 genes and 51 samples, whereas the remaining two datasets contain 100 genes and 101 samples. The corresponding gold standard networks comprise 62, 82, 125 and 119 edges, respectively. We compared the inferred structures with the corresponding gold standards. We first derived four IFGS compendiums from the above datasets by declaring the top 10% of the measurements in each dataset as 1 and the remaining measurements as 0. This discretization produced IFGSs of diverse lengths across different samples. In each compendium, we considered IFGSs with lengths in the range 3–9. This resulted in four IFGS compendiums with 47, 45, 45 and 49 IFGSs, respectively.
3.2.2 Performance evaluation
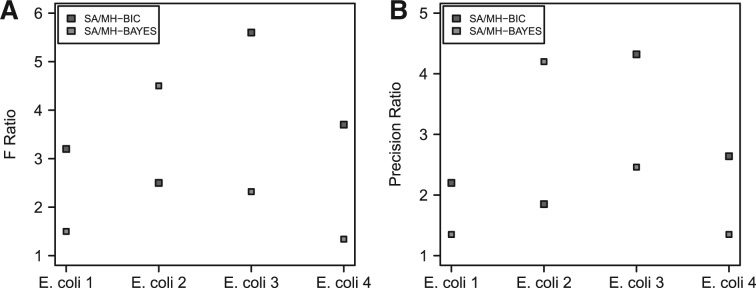
We used SA to explore the search spaces formed by considering all possible gene orderings of IFGSs present in each compendium. We applied K2 and MH on the binary equivalent data corresponding to each compendium. Since we could not discover any structure in several runs of K2 on some of the compendiums, we present the performance of SA and MH. In Figure 8A, we show the performance of SA and MH in terms of F-score ratio, which is the ratio of F-score from SA and the one from MH. In Figure 8B, we present the performances in terms of precision ratio. A ratio >1 indicates a better performance of SA. In the case of SA, a structure was inferred by fixing the cooling schedule constant at 10 and the number of jumps 2×10⁵. In the case of MH, we sampled a structure after 2×10⁵ steps. In Table 2, we list the computational time required by SA and MH. In Figure 8, we observed a higher F-score and precision using SA, compared with MH. It is also clear from Table 2 that SA benefits from a much reduced computational cost than MH.
Fig. 8.
(A and B) Comparison of SA and MH in terms of F-score and precision ratios. A ratio >1 indicates a better performance by SA. We used four E.coli benchmark datasets available from the DREAM initiative.
Table 2.
Comparison of SA and MH in terms of computational time (in minutes) using four E.coli datasets from the DREAM initiative
| Method | Escherichia coli 1 | Escherichia coli 2 | Escherichia coli 3 | Escherichia coli 4 |
|---|---|---|---|---|
| SA | 3.41 | 3.25 | 4.47 | 4.50 |
| MH-BIC | 24.95 | 22.41 | 62.65 | 47.98 |
| MH-BAYES | 25.19 | 22.61 | 174.61 | 72.62 |
3.3 Case Study III: ERBB and PMOM pathways activation in breast cancer
3.3.1 Description of the datasets
In this study, we showcase two context-specific signaling pathways, ERBB and PMOM (progesterone-mediated oocyte maturation), activated in breast cancer. We considered 87 genes participating in the ERBB signaling pathway and 35 genes in the giant connected component (GCC) of the PMOM pathway from the KEGG database. We analyzed 299 clinical breast cancer tissue gene expression profiles from the Affymetrix HG-U133 plus 2.0 platform and considered datasets of size 87×299 and 35×299 corresponding to the genes in the two pathways. To derive IFGS compendiums, we discretized each data set using equal-width binning and binary labels (Fig. 2).
Specifically, we derived two IFGS compendiums, Compendiums I and II, corresponding to the genes in the ERBB and PMOM pathways, respectively, with a minimum of four component genes in each IFGS. As the majority of IFGSs (∼90% in Compendium I and ∼94% in Compendium II) were composed of 4–9 genes, such samples provided a good compromise between the overlapping among IFGSs and the time for convergence. This resulted in two compendiums with 204 and 96 IFGSs, respectively. We assigned the end nodes for each context-specific IFGS using the hierarchial representation of genes in different layers of the generic ERBB and PMOM pathway structures in the KEGG database. The hierarchial representation of a signaling pathway can be visualized using Cytoscape (Shannon et al., 2003). Within each IFGS, a gene lying in the upper most and a gene in the lower most layer were considered as the two end nodes. It is worth mentioning here that layering information accounts for the gene orderings at a very crude level because (i) the derived IFGSs do not necessarily correspond to signaling events already reported in KEGG, (ii) no prior knowledge of edges in the two KEGG structures was used. Lists of genes in the two compendiums along with their hierarchial arrangements in the different layers of the two KEGG pathways have been presented in Section 2 in the Supplementary Material.
3.3.2 The showcase examples
We inferred two breast cancer-specific signaling pathway structures using the derived compendiums. To evaluate the performance of SA, we first utilized the structures of ERBB and PMOM signaling pathways in the KEGG database. Considering that the direction of an information flow is often from an upper layer to a lower one in the hierarchial representation of a signaling pathway, and the real-world gene sets correspond to partially observed signaling events, at the minimum we expected a larger number of inferred edges between genes in upper layers to genes in lower layers in the hierarchial representation of the two KEGG pathway structures. Indeed, we verified that nearly 76% and 89% of the inferred edges follow this hierarchy, i.e. no parent came from a layer lower than the one for its child. This observation indicates that for a vast majority of inferred signaling mechanisms, the flow of information was from an upper layer to a lower one.
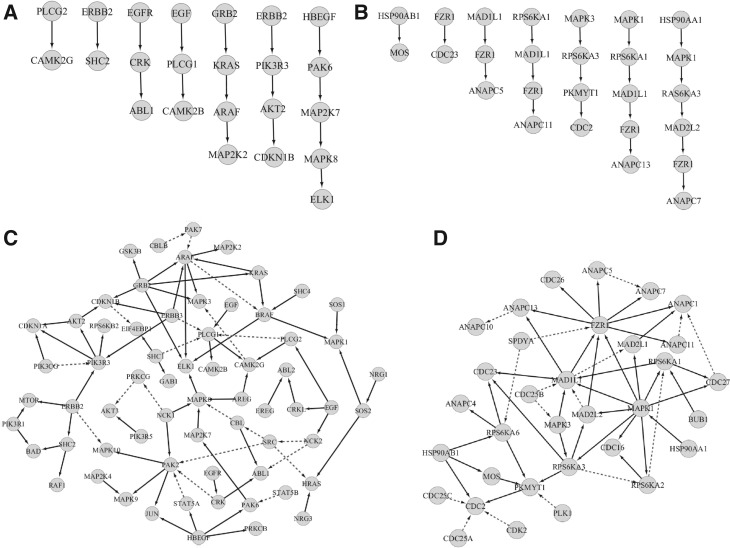
In the upper panel of Figure 9, we present a few reconstructed signal transduction events, which correspond to complete or partial linear signal cascades already reported in the ERBB and PMOM pathway structures in the KEGG database. In the lower panel of Figure 9, we present a partial view of the two reconstructed signaling pathways with solid edges representing complete or partial linear signal cascades already reported in the ERBB and PMOM signaling pathways in the KEGG database, whereas dashed edges follow the hierarchy of these structures and can be viewed as predictions. While the figures do not attempt to portray a comprehensive view of signaling pathways, SA algorithm has the potential to uncover biologically relevant mechanisms that have not been previously considered or understood.
Fig. 9.
Linear cascading events inferred by SA, which correspond to complete or partial linear signaling events already reported in the ERBB (A) and PMOM (B) pathways in KEGG. Partial view of the breast cancer signaling pathways, ERBB (C) and PMOM (D), inferred by SA. A solid edge represents that a complete or partial linear signaling event between parent and child node has been recognized in the ERBB and PMOM structures in KEGG, whereas dashed edges follow the hierarchial arrangements of these structures.
ERBB/HER family receptors play important roles in many types of cancer including breast cancer. Dysregulation/mutation in the epidermal growth factor receptor (EGFR) and ERBB2 (HER2) have been known to promote angiobenesis and metastasis in breast cancer (Lurje and Lenz, 2009; Navolanic et al., 2003). Some known signaling cascades that contribute to breast cancer progression include RAF/MEK/ERK and PI3K/PDK1/AKT signaling pathways that regulate apoptosis and cell cycle. These signaling events are reflected in the edges depicted in Figure 9A. For instance, in breast cancer ERBB2/HER2 receptor can constitutively activate the PI3K/PDK1/AKT cascade and the downstream effector, the mammalian target of rapamycin (MTOR). This known signaling cascade is conformed as a direct action between ERBB2/HER2 and MTOR in Figure 9C.
In Figure 9C, the reconstructed ERBB signaling pathway revealed a previously unknown direct link from ERBB3 to ARAF. ARAF (A-Raf proto-oncogene serine/threonine-protein kinase) is known to phosphorylate and activate MEK1 (MAP2K1) and MEK2 (MAP2K2), leading to the suppression of apoptosis in cancer cells (Roskoski et al., 2010). However, the possible role of ERBB3 as its upstream regulator is a novel implication that clearly warrants further investigation. In addition, PI3K family members are known to be the downstream targets of EGFR and ERBB2/HER2, but not ERBB3 (Chandarlapaty et al., 2011). Thus, the direct link between ERBB2 and PI3K inferred by SA is in accordance with the previously established results. The direct link between ERBB3 and PIK3R3, on the other hand, suggests a potential role of ERBB3 receptor tyrosine kinase in breast cancer. A major clinical challenge of breast cancer treatment is acquired resistance to hormone therapy as the tumor develops alternative survival signaling such as enhanced cross-talk between the estrogen receptor (ER) and ERBB1/ERBB2 (Schiff et al., 2004). Thus combinatorial therapeutic intervention targeting both ER and ERBB2 (HER2) is currently under intensive clinical studies (Leary et al., 2007, 2010; Osborne et al., 2011). Revelation of the novel link between ERBB3 and PI3K family proteins is significant because it represents yet another adaptive pathway in breast cancer that needs to be fully understood in order to develop a more effective regimen blocking this survival signaling.
In the case of PMOM pathway (Fig. 9D), we show a highlighted role of the Fizzy protein (FZR1/CDC20) in breast cancer. It is an indication that the ubiquitin ligase activity of the anaphase promoting complex (APC) plays an important role in breast cancer progression. Previous studies have established an association between APC and FZR1 (Taieb et al., 2001) implicating FZR1 regulation of ANAPC isoforms 1, 2, 4, 5, 7 and 10. We observe additional regulation mechanisms involving ANAPC 11 and 13, apparently in a way specific to breast tumor tissues. The reconstructed PMOM signaling pathway also reveals a novel direct action of mitogen-activated protein kinase 1 (MAPK1) upon FZR1. The MAP kinase cascade is associated with the control of cell cycle progression, but in a manner that is far upstream of FZR1-mediated APC. It is possible that this direct action may be a result of the non-genomic signaling of progesterone (Baldi et al., 2009) that rapidly and constitutively activates the MAP kinase signaling cascade in breast cancers that are ER positive but progesterone receptor (PGR) negative.
If experimentally validated and mechanistically elucidated, the novel activation of FZR1 by MAPK1 will have important outcomes in breast cancer research. For example, studies can be designed to investigate if inhibiting the kinase can block FZR1-mediated APC, and if any effector proteins are involved in this signaling cascade. Such studies can be driven by hypotheses generated from SA-based reconstruction of signaling pathways, and can lead to the discovery of new biomarkers as potential diagnostic, prognostic, or therapeutic targets for breast cancer.
4 CONCLUSION
In this article, we presented a novel SA approach to learn the optimal signaling pathway structures from gene sets. We hypothesized a true signaling pathway structure as an ensemble of overlapping signal cascades. We then translated its reconstruction from unordered gene sets corresponding to signaling cascades into a discrete optimization problem. Throughout we treated gene sets as random variables and their orders as random. We also introduced a novel energy function to measure the optimality of a signaling pathway structure. Overall, our approach benefits from the following: (i) treatment of unordered gene sets as random variables and building blocks of a signaling pathway allows us to explicitly consider signal cascading mechanisms in the underlying structure. (ii) The problem easily fits into the framework of discrete optimization, where the feasible space is finite but is difficult to explore. (iii) The computational complexity of SA is manageable. In Case Study I, performance evaluation using 83 gene set compendiums derived from the KEGG pathways demonstrated that SA could recover the underlying structures more efficiently than Bayesian network methods. In Case Study II, we compared the performance of SA and Bayesian network methods using four E.coli datasets available from the DREAM initiative. In Case Study III, breast cancer-specific reconstruction of two signaling pathway structures from the KEGG database further proved the advantages of using SA in real-world scenarios.
The proposed study is useful since the prior known pathway structures may not represent a complete picture of underlying signal cascading mechanisms. There might exist additional mechanisms among genes related to the pathways. Also the pathway structures in databases are often generic, whereas scientists may be interested in learning context-specific networks of genes in the pathways. SA can be used in such scenarios. As gene set-based structural inference of signaling pathways is new to the biomedical field, refinement and extension of our algorithm is an important future research direction for us. For example, the current setting can be combined with the identification of pathway components from high-throughput transcriptomics data. SA will also benefit by penalizing random structures in the search space and improving the current jump strategy to locate the optimal solution. We believe that gene set-based approach is an important step toward the reconstruction of signaling pathway structures from molecular profiling data available in diverse forms.
Funding: This work was supported by NIH (grants R21LM010137 and 5G12RR026260-2 to D. Z. and G. W.), respectively.
Conflict of interest: none declared.
Supplementary Material
REFERENCES
- Acharya L., et al. GSGS: a computaional framework to reconstruct signaling pathways from gene sets. IEEE/ACM Trans. Comput. Biol. Bioinform. 2011 doi: 10.1109/TCBB.2011.143. doi:10.1109/TCBB.2011.143. [DOI] [PubMed] [Google Scholar]
- Alberts B., et al. Molecular Biology of the Cell. 4th. New York: Garland Science; 2002. [Google Scholar]
- Altay G., Emmert-Streib F. Revealing differences in gene network inference algorithms on the network-level by ensemble methods. Bioinformatics. 2010a;26:1738–1744. doi: 10.1093/bioinformatics/btq259. [DOI] [PubMed] [Google Scholar]
- Altay G., Emmert-Streib F. Inferring the conservative causal core of gene regulatory networks. BMC Syst. Biol. 2010b;4:132. doi: 10.1186/1752-0509-4-132. [DOI] [PMC free article] [PubMed] [Google Scholar]
- Altay G., Emmert-Streib F. Structural influence of gene networks on their inference: analysis of C3NET. Biol. Direct. 2011;6:31. doi: 10.1186/1745-6150-6-31. [DOI] [PMC free article] [PubMed] [Google Scholar]
- Baker D. LVB: parsimony and simulated annealing in the search for phylogenetic trees. Bioinformatics. 2004;20:274–275. doi: 10.1093/bioinformatics/btg402. [DOI] [PubMed] [Google Scholar]
- Baldi E., et al. Nongenomic activation of spermatozoa by steroid hormones: facts and fictions. Mol. Cell Endocrinol. 2009;308:39–46. doi: 10.1016/j.mce.2009.02.006. [DOI] [PubMed] [Google Scholar]
- Butte A.J., Kohane I.S. Mutual information relevance networks: functional genomic clustering using pairwise entropy measurements. Pac. Symp. Biocomput. 2000;5:415–426. doi: 10.1142/9789814447331_0040. [DOI] [PubMed] [Google Scholar]
- Chandarlapaty S., et al. AKT inhibition relieves feedback suppression of receptor tyrosine kinase expression and activity. Cancer Cell. 2011;19:58–71. doi: 10.1016/j.ccr.2010.10.031. [DOI] [PMC free article] [PubMed] [Google Scholar]
- Chen C.M., et al. Inferring genetic interactions via a nonlinear model and an optimization algorithm. BMC Syst. Biol. 2010;4:16. doi: 10.1186/1752-0509-4-16. [DOI] [PMC free article] [PubMed] [Google Scholar]
- Chong E.K.P., Żak S.H. An Introduction to Optimization. 3rd. Hoboken, New Jersey: John Wiley & Sons.; 2008. [Google Scholar]
- Cooper G.F., Herskovits E. A Bayesian method for the induction of probabilistic networks from data. Mach. Learn. 1992;9:309–347. [Google Scholar]
- Faith J.J., et al. Large-scale mapping and validation of Escherichia coli transcriptional regulation from a compendium of expression profiles. PLoS Biol. 2007;5:e8. doi: 10.1371/journal.pbio.0050008. [DOI] [PMC free article] [PubMed] [Google Scholar]
- Friedman N., et al. Using Bayesian networks to analyze expression data. J. Comput. Biol. 2000;7:601–620. doi: 10.1089/106652700750050961. [DOI] [PubMed] [Google Scholar]
- Glaab E., et al. TopoGSA: network topological gene set analysis. Bioinformatics. 2010;26:1271–1272. doi: 10.1093/bioinformatics/btq131. [DOI] [PMC free article] [PubMed] [Google Scholar]
- Glover F. Tabu Search - Part I. ORSA J. Comp. 1989;1:190–206. [Google Scholar]
- Goldstein L., Waterman M. Neighborhood size in the simulated annealing algorithm. Am. J. Math. Manag. Sci. 1988;8:3–4. [Google Scholar]
- Gonzalez O.R., et al. Parameter estimation using Simulated Annealing for S-system models of biochemical networks. Bioinformatics. 2007;23:480–486. doi: 10.1093/bioinformatics/btl522. [DOI] [PubMed] [Google Scholar]
- Hajek B. Cooling schedules for optimal annealing. Math. Operat. Res. 1988;13:311–329. [Google Scholar]
- Holland J.H. Adaptation in Natural and Artificial Systems: An Introductory Analysis with Applications to Biology, Control, and Artificial Intelligence. Cambridge, MA: MIT Press; 1992. [Google Scholar]
- Kaderali L., et al. Reconstructing signaling pathways from RNAi data using probabilistic Boolean threshold networks. Bioinformatics. 2009;25:2229–2235. doi: 10.1093/bioinformatics/btp375. [DOI] [PubMed] [Google Scholar]
- Kanehisa M., et al. KEGG for representation and analysis of molecular networks involving diseases and drugs. Nucleic Acids Res. 2010;38:D355–D360. doi: 10.1093/nar/gkp896. [DOI] [PMC free article] [PubMed] [Google Scholar]
- Kirkpatrick S., et al. Optimization by simulated annealing. Science. 1983;220:671–680. doi: 10.1126/science.220.4598.671. [DOI] [PubMed] [Google Scholar]
- Leary A.F., et al. Clinical trials update: endocrine and biological therapy combinations in the treatment of breast cancer. Breast Cancer Res. 2007;9:112. doi: 10.1186/bcr1763. [DOI] [PMC free article] [PubMed] [Google Scholar]
- Leary A.F., et al. Lapatinib restores hormone sensitivity with differential effects on estrogen receptor signaling in cell models of human epidermal growth factor receptor 2-negative breast cancer with acquired endocrine resistance. Clin. Cancer Res. 2010;16:1486–1497. doi: 10.1158/1078-0432.CCR-09-1764. [DOI] [PubMed] [Google Scholar]
- Lurje G., Lenz H.J. EGFR signaling and drug discovery. Oncology. 2009;77:400–410. doi: 10.1159/000279388. [DOI] [PubMed] [Google Scholar]
- Marbach D., et al. Generating realistic in silico gene networks for performance assessment of reverse engineering methods. J. Comput. Biol. 2009;16:229–239. doi: 10.1089/cmb.2008.09TT. [DOI] [PubMed] [Google Scholar]
- Marbach D., et al. Revealing strengths and weaknesses of methods for gene network inference. Proc. Natl Acad. Sci. USA. 2010;107:6286–6291. doi: 10.1073/pnas.0913357107. [DOI] [PMC free article] [PubMed] [Google Scholar]
- Margolin A., et al. ARACNE: an algorithm for the reconstruction of gene regulatory networks in a mammalian cellular context. BMC Bioinformatics. 2006;7(Suppl. 1):S7. doi: 10.1186/1471-2105-7-S1-S7. [DOI] [PMC free article] [PubMed] [Google Scholar]
- Medina I., et al. Gene set-based analysis of polymorphisms: finding pathways or biological processes associated to traits in genome-wide association studies. Nucleic Acids Res. 2009;37:340–344. doi: 10.1093/nar/gkp481. [DOI] [PMC free article] [PubMed] [Google Scholar]
- Meyer P.E., et al. Information-theoretic inference of large transcriptional regulatory networks. EUROSIP J. Bioinform. Syst. Biol. 2007;2007:79879. doi: 10.1155/2007/79879. [DOI] [PMC free article] [PubMed] [Google Scholar]
- Meyer P.E., et al. minet: A R/Bioconductor package for inferring large transcriptional networks using mutual information. BMC Bioinformatics. 2008;9:461. doi: 10.1186/1471-2105-9-461. [DOI] [PMC free article] [PubMed] [Google Scholar]
- Murphy K. Active learning of causal bayes net structure. UC Berkeley: Department of Computer Science; 2001a. Technical report. [Google Scholar]
- Murphy K. The Bayes net toolbox for MATLAB. Comput. Sci. Stat. Proc. Interface. 2001b;33:331–350. [Google Scholar]
- Navolanic P.M., et al. EGFR family signaling and its association with breast cancer development and resistance to chemotherapy (Review) Int. J. Oncol. 2003;22:237–252. [PubMed] [Google Scholar]
- Osborne C.K., et al. Gefitinib or placebo in combination with tamoxifen in patients with hormone receptor-positive metastatic breast cancer: a randomized phase II study. Clin. Cancer Res. 2011;17:1147–1159. doi: 10.1158/1078-0432.CCR-10-1869. [DOI] [PMC free article] [PubMed] [Google Scholar]
- Park C.Y., et al. Simultaneous genome-wide inference of physical, genetic, regulatory, and functional pathway components. PLoS Comput. Biol. 2010;6:e1001009. doi: 10.1371/journal.pcbi.1001009. [DOI] [PMC free article] [PubMed] [Google Scholar]
- Prill R.J., et al. Towards a rigorous assessment of systems biology models: the DREAM3 challenges. PLoS One. 2010;5:e9202. doi: 10.1371/journal.pone.0009202. [DOI] [PMC free article] [PubMed] [Google Scholar]
- Rabbat M.G., et al. Network inference from co-occurrences. IEEE Trans. Inform. Theor. 2008;54:4053–4068. [Google Scholar]
- Roskoski R., Jr RAF protein-serine/threonine kinases: structure and regulation. Biochem. Biophys. Res. Commun. 2010;399:313–317. doi: 10.1016/j.bbrc.2010.07.092. [DOI] [PubMed] [Google Scholar]
- Schiff R., et al. Cross-talk between estrogen receptor and growth factor pathways as a molecular target for overcoming endocrine resistance. Clin. Cancer Res. 2004;10:331S–336S. doi: 10.1158/1078-0432.ccr-031212. [DOI] [PubMed] [Google Scholar]
- Segal E., et al. Module networks: identifying regulatory modules and their condition-specific regulators from gene expression data. Nat. Genet. 2003;34:166–176. doi: 10.1038/ng1165. [DOI] [PubMed] [Google Scholar]
- Shannon P., et al. Cytoscape: a software environment for integrated models of biomolecular interaction networks. Genome Res. 2003;13:2498–2504. doi: 10.1101/gr.1239303. [DOI] [PMC free article] [PubMed] [Google Scholar]
- Shmulevich I., et al. Probabilistic Boolean Networks: a rule-based uncertainty model for Gene Regulatory Networks. Bioinformatics. 2002;18:261–274. doi: 10.1093/bioinformatics/18.2.261. [DOI] [PubMed] [Google Scholar]
- Subramanian A., et al. Gene set enrichment analysis: a knowledge-based approach for interpreting genome-wide expression profiles. Proc. Natl Acad. Sci. USA. 2005;102:15545–15550. doi: 10.1073/pnas.0506580102. [DOI] [PMC free article] [PubMed] [Google Scholar]
- Taieb F.E., et al. Activation of the anaphase-promoting complex and degradation of cyclin B is not required for progression from Meiosis I to II in Xenopus oocytes. Curr. Biol. 2001;11:508–513. doi: 10.1016/s0960-9822(01)00145-2. [DOI] [PubMed] [Google Scholar]
- Tian L., et al. Discovering statistically significant pathways in expression profiling studies. Proc. Natl Acad. Sci. USA. 2005;102:13544–13549. doi: 10.1073/pnas.0506577102. [DOI] [PMC free article] [PubMed] [Google Scholar]
- Xu T.R., et al. Inferring signaling pathway topologies from multiple perturbation measurements of specific biochemical species. Sci. Signal. 2010;3:ra20. [PubMed] [Google Scholar]
Associated Data
This section collects any data citations, data availability statements, or supplementary materials included in this article.


