Abstract
Carbohydrates, or glycans, are one of the most abundant and structurally diverse biopolymers constitute the third major class of biomolecules, following DNA and proteins. However, the study of carbohydrate sugar chains has lagged behind compared to that of DNA and proteins, mainly due to their inherent structural complexity. However, their analysis is important because they serve various important roles in biological processes, including signaling transduction and cellular recognition. In order to glean some light into glycan function based on carbohydrate structure, kernel methods have been developed in the past, in particular to extract potential glycan biomarkers by classifying glycan structures found in different tissue samples. The recently developed weighted qgram method (LK-method) exhibits good performance on glycan structure classification while having limitations in feature selection. That is, it was unable to extract biologically meaningful features from the data. Therefore, we propose a biochemicallyweighted tree kernel (BioLK-method) which is based on a glycan similarity matrix and also incorporates biochemical information of individual q-grams in constructing the kernel matrix. We further applied our new method for the classification and recognition of motifs on publicly available glycan data. Our novel tree kernel (BioLK-method) using a Support Vector Machine (SVM) is capable of detecting biologically important motifs accurately while LK-method failed to do so. It was tested on three glycan data sets from the Consortium for Functional Glycomics (CFG) and Kyoto Encyclopedia of Genes and Genomes (KEGG) GLYCAN and showed that the results are consistent with the literature. The newly developed BioLK-method also maintains comparable classification performance with the LK-method. Our results obtained here indicate that the incorporation of biochemical information of q-grams further shows the flexibility and capability of the novel kernel in feature extraction, which may aid in the prediction of glycan biomarkers.
Keywords: metacestode, rodent, internal transcribed spacer, ribosomal DNA, polymerase chain reaction
Background
Supporting evidence has verified that glycans play crucial roles in cellular functions. However, the complexity in developing high-throughput techniques to characterize glycan structures poses one of the main obstacles to assess the structural elements responsible for specific functions. Thanks to the availability of glycan structure databases such as KEGG [1] and the Consortium for Functional Glycomics (CFG) [2], informatics techniques can be applied directly to glycan data to help researchers better understand the functions and structures of these complicated molecules.
Compared to the linear structures of DNA and proteins, glycans are generally nonlinear polymers that can be represented by rooted ordered trees. Several approaches have been developed to mine structural features embedded in glycans [3, 4]. Support vector machines (SVMs) with tree kernels for analyzing glycan structures have been extensively investigated [5, 6]. In [5], 3- mers were used to represent the features for each glycan structure, where more weight was applied to the matching structures of the variable region (specifically, the non-reducing terminal structures of glycans) in constructing the kernel matrix. As for [6], the kernel function was expressed as a sum of local kernels over all possible subtrees. One of the groundbreaking representatives is the q-gram method [7, 8] which considers the vector of the frequencies of all possible subtrees isomorphic to paths with q nodes as the q-gram distribution. Like the previously proposed kernels, the traditional q-gram method ignores the similarity between two different q-grams. Taking into consideration the similarity of geometric structures, monosaccharides and glycosidic bonds in q-grams, a new tree kernel was created [9], resulting in a weighted q-gram method: LK-method. With this method, the classification performance was improved for some important glycan classes. However, one of the limitations of this method lies in the poor performance in extracting biologically relevant glycan substructures, the most important goal of our research. Our aim is to remedy the defects of the LK-method.
Kernel methods work by embedding data instances into a feature space F. Due to their good performance in processing complicated data, kernel methods have gained increasing popularity in computational biology [10]. The Positive Semi- Definite (PSD) property [11] of a kernel matrix is required to ensure the existence of a Reproducing Kernel Hilbert Space (RKHS) where a convex optimization formulation can be deduced to yield an optimal solution. However, in practice, similarity matrices can violate the PSD property. For example, in bioinformatics some popular functions evaluating pair-wise similarity between DNA and protein sequences produce non- PSD (or indefinite) kernel matrices. Unfortunately, the best way to use them in the SVM framework is not clear. The weighted qgram method avoids the problem of the non-PSD property by constructing the similarity matrix as to ensure the PSD property of the kernel matrix. The method performs well in terms of classification accuracy for the often-used leukemia data set, but it did not perform as well on other data sets. Furthermore, the feature selection results of this method were poor in that the biologically known motifs for specific data sets were not retrieved in the results.
In order to obtain biologically meaningful results, we focused on the similarity matrix, which is symmetric and can be decomposed into S = X ⋅ P⋅ X T such that is the diagonal matrix of the eigenvalues sorted in ascending order. Here is an orthogonal matrix of the corresponding eigenvectors. The weighted q-gram method deals with the similarity matrix as ST S which is in fact X ⋅ P2 ⋅ X T . To some extent, we may consider different eigenvalues as representing the roles that each q-gram plays in classification. Furthermore, the kernel matrix used in training the SVM should, in principle, involve the similarity matrix S itself rather than ST S . In this context, a negative eigenvalue –λ (λ>0) will then be squared, becoming λ2, the square of its original magnitude. This suggests a possible reason why this method cannot perform well in all of the data sets as the importance of those negative eigenvalues were magnified.
Previous studies have presented methods that attempt to alter the spectrum of an indefinite kernel matrix in order to create a PSD one. Representatives include the denoising method which deems all negative eigenvalues as noise and replaces them with zero [12], the flipping method which flips the sign of negative eigenvalues so as to form a PSD kernel matrix [13], the diffusion method which takes the data distribution into account by replacing the eigenvalues with an exponential form [14], and the shifting method which shifts eigenvalues to ensure the nonnegativity of all the eigenvalues [15]. The LK-method shares some similarity with the flipping method in that negative eigenvalues become the absolute values of themselves. Considering the fact that the denoising method, which neglects the negative eigenvalues, also yields good classification results, we propose a novel method treating eigenvalues in ascending order.
Another problem with the previous model was that even though the weighted q-gram method considered the similarity between two different q-grams, the importance of the q-grams in the context of the whole glycan structures themselves was not taken into account. From a biological perspective, the variability of the sugars near the leaves is larger than those near the root [5]. Thus, employing the similarity matrix developed by the LK-method, we developed a biochemically-weighted kernel (BioLK-method) utilizing biological knowledge by adding weight based on the layer information li of q-grams with while e α l i ensuring the PSD property of the similarity matrix.
The effectiveness of our BioLK-method was then compared with the LK-method, the representative of the weighted q-gram method in terms of predictive performance of glycan classification and motif extraction. Our newly developed method exhibited comparable classification performance, if not better, with the LK-method. Moreover, our new method could capture biologically meaningful glycan substructures through feature selection while the LK-method failed to do so.
Methodology
Our work incorporates two innovations. The first one is to perform a delicate transformation on the non-PSD similarity matrix constructed in one of the representatives of the weighted q-gram method: the LK-method. The second is to incorporate existing biological information when computing the kernel matrix. Major contribution of this paper is to propose a biologically significant kernel that is robust in classification as well as in motif selection. We first describe the similarity matrix construction method used for the LK-method that considers the similarity of layers, monosaccharides, glycosidic bonds and geometric tree structures among the q-grams. Based on the existing similarity matrix, a PSD similarity matrix using techniques of spectrum transformation is created. We further develop the novel kernel by combining the biological importance of different q-grams. Different experiments of binary classification and feature selection are performed on the new kernel with SVMs (See supplementary material for detailed description).
Discussion
Materials:
Three sets of glycan data are used to evaluate the classification and feature selection performance of our developed method. They are illustrated in (Table 1, see supplementary material). Glycan structures in two of the data sets are retrieved from the KEGG/GLYCAN database [1] with annotations from the CarbBank/CCSD database [16]. One pertains to leukemia consisting of 355 structures originating from four human blood components: leukemic cells, erythrocytes, serum and plasma, containing 162, 111, 85 and 73 examples respectively. Another data set pertains to cystic fibrosis, containing 89 glycans related to cystic fibrosis, 107 related to respiratory mucin and 101 related to bronchial mucin. For these leukemia and cystic data sets, the total number of glycans is not the sum of each subclass because some glycans belong to several classes. In order to assess the generality of our kernel method in extracting meaningful substructures, we further utilized another data set obtained from the CFG [2]. We obtained O-linked and N-linked glycan profile data extracted from the brain of mouse strain C57BL/6 (Mouse Strain, http://www.functionalglycomics.org/glycomics/common/jsp /samples/searchSample.jsp/?templateKey/=1/&12/=Tissue/&operation/=refine), which consisted of 47 structures in Wildtype and 50 structures in FucTIV+VII knockout mice.
Classification and Feature Selection:
The effectiveness of our BioLK-method was evaluated through comparison with the LK-method in terms of performance of both classification and feature selection. Because the BioLKmethod involves the determination ofα beforehand, a program was run to find an optimalα in a statistical sense. The optimalα for the leukemia data set was 0.1, with 0.35 for the mouse data set and 0.85 for the cystic fibrosis data set. These results were consistent with our previous analysis. Since for the leukemia data set, there are in total 6527 features involved, it is very sensitive to largeα , while for the cystic fibrosis data set, which contains only 1260 features, it is reasonable that the optimalα is relatively large. In the mouse data set, the number of features altogether was 4214, and the corresponding optimal also lies in α = 0.35 between.
Classification Performance:
Table's 2-4 lists the performance of the SVM classifier for the LK-method and the BioLK-method as tested on our three data sets. We employed the Area Under the ROC Curve (AUC) measured by five-fold cross-validation run 10 times to evaluate the performance. For each q (q = 1, 2,K,9) , the tables illustrate the average AUC value over the 10 runs with standard deviations. It is clear to see that both LK-method and BioLKmethod show comparable classification performance.
For the leukemia data, the classification performance always achieves accuracy greater than 89%. In the cystic fibrosis data set, the classification accuracy decreases slightly, but still achieves around 80% on average. For q = 9 in this data set, the performance goes down to 53% which is reasonable since this data set is much less complex when compared to the other two data sets, reflecting the fact that the number of features involved in 9-gram classification are few. For the mouse data set, the classification performance is also high, achieving accuracies in the 80% range.
Feature Selection:
Both the direct usage of the similarity matrix and the incorporation of the BioWeight matrix in kernel construction enhance our confidence in extracting accurate features. The effectiveness of our BioLK-method in feature selection is assessed in comparison with the LK-method on the three glycan data sets. Figures 3-5 illustrate the top three features extracted by the LK-method and the BioLK-method. For better illustration, the corresponding figures of the features can be accessed (available with authors).
As shown in Figure 3, the top-scoring features extracted by the BioLK-method is the trimer structure ‘NeuAcα2-3Galβ1- 4GlcNAc’ found at layer 5. This precisely corresponds to the substructure in previous works [5, 6]. The substructure with the second highest score is the monomer structure ‘Neu5Ac’ found at layer 7, which is also consistent with the literature [6]. In contrast, the LK-method captures the features in reverse order. In fact, our results are more reasonable due to the fact that A.cylindracea galectin (ACG) is known to specifically bind to the trimer structure, whereas sialic acid is known to appear in many tumor cells. Thus ‘Neu5Ac’ is considered to be a more generalized result, whereas the trimer is more specific.
Figure 2.
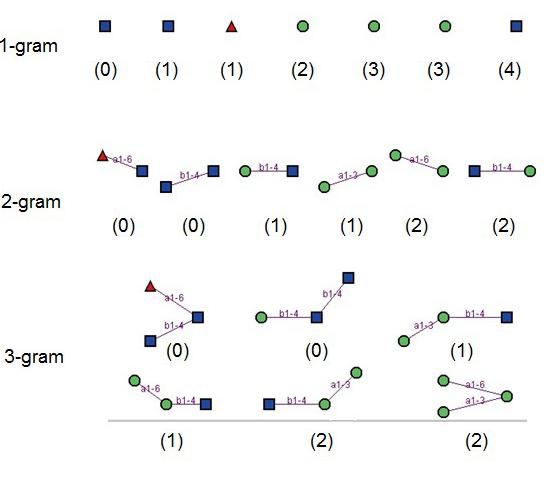
q-gram decomposition of glycan in Figure 1: q=1, 2, 3
Figure 4 lists the top three motif candidates extracted by the LK-method and the BioLK-method in the cystic fibrosis data set. The highest score using the BioLK-method is achieved by a dimer ‘NeuAc2-3Gal’ at layer 2, which is often found at the non-reducing end of glycan structures. Although this is slightly different from the result predicted by [8] which captures this structure as the second highest score, it is acceptable since in their method, information indicating root and leaf nodes is incorporated directly into the q-gram data. Our method is still consistent with the result that the top scoring CF-related structure is α2-3 sialylated structures, which corresponds with the literature [17, 18]. It is also consistent with the result that the top scoring features extracted included monomers and dimers. We note that the top three structures captured by the BioLKmethod are all α2-3 sialylated structures which are consistent with the literature as well. However, the features captured by the LK-method are structures which include the root, which may indicate that it is overfitting to the data. Biologically speaking, one would also assume that the structures at the terminal end, and in particular the non-reducing end, are those that would be considered to be drug targets, as opposed to the larger structures containing common core structures. Indeed, the results of the LK-method all contained a common O-glycan core structure, whereas the BioLK-method extracted the common terminal structure from the non-reducing end of these results.
Figure 4.
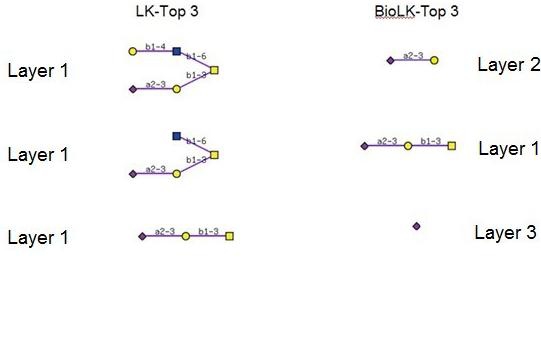
Top 3 features on the cystic dataset. The highest score using the BioLK-method is achieved by a dimmer ‘NeuAcα 2-3Gal’ at layer 2, which is often found at the nonreducing end of glycan structures. The top three structures captured by the BioLK-method are allα 2-3 sialylated structures which are consistent with the literature as well. However, the features captured by the LK-method are structures which include the root, which may indicate that it is overfitting to the data.
In order to show the robustness of our method in feature extraction, we tested it on glycan profile data of mouse brain collected from FucTIV+VII knockout mice, as provided by the CFG. We then compared the feature selection results as performed by the LK-method and the BioLK-method. The top three features extracted by both methods are listed in Figure 5. The feature with the top score extracted by the BioLK-method was ‘NeuAcα 2-3/6Galα 1-4(Fucβ1-3)GlcNAc‘ at layer 5, which is sialyl-Lewis, a previously discovered motif for this sample [2]. On the other hand, the LK-method always captured larger structures from the core. Similarly to the cystic fibrosis sample, the top results of the BioLK-method contained the common non-reducing end structure of the top results of the LK-method, thus indicating that the LK-method is probably overfitting to the data, whereas our method produced precisely the unique substructures (features) of the target data set.
Figure 5.
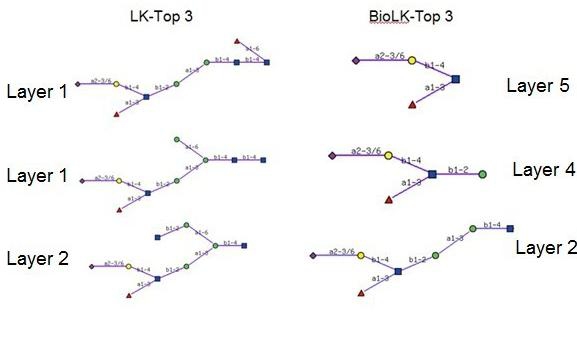
Top 3 features on the mouse_fuc dataset. The feature with the top score extracted by the BioLK-method was ‘NeuAcα 2-3/6Galβ1-4(Fucα1-3)GlcNAc’ at layer 5, which is sialyl-Lewis X, a previously discovered motif for this sample [2]. On the other hand, the LK-method always captured larger structures from the core.
Conclusion
In this work, we developed a new tree kernel based on the linkage kernel constructed using the weighted q-gram method, but we included two major novelties that enabled us to obtain highly accurate results, which previous methods were unable to obtain. First, the techniques of direct usage of the non-PSD similarity matrix to form a positive one largely aided in maintaining the biological properties of the data. Many kernels developed in bioinformatics ignore this important property in kernels, and we show that this is indeed important. Secondly, the incorporation of weighted layer information of q-grams together enables high accuracy in discriminating between classification groups as well as in the correct detection of glycan motifs with flexible size. This confirms the necessity of including weighted layer information of q-grams in order to construct more biologically meaningful tree kernels.
Indeed, our results were shown to correspond well with known glycan motifs obtained through experimental results, whereas the previous methods were unable to obtain the same results. Thus, we claim that our new kernel contributes greatly to the field of glycoinformatics to obtain a greater understanding of glycan functions in various areas of biological research.
Authors contributions
JH came up with the idea. JH and KFA designed the research. KFA gave invaluable suggestions and created q-grams of the data sets. JH performed the research and analyzed the results. WKC supported the provided guidance on how to conduct the research. JH, KFA and WKC wrote the paper. All authors read and approved the final manuscript.
Supplementary material
Figure 1.
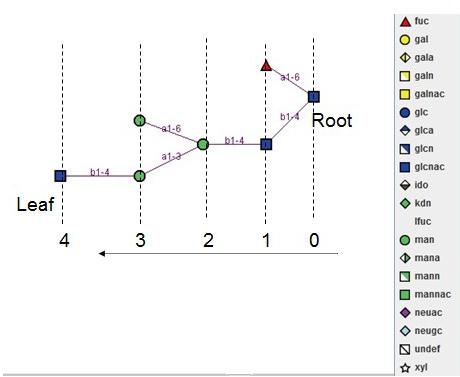
Glycan structure with layer information: Root layer is defined as 0.
Figure 3.
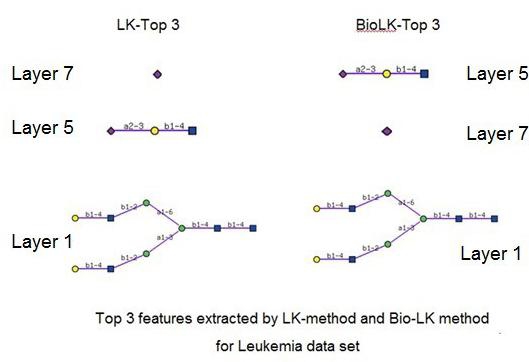
Top 3 features on the leukemia dataset. The topscoring features extracted by the BioLK-method are the trimer structure ‘NeuAcα 2-3Galβ1-4GlcNAc’ found at layer 5. The substructure with the second highest score is the monomer structure ‘Neu5Ac’ found at layer 7. In contrast, the LK-method captures the features in reverse order.
Acknowledgments
Research supported in part by GRF Grant, HKU Strategy Research Theme fund on Computational Sciences, National Natural Science Foundation of China Grant No. 10971075 and Guangdong Provincial Natural Science Grant No. 9151063101000021.
Footnotes
Citation:Jiang et al, Bioinformation 7(8): 405-412 (2011)
References
- 1.K Hashimoto, et al. Glycobiology. 2006;16:63R. doi: 10.1093/glycob/cwj010. [DOI] [PubMed] [Google Scholar]
- 2.S Parry, et al. Glycobiology. 2007;17:646. doi: 10.1093/glycob/cwm024. [DOI] [PubMed] [Google Scholar]
- 3.KF Aoki-Kinoshita, et al. Bioinformatics. 2006;15:e25. [Google Scholar]
- 4.K Hashimoto, et al. ACM Transactions on Knowledge Discovery from Data. 2008;2:6. doi: 10.1145/1342320.1342324. [DOI] [PMC free article] [PubMed] [Google Scholar]
- 5.Y Hizukuri, et al. Carbohydrate Res. 2005;340:2270. doi: 10.1016/j.carres.2005.07.012. [DOI] [PubMed] [Google Scholar]
- 6.Y Yamanishi, et al. Bioinformatics. 2007;23:1211. [Google Scholar]
- 7.T Kuboyama, et al. Information and Media Technologies. 2007;2:292. [Google Scholar]
- 8.T Kuboyama, et al. Genome Inform. 2006;17:25. [Google Scholar]
- 9.LM Li, et al. BMC Bioinformatics. 2010;18:11. doi: 10.1186/1471-2105-11-18. [DOI] [PMC free article] [PubMed] [Google Scholar]
- 10.A Ben-Hur, et al. PLoS Computational Biol. 2008;4:e10000173. [Google Scholar]
- 11.T Hofmann, et al. Annals of Statistics. 2008;36:1171. [Google Scholar]
- 12.E Pekalska, et al. Journal of Machine Learning Research. 2002;2:175. [Google Scholar]
- 13.T Graepel, et al. NIPS. 1999;11:438. [Google Scholar]
- 14.M Neuhaus, et al. Spatial Vision. 2009;22:425. doi: 10.1163/156856809789476119. [DOI] [PubMed] [Google Scholar]
- 15.V Roth, et al. IEEE Trans on PAMI. 2003;25:1540. [Google Scholar]
- 16.S Doubet, P Albersheim. Glycobiology. 1992;2:505. [Google Scholar]
- 17.S Degroote, et al. Glycobiology. 1999;9:1199. [Google Scholar]
- 18.TP Mawhinney, et al. Carbohydrate Res. 1992;235:179. doi: 10.1016/0008-6215(92)80087-h. [DOI] [PubMed] [Google Scholar]
- 19.M Hattori, et al. J Am Chem Soc. 2003;125:11853. [Google Scholar]
- 20.G Wu, et al. Technical Report. UCSB. 2005 [Google Scholar]
Associated Data
This section collects any data citations, data availability statements, or supplementary materials included in this article.


