

Abstract
A popular hypothesis for human running is that gait mechanics and muscular activity are optimized in order to minimize the cost of transport (CoT). Humans running at any particular speed appear to naturally select a stride length that maintains a low CoT when compared with other possible stride lengths. However, it is unknown if the nervous system prioritizes the CoT itself for minimization, or if some other quantity is minimized and a low CoT is a consequential effect. To address this question, we generated predictive computer simulations of running using an anatomically inspired musculoskeletal model and compared the results with data collected from human runners. Three simulations were generated by minimizing the CoT, the total muscle activation or the total muscle stress, respectively. While all the simulations qualitatively resembled real human running, minimizing activation predicted the most realistic joint angles and timing of muscular activity. While minimizing the CoT naturally predicted the lowest CoT, minimizing activation predicted a more realistic CoT in comparison with the experimental mean. The results suggest a potential control strategy centred on muscle activation for economical running.
Keywords: running, optimality, energy
1. Introduction
A popular hypothesis concerning human movement is that natural movement patterns are selected because they coincide with the minimum metabolic cost [1,2]. Metabolic cost can be expressed as the cost of transport (CoT)—the amount of metabolic energy consumed per unit displacement of the body's centre of mass. This hypothesis has ancient origins in the natural sciences, dating at least to Aristotle [3], who noted that nature does nothing uselessly.
In the present work, we evaluated this minimum-energy hypothesis within the context of human running. To run at a particular speed (m s−1), humans can potentially use many different combinations of stride length (m) and stride frequency (s−1; Hz). While it is unclear if the CoT is sensitive to running speed [4–6], the preferred stride length (or frequency) chosen to run at a given speed incurs a low CoT compared with other potential choices [7,8]. This relationship suggests that the CoT governs the selection of stride mechanics in human running, thereby serving as an optimality criterion. However, the CoT itself does not necessarily need to be minimized to produce economical running. The metabolic energy consumed by muscles is a function of many variables, such as the activation level [9], which could also be potentially minimized to incur a relatively low CoT. Thus, it is not clear what specific quantity the neuromuscular system prioritizes for minimization, if minimization of the CoT governs all salient biomechanical features of running, or if any quantity at all is absolutely minimized [10].
Therefore, the purpose of the study was to evaluate a set of potential optimality criteria for human running. Because it is impossible to control, manipulate and quantify potential criteria with in vivo experiments on human runners, we used a computer simulation approach to test three candidate criteria. The simulation results were evaluated against experimental data from experienced human runners who were presumably optimizing the true (but unknown) criterion. Based on previous experimental studies [7,8], we hypothesized that minimizing the CoT would produce the most realistic simulation.
2. Material and methods
We studied the task of running at a steady, submaximal speed over level ground. Our approach was to (i) measure experimental data from experienced human runners, (ii) develop a computer model for simulating human running, (iii) perform a ‘data-tracking’ simulation to establish the model's ability to replicate the salient biomechanical features of human running, and (iv) generate predictive (non-tracking) simulations to investigate optimality criteria.
(a). Experimental data
Experimental data were recorded from a group of 12 adult female runners (mean ± s.d.: age = 27 ± 6 years, height = 1.66 ± 0.05 m, mass = 61 ± 4.7 kg; training = 24.8 ± 6.4 km wk−1). All subjects gave informed written consent prior to participating.
Subjects ran along a level 30 m runway at a self-selected ‘normal and comfortable’ speed. The sagittal angular positions and velocities of the trunk and right hip, knee and ankle were calculated from the coordinates of reflective markers placed on the joint centres [11]. Marker positions were sampled at 200 Hz using an eight-camera optical motion capture system (Oqus 300, Qualisys, Gothenburg, Sweden). Ground reaction forces (GRFs) were sampled at 2000 Hz from a strain gauge force platform (OR6-5, AMTI, Watertown, MA, USA) located near the centre of the runway. Electromyograms (EMGs) were sampled at 2000 Hz from seven muscles of the right leg (gluteus maximus, vastus lateralis, tibialis anterior, soleus, rectus femoris, biceps femoris (long head), medial gastrocnemius; [12]) using bipolar surface electrodes and a portable data-logging unit worn by the subject (Myomonitor 4, Delsys, Boston, MA, USA). EMG linear envelopes were calculated by applying sequentially a bandpass filter (20–300 Hz), full wave rectification and a recursive lowpass filter (10 Hz), followed by scaling to amplitudes from maximum isometric contractions. One full stride was recorded in each of five trials per subject. Data were averaged over trials and then over subjects.
During treadmill running at the same speed as their overground trials (±0.1 m s−1), oxygen and carbon dioxide exchange rates were measured using a metabolic cart (TrueOne 2400, ParvoMedics, Sandy, UT, USA). Gross rates of metabolic energy consumption were computed from the gas exchange data, by considering the respiratory exchange ratio [13]. The CoT was calculated by dividing the gross metabolic rate by the running speed.
(b). Musculoskeletal model
A two-dimensional (sagittal plane) forward dynamics model of the human musculo-skeletal system was developed in the form of a Fortran computer program (figure 1). The skeleton had nine rigid segments (trunk and bilateral thigh, shank, foot and toes) connected at the hip, knee, ankle and metatarsophalangeal (MTP) joints. Joint ranges of motion were softly constrained by torsional spring-dampers representing the passive elastic characteristics of joint structures [14]. GRFs were generated by three contact elements beneath the heel, toe and MTP joints. Each element generated a vertical force as a nonlinear spring-damper [15] and a horizontal force as a Coulomb friction approximation [16]. A vertical sinusoidal force on the upper trunk represented the supportive effect of arm swing [17].
Figure 1.

Schematic of the musculoskeletal model. Swing leg muscles are not shown.
Each leg was actuated by nine Hill-based models of skeletal muscle [18] (iliopsoas, glutei, rectus femoris, vasti, biceps femoris (short head), hamstrings, tibialis anterior, soleus and gastrocnemius) with geometry, activation and contractile dynamics as described earlier [19]. The metabolic energy consumed by each muscle model was calculated using equations that predict the Hill model's thermal and mechanical energy liberation, motivated by observations on muscles in humans and other mammals, and comparisons between simulated and measured metabolic data [20,21]. The entire model's gross metabolic energy rate was the sum of the muscle rates, plus the average measured rate while subjects stood upright and swung their arms at the step frequency from the running trials (1.93 W kg−1).
Each muscle was controlled by a neural excitation signal that was a piecewise linear function of 21 nodal values spaced evenly over the stride time [22]. To ensure periodicity, the 21st node was assigned the same value as the first node. Left leg excitations were identical to the right leg excitations but phase-shifted by half the stride duration.
The model's parameters were derived primarily from measurements on the human subjects, and in some cases from human or cadaver data in other studies. A description of the parameter assignments is presented in the electronic supplementary material. Additional details on the model and the simulations are available in the study of Miller [23].
(c). Simulations
Simulations of one stride were generated by optimizing the model's control variables to minimize an objective function J. The 191 control variables were the nodal right leg muscle excitations (9 × 20 = 180), seven initial angular velocities (MTP joint velocities were assumed to be zero), the amplitude and phase shift of the arm swing force, the angular stiffness of the MTP joints and the stride duration. The objective function was:
where OCi is one of four optimality criteria and the other right-hand side terms are penalty terms. ɛθ and ɛω are the sums of the squared differences between the initial and final segment angular positions and velocities, respectively, and encouraged periodic kinematic states. ɛpas is the sum of the squared passive joint moment integrals, and discouraged extreme joint angles. The penalty weighting coefficients were adjusted in preliminary simulations and set to the smallest values that produced a stride that was periodic to within 5° and 30° s−1 on average. To reduce computational time, one stride was reconstructed from simulations of one step by assuming bilateral symmetry [23].
The first simulation used a data-tracking approach, with OC0 defined as the average ‘tracking error’ between the simulated and mean experimental hip, knee, and ankle angles and horizontal and vertical GRFs:
where  and
and  are the values of simulated and mean experimental variable i at timestep j. SDi is the between-subjects standard deviation of variable i averaged over one stride, and n is the number of data points per stride. For this simulation, the stride duration was set to the average of the human runners (0.690 s).
The second set of simulations used a ‘predictive’ approach. No experimental data were tracked, although the data-tracking solution was used as an initial guess for the control variables. We evaluated three different optimality criteria that were selected based on their prevalence in previous studies for predicting optimal human movements and muscle forces during locomotion (e.g. [15,21,24,25]). Criterion 1 was the CoT:
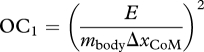 |
where E is the gross energy expenditure, mbody is the mass of the model (61 kg) and ΔxCoM is the change in horizontal position of the model's centre of mass. The rationale for this criterion is that humans appear to maintain a low CoT by running with a preferred stride kinematics [7].
Criterion 2 was based on muscle activations:
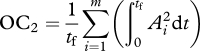 |
where Ai(t) is the time-varying activation of the ith muscle in an m-muscle system, and tf is the stride duration. This criterion is based the concept that low activations avoid fatiguing any one muscle, regardless of its size and strength [15]. Division by tf discourages the use of high stride frequencies just to reduce the activation integrals. The optimal muscle activations predicted by different non-unity integer powers within this criterion (e.g.  ,
,  ,
,  ) are generally similar when compared with solutions predicted by different criteria [15].
Criterion 3 was based on muscle stresses:
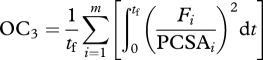 |
where Fi(t) is the force in the ith muscle and PCSAi is its physiological cross-sectional area [26]. The rationale for this criterion is based on empirical evidence that the sustainable time under tension is a nonlinear function of the relative muscle force, and that maximum muscle force is a function of the PCSA [27]. Similar to criterion 2, the patterns of optimal muscle forces are not highly sensitive to the choice of stress squared, cubed, etc. [25,27]. These three predictive simulations will be referred to as MinCoT, MinAct and MinStress, respectively. All optimality criteria were scaled so that their magnitudes were approximately equal to that of the data-tracking solution, giving the penalty terms similar effects on each simulation's solution domain.
The initial segment positions and velocities were taken from the mean experimental data at the last timestep before right heel-strike. The initial angular velocities and the stride duration were allowed to vary within 1 s.d. of the means. The initial muscle activations were calculated by solving the activation dynamics over the time for one stride. Initial contractile component lengths were calculated assuming an isometric state. The metatarsal joint stiffness could not exceed 300 Nm rad−1, and the arm swing force amplitude could not exceed 25 per cent of the model's weight.
The control variables were optimized using a parallel-simulated annealing algorithm [28] on a cluster of eight 3 GHz CPUs (Pentium 4, Intel, Santa Clara, CA, USA). Optimizations were terminated when 100 000 evaluations did not improve the optimal solution by 1 per cent, which required a total of 500–600 CPU hours per simulation.
(d). Evaluation
The simulations were evaluated by comparing their mechanical and metabolic outputs with the means of the analogous experimental data. To enable comparisons of variables with different dimensions, deviations were expressed in multiples of the between-subjects standard deviation of the experimental data. Temporal similarity between the simulated muscle activations and the EMG linear envelopes was assessed by zero-lag cross-correlations. The simulation that overall most closely matched the experimental data based on these comparisons was deemed the most accurate.
3. Results
(a). Human running
The human subjects ran at an average speed (mean ± s.d.) of 3.80 ± 0.50 m s−1, using a stride length of 2.61 ± 0.27 m and a stride frequency of 1.45 ± 0.08 Hz. The average CoT was 4.24 ± 0.90 J m−1 kg−1.
(b). Data-tracking simulation
The data-tracking simulation matched the mean joint angle and GRF profiles of the human subjects to within 1.3 s.d. on average (1.0, 0.9 and 0.6 s.d. for the hip, knee and ankle angles, respectively; 2.2 and 1.6 s.d. for the horizontal and vertical GRFs). This accuracy is comparable with other similar tracking simulations (e.g. [29]). The tracking simulation ran at 3.76 m s−1 with a stride length of 2.59 m. Both values were within 0.1 s.d. of the experimental means even though neither variable was explicitly tracked. However, the tracking simulation expended metabolic energy at an unrealistically high rate (9.8 J m−1 kg−1, 6.2 s.d. above the mean).
(c). Predictive simulations
All three simulations visually resembled real human running (see electronic supplementary material for animations) and ran at speeds within 0.3 s.d. of the human subjects mean (range: 3.64–3.67 m s−1). Stride lengths, stride frequencies and costs of transport for all three simulations were within 1 s.d. of the experimental means (figure 2). The CoT for MinAct (4.4 J m−1 kg−1, +0.3 s.d.) was closest to the human mean, followed by MinStress (4.7 J m−1 kg−1, +0.5 s.d.) and MinCoT (3.6 J m−1 kg−1, −0.7 s.d.).
Figure 2.

(a) Speeds, (b,c) stride parameters and (d) costs of transport (CoT) for the human subjects and the simulations. Error bars are 1 s.d. between subjects.
For the joint angles and GRFs (figure 3), root mean squared errors (r.m.s.e.) between the simulated and mean experimental data were calculated. Root mean squared errors for the hip, knee and ankle angles were 1.0, 1.3 and 1.5 s.d. for MinCoT; 0.9, 0.8 and 0.8 s.d. for MinAct; and 1.6, 0.7 and 1.3 s.d. for MinStress. Differences appeared mainly in the swing phase. The peak hip flexion angle in mid-swing (60–80% of the stride) was 14° smaller for MinStress than for MinAct and MinCoT. MinStress flexed the hip in late swing (90–100% of the stride), while MinAct and MinCoT extended the hip. The peak knee flexion angle in mid-swing was 16° smaller for MinCoT than for MinAct and MinStress. The peak angle dorsiflexion angle in swing was 9° smaller for MinCoT than for MinAct and MinStress. In contrast, peak joint angles during stance differed by less than 5°. The GRFs in the predictive simulations (figure 3) were less realistic than the joint angles, mainly due to the stance durations (31% of the stride on average) that were briefer than the human subjects (38 ± 5%). Root mean squared errors for the horizontal and vertical GRFs were 2.8 and 4.8 s.d. for MinCoT, 3.2 and 4.3 s.d. for MinAct, and 2.7 and 5.1 s.d. for MinStress. The average vertical GRF was within 1.5 per cent of the body weight for all simulations, owing to small aperiodic deviations in the kinematics.
Figure 3.

(a) Joint angles and (b) GRFs from the tracking and predictive simulations. Shaded areas are two between-subjects standard deviations around the mean of the human subjects (μ ± 2σ). Vertical dashed lines indicate toe-off. Thick solid line, track; Circles, MinCoT; triangles, MinAct; squares, MinStress.
The predictive simulations in general had lower magnitudes of muscle excitations and activations than the tracking simulation (figure 4). Cross-correlations between the muscle activations and the EMG linear envelopes averaged 0.58 ± 0.36, 0.67 ± 0.36 and 0.59 ± 0.39 for MinCoT, MinAct and MinStress, respectively. For comparison, cross-correlations for the linear envelopes between the human subjects (i.e. each subject compared with every other subject) averaged 0.65 ± 0.35. In all three predictive simulations, the lowest cross-correlation was for rectus femoris (average: 0.16) and the highest were for the plantarflexors (average: 0.94). The data-tracking simulation excited all muscles to at least 97 per cent (permitted ranges were 0–100%) at some point during the stride, while the predictive simulations excited only two to four muscles above 80 per cent. The peak stance phase activation of vasti was greater for MinAct (62%) than for MinCoT (49%) and MinStress (24%). Compared with MinAct and MinStress, MinCoT avoided activating the large thigh muscles (vasti and hamstrings) during swing, and avoided using soleus to position the foot for heel-strike in late swing. MinCoT also had shorter durations of activation for iliopsoas from late stance to mid-swing and for hamstrings in stance. MinAct and MinStress featured similar muscle-activation strategies, although MinStress had higher tibialis anterior activations in mid-swing and extended the hip in late swing with both hamstrings and glutei, while MinAct primarily used hamstrings.
Figure 4.

Optimized muscle excitations (thin lines) and activations (thick lines) from the simulations compared with EMG linear envelopes (dashed lines). ILP, iliopsoas; GLU, glutei; VAS, vasti; BF, biceps femoris; TA, tibialis anterior; SOL, soleus; RF, rectus femoris; HAM, hamstrings; GAS, gastrocnemius. The stride begins and ends at heel-strike. Vertical dashed lines indicate toe-off. No EMG data were available for ILP and BF.
4. Discussion
It has been suggested that humans run in a way that minimizes the CoT [30]. To date, this theory has been motivated primarily by measurements on humans running under various natural and perturbed conditions [6–8]. However, the present simulations indicate that a variety of variables can be minimized to incur a realistically low CoT, even if the CoT itself is not explicitly minimized. All three predictive simulations had CoTs well within the range of values for the human runners. Although different optimality criteria predicted different running mechanics (figure 3), differences were generally within the range of the observed human performances, indicating that multiple different optimality criteria can predict reasonably realistic running motions. Therefore, the hypothesis that minimizing the CoT would result in the most realistic simulation was not supported.
While none of the predictive simulations deviated dramatically from the salient features of human running (figures 2 and 3), minimizing muscle activations (MinAct) predicted the hip, knee and ankle angles, CoT and muscle activity timing that were closest to the mean values of the experimental data. Most of the kinematic differences in the simulations appeared in the swing phase (figure 3), which may seem paradoxical if the metabolic cost of the swing phase is presumed to be minimal. However, recent studies have suggested that the cost of leg swing in locomotion comprises a substantial portion (up to 30%) of the total metabolic cost [21,31,32]. The body is also less mechanically constrained during swing, affording more freedom of motion. The brief stance period is the only opportunity to generate forces offsetting the gravitational force, which may limit the range of possible kinematic strategies.
Although we did not evaluate an exhaustive set of potential optimality criteria, these results suggest that maintaining low levels of muscle activation is an important priority of the neuromuscular system for running. Recent simulations of walking reached a similar conclusion [15], but did not evaluate metabolic energy consumption or make comparisons with data from walking humans. We cannot state conclusively that optimal human running is consistent with minimum activation rather than minimum metabolic cost. However, the results demonstrate the potential for economical running (i.e. a relatively low CoT) through targeted modulation of factors other than the CoT itself. While minimal metabolic cost is a commonly cited criterion for human movement (e.g. [1,2,30]), examples from the literature suggest that preferred motion patterns are not always consistent with strategies predicted by minimizing metabolic energy consumption [33–35]. It may be that a MinCoT strategy is held in reserve for ‘survival’ situations where extremely low energy expenditure is needed. Although the CoTs for both the MinAct and MinCoT simulations were statistically within the range of the experimental data, their difference (0.8 J m−1 kg−1) is quite large from a biological perspective. For a given caloric allowance (say 1000 kcal), the running model could travel nearly 20 per cent further with the MinCoT strategy (19.2 km) than the MinAct strategy (15.4 km). It is difficult to evaluate these model-based predictions empirically because muscle activation is largely a conceptual variable that cannot easily be measured in vivo [36], although it could perhaps be computed for selected muscles from EMG data [37]. Alternatively, subjects could be trained to run with the kinematic features predicted by the simulations (figure 3) while measuring changes in the metabolic cost.
All of our subjects were recreationally active runners who were well accustomed to treadmill running, and had participated in similar laboratory experiments previously. Even so, a potential confounding factor is our use of treadmill-based metabolic data in comparison with simulations of overground running. There is surprisingly little evidence on the metabolic costs of overground and treadmill locomotion. Heart rates during overground and treadmill walking are similar [38,39]. Morgan et al. [33] argued that treadmill running underestimates the metabolic cost of overground running, which would shift our metabolic results further in favour of the MinAct and MinStress simulations.
Differences between MinAct and MinStress were relatively small in comparison to differences with MinCoT, suggesting that maintaining low mechanical stresses of the muscles are also an important control priority for human running. Both MinAct and MinStress weigh all muscles equally in the objective function as activation and stress vary over the same range for all muscles. MinCoT places more emphasis on larger muscles that consume more energy. Although MinAct was quantitatively more realistic than MinStress in comparison with the experimental data, in reality, the central nervous system (CNS) may consider multiple simultaneous criteria for controlling running dynamics. It presumably has knowledge of muscle activation resulting from motor unit recruitment and rate-coding, and may also have knowledge of muscle stress. Tendon force is presumably known from Golgi tendon organs, but muscle stress would require internal representations of physiological cross-sectional areas. Calculating the CoT in the simulations required the metabolic rate of each muscle and the speed of the centre of mass. It seems unlikely that the CNS performs this same calculation based on the sheer number of variables and parameters needed, but it may not need explicit knowledge of all these quantities to modulate the CoT. For example, the whole-body metabolic rate correlates fairly well with perceived exertion [40], which the nervous system could use to calculate an analogous CoT if the speed of the centre of mass was known. Some modulation could also take place at the peripheral level, without direct involvement of CNS.
In the predictive simulations, the stance duration was on average 1.4 s.d. shorter than the mean of the human subjects, requiring vertical GRF peaks 2.5 s.d. above the mean to provide the necessary vertical impulse. Although these deviations are still within the statistical range of the human population (approx. 3 s.d.), the GRFs were visually and quantitatively less realistic than other simulated variables. Other predictive simulations of human running have had similar issues with short stance times [41,42]. The model is capable of generating more realistic GRF with its existing dynamics, as seen in the data-tracking simulation (figure 3). We elected not to penalize these GRF deviations in the predictive simulations because there is no convincing evidence that running humans optimize their gait on these features. Future work will investigate model adjustments (e.g. foot-floor contact model) needed to produce more realistic GRFs without penalty functions, and the corresponding effects on metabolic cost and other relevant criteria.
In addition to the pure scientific interest of assessing the optimality criterion for human running, the predictive simulation approach may also be useful for future applied work. Predictive simulation has long been promoted as a method for improving human health and performance [43], but reports of applications and actual results to this end are scarce [44]. Many runners are frequently affected by debilitating musculoskeletal injuries that prevent them from obtaining the health benefits of running or optimal race performances. Predictive simulations could be useful in the future for theoretically testing the effects of various training interventions (e.g. muscular strength and power, weight loss, technique adjustments) on musculoskeletal loading, injury potential and performance limits.
A final point relates to data-tracking, which is a common approach for generating simulations of human movement [19,45,46]. Although the joint angles and GRFs of the tracking simulation were the most accurate in this study, the metabolic energy rate was extremely high and unrealistic. Large amounts of energy were expended because of near-maximal activation of most muscles and high amounts of antagonistic co-activation (figure 4). Antagonism allows for a greater degree of control over shaping the joint torques to reduce the tracking error, but exacts an unrealistically high metabolic cost. Muscle-actuated tracking simulations should include a mechanism to avoid over-estimating antagonistic co-activation [46] and metabolic energy expenditure. Even if energy expenditure is not directly related to the research questions, a model of muscle energy expenditure [20] is still useful for comparisons with human metabolic data.
In conclusion, simulations of human running were sensitive to the form of the optimality criterion defined as a movement objective. A tracking simulation established the ability of the model to run with realistic mechanics, but over-estimated metabolic energy expenditure. Minimizing muscle activations predicted the metabolic cost and joint motions closest to the average values measured from human subjects. These simulations suggest that minimizing the total amount of muscle activation in the lower limb is an important priority of the neuromuscular system during running, and indicates the potential for economical running to arise from prioritized minimization of quantities other than the CoT itself.
Acknowledgements
All protocols were approved by the University of Massachusetts Amherst institutional review board.
References
- 1.Nubar Y., Contini R. 1961. A minimal principle in biomechanics. Bull. Math. Biophys. 23, 377–391 10.1007/BF02476493 (doi:10.1007/BF02476493) [DOI] [Google Scholar]
- 2.Sparrow W. A., Newell K. M. 1998. Metabolic energy expenditure and the regulation of movement economy. Psych. Bull. Rev. 5, 173–196 10.3758/BF03212943 (doi:10.3758/BF03212943) [DOI] [Google Scholar]
- 3.Barker E. 1962. The politics of Aristotle. London, UK: Oxford University Press [Google Scholar]
- 4.Margaria R., Cerretelli P., Aghemo P., Sassi G. 1963. Energy cost of running. J. Appl. Physiol. 18, 367–370 [DOI] [PubMed] [Google Scholar]
- 5.Mayhew J. L. 1977. Oxygen cost and energy expenditure of running in trained runners. Br. J. Sports Med. 11, 116–121 10.1136/bjsm.11.3.116 (doi:10.1136/bjsm.11.3.116) [DOI] [PMC free article] [PubMed] [Google Scholar]
- 6.Steudel-Numbers K. L., Wall-Scheffler C. M. 2009. Optimal running speed and the evolution of hominin hunting strategies. J. Hum. Evol. 56, 355–360 10.1016/j.jhevol.2008.11.002 (doi:10.1016/j.jhevol.2008.11.002) [DOI] [PubMed] [Google Scholar]
- 7.Högberg P. 1952. How do stride length and stride frequency influence the energy-output during running? Eur. J. Appl. Physiol. 14, 437–441 10.1007/BF00934423 (doi:10.1007/BF00934423) [DOI] [PubMed] [Google Scholar]
- 8.Gutmann A. K., Jacobi B., Butcher M. T., Bertram J. E. 2006. Constrained optimization in human running. J. Exp. Biol. 209, 622–632 10.1242/jeb.02010 (doi:10.1242/jeb.02010) [DOI] [PubMed] [Google Scholar]
- 9.Mommaerts W. F. H. M. 1969. Energetics of muscular contraction. Physiol. Rev. 49, 427–508 [DOI] [PubMed] [Google Scholar]
- 10.Neptune R. R., Hull M. L. 1999. A theoretical analysis of preferred pedaling rate selection in endurance cycling. J. Biomech. 32, 409–415 10.1016/S0021-9290(98)00182-1 (doi:10.1016/S0021-9290(98)00182-1) [DOI] [PubMed] [Google Scholar]
- 11.Winter D. A. 1983. Moments of force and mechanical power in jogging. J. Biomech. 16, 91–97 10.1016/0021-9290(83)90050-7 (doi:10.1016/0021-9290(83)90050-7) [DOI] [PubMed] [Google Scholar]
- 12.Hermens H. J., Freriks B., Disselhorst-Klug C., Rau G. 2000. Development of recommendations for SEMG sensors and sensor placement procedures. J. Electrom. Kines. 10, 361–374 10.1016/S1050-6411(00)00027-4 (doi:10.1016/S1050-6411(00)00027-4) [DOI] [PubMed] [Google Scholar]
- 13.Weir J. B. 1949. New methods for calculating metabolic rate with special reference to protein metabolism. J. Physiol. 109, 1–9 [DOI] [PMC free article] [PubMed] [Google Scholar]
- 14.Riener R., Edrich T. 1999. Identification of passive elastic joint moments in the lower extremities. J. Biomech. 32, 539–544 10.1016/S0021-9290(99)00009-3 (doi:10.1016/S0021-9290(99)00009-3) [DOI] [PubMed] [Google Scholar]
- 15.Ackermann M., van den Bogert A. J. 2010. Optimality principles for model-based prediction of human gait. J. Biomech. 43, 1055–1060 10.1016/j.jbiomech.2009.12.012 (doi:10.1016/j.jbiomech.2009.12.012) [DOI] [PMC free article] [PubMed] [Google Scholar]
- 16.Song P., Kraus P., Kumar V., Dupont P. 2001. Analysis of rigid-body dynamic models for simulation of systems with frictional contacts. J. Appl. Mech. 68, 118–128 10.1115/1.1331060 (doi:10.1115/1.1331060) [DOI] [Google Scholar]
- 17.Miller R. H., Caldwell G. E., van Emmerik R. E. A., Umberger B. R., Hamill J. 2009. Ground reaction forces and lower extremity kinematics when running with suppressed arm swing. J. Biomech. Eng. 131, 124502. 10.1115/1.4000088 (doi:10.1115/1.4000088) [DOI] [PubMed] [Google Scholar]
- 18.Hill A. V. 1938. The heat of shortening and the dynamic constants of muscle. Proc. R. Soc. Lond. B 126, 136–195 10.1098/rspb.1938.0050 (doi:10.1098/rspb.1938.0050) [DOI] [Google Scholar]
- 19.Miller R. H., Hamill J. 2009. Computer simulation of the effects of shoe cushioning on internal and external loading during running impacts. Comp. Meth. Biomech. Biomed. Eng. 12, 481–490 10.1080/10255840802695437 (doi:10.1080/10255840802695437) [DOI] [PubMed] [Google Scholar]
- 20.Umberger B. R., Gerritsen K. G. M., Martin P. E. 2003. A model of human muscle energy expenditure. Comp. Meth. Biomech. Biomed. Eng. 6, 99–111 10.1080/1025584031000091678 (doi:10.1080/1025584031000091678) [DOI] [PubMed] [Google Scholar]
- 21.Umberger B. R. 2010. Stance and swing phase costs in human walking. J. R. Soc. Interface 7, 1329–1340 10.1098/rsif.2010.0084 (doi:10.1098/rsif.2010.0084) [DOI] [PMC free article] [PubMed] [Google Scholar]
- 22.Pandy M. G., Anderson F. C., Hull D. G. 1992. A parameter optimization approach for the optimal control of large-scale musculoskeletal systems. J. Biomech. Eng. 114, 450–460 10.1115/1.2894094 (doi:10.1115/1.2894094) [DOI] [PubMed] [Google Scholar]
- 23.Miller R. H. 2011. Optimal control of human running. Open-Access Dissertations 421 See http://scholarworks.umass.edu/open_access_dissertations/421 [Google Scholar]
- 24.Anderson F. C., Pandy M. G. 2001. Dynamic optimization of human walking. J. Biomech. Eng. 123, 381–390 10.1115/1.1392310 (doi:10.1115/1.1392310) [DOI] [PubMed] [Google Scholar]
- 25.Glitsch U., Baumann W. 1997. The three-dimensional determination of internal loads in the lower extremity. J. Biomech. 30, 1123–1131 10.1016/S0021-9290(97)00089-4 (doi:10.1016/S0021-9290(97)00089-4) [DOI] [PubMed] [Google Scholar]
- 26.Haxton H. A. 1944. The absolute muscle force in the ankle flexors of man. J. Physiol. 103, 267–273 [DOI] [PMC free article] [PubMed] [Google Scholar]
- 27.Crowninshield R. D., Brand R. A. 1981. A physiologically based criterion of muscle force prediction in locomotion. J. Biomech. 14, 793–801 10.1016/0021-9290(81)90035-X (doi:10.1016/0021-9290(81)90035-X) [DOI] [PubMed] [Google Scholar]
- 28.Higginson J. S., Neptune R. R., Anderson F. C. 2005. Simulated parallel annealing within a neighborhood for optimization of biomechanical systems. J. Biomech. 38, 1938–1942 10.1016/j.jbiomech.2004.08.010 (doi:10.1016/j.jbiomech.2004.08.010) [DOI] [PubMed] [Google Scholar]
- 29.Sasaki K. 2010. Muscle contributions to the tibiofemoral joint contact force during running. Biomed. Sci. Instrum. 46, 305–310 [PubMed] [Google Scholar]
- 30.Srinivasan M. 2009. Optimal speeds for walking and running, and walking on a moving walkway. Chaos 19, 026112. 10.1063/1.3141428 (doi:10.1063/1.3141428) [DOI] [PubMed] [Google Scholar]
- 31.Marsh R. L., Ellerby D. J., Carr J. A., Henry H. T., Buchanan C. I. 2004. Partitioning the energetics of walking and running: swinging the limbs is expensive. Science 303, 80–83 10.1126/science.1090704 (doi:10.1126/science.1090704) [DOI] [PubMed] [Google Scholar]
- 32.Modica J. R., Kram R. 2005. Metabolic energy and muscle activity required for leg swing in running. J. Appl. Physiol. 98, 2126–2131 10.1152/japplphysiol.00511.2004 (doi:10.1152/japplphysiol.00511.2004) [DOI] [PubMed] [Google Scholar]
- 33.Morgan D., Martin P., Craib M., Caruso C., Clifton R., Hopewell R. 1994. Effect of step length optimization on the aerobic demand of running. J. Appl. Physiol. 77, 245–251 [DOI] [PubMed] [Google Scholar]
- 34.Hunter L. C., Hendrix E. C., Dean J. C. 2010. The cost of walking downhill: is the preferred gait energetically optimal? J. Biomech. 43, 1910–1915 10.1016/j.jbiomech.2010.03.030 (doi:10.1016/j.jbiomech.2010.03.030) [DOI] [PubMed] [Google Scholar]
- 35.Kistemaker D. A., Wong J. D., Gribble P. L. 2010. The central nervous system does not minimize energy cost in arm movements. J. Neurophys. 104, 2985–2994 10.1152/jn.00483.2010 (doi:10.1152/jn.00483.2010) [DOI] [PubMed] [Google Scholar]
- 36.Gasser H. S., Hill A. V. 1924. The dynamics of muscular contraction. Proc. R. Soc. Lond. B 96, 398–437 10.1098/rspb.1924.0035 (doi:10.1098/rspb.1924.0035) [DOI] [Google Scholar]
- 37.Hof A. L. 1984. EMG and muscle force: an introduction. Hum. Mov. Sci. 3, 119–153 10.1016/0167-9457(84)90008-3 (doi:10.1016/0167-9457(84)90008-3) [DOI] [Google Scholar]
- 38.Murray M. P., Spurr G. B., Sepic S. B., Gardner G. M., Mollinger L. A. 1985. Treadmill vs. floor walking: kinematics, electromyogram, and heart rate. J. Appl. Physiol. 59, 87–91 [DOI] [PubMed] [Google Scholar]
- 39.Grieg C., Butler F., Skelton D., Mahmud S., Young A. 1993. Treadmill walking in old age may not reproduce the real life situation. J. Am. Geriat. Soc. 41, 15–18 [DOI] [PubMed] [Google Scholar]
- 40.Utter A. C., Robertson R. J., Green J. M., Suminski R. R., McAnulty S. R., Nieman D. C. 2004. Validation of the adult OMNI scale of perceived exertion for walking/running exercise. Med. Sci. Sports Exerc. 36, 1776–1780 10.1249/01.MSS.0000128164.19223.D9 (doi:10.1249/01.MSS.0000128164.19223.D9) [DOI] [PubMed] [Google Scholar]
- 41.Sellers W. I., Pataky T. C., Caravaggi P., Crompton R. H. 2010. Evolutionary robotics approaches in primate gait analysis. Int. J. Primat. 31, 321–338 10.1007/s10764-010-9396-4 (doi:10.1007/s10764-010-9396-4) [DOI] [Google Scholar]
- 42.Hase K., Yokoi T. 2002. Computer simulation study of human locomotion with a three-dimensional entire-body neuro-musculo-skeletal model—IV: Simulation of running motion and its transition process. Jpn. Soc. Mech. Eng. Int. J. C 45, 1065–1072 [Google Scholar]
- 43.Chow C. K., Jacobson D. H. 1971. Studies of human locomotion via optimal programming. Math. Biosci. 10, 239–306 10.1016/0025-5564(71)90062-9 (doi:10.1016/0025-5564(71)90062-9) [DOI] [Google Scholar]
- 44.Hatze H. 1983. Computerized optimization of sports motions: an overview of possibilities, methods and recent developments. Sports Sci. 1, 3–12 10.1080/02640418308729656 (doi:10.1080/02640418308729656) [DOI] [Google Scholar]
- 45.Mahboobin A., Cham R., Piazza S. J. 2010. The impact of a systematic reduction in show-floor friction on heel contact walking kinematics—a gait simulation approach. J. Biomech. 43, 1532–1539 10.1016/j.jbiomech.2010.01.040 (doi:10.1016/j.jbiomech.2010.01.040) [DOI] [PubMed] [Google Scholar]
- 46.Neptune R. R., McGowan C. P. 2011. Muscle contributions to whole-body sagittal plane angular momentum during walking. J. Biomech. 44, 6–12 10.1016/j.jbiomech.2010.08.015 (doi:10.1016/j.jbiomech.2010.08.015) [DOI] [PMC free article] [PubMed] [Google Scholar]