

Abstract
Two-photon probe excitation data are commonly presented as absorption cross section or molecular brightness (the detected fluorescence rate per molecule). We report two-photon molecular brightness spectra for a diverse set of organic and genetically encoded probes with an automated spectroscopic system based on fluorescence correlation spectroscopy. The two-photon action cross section can be extracted from molecular brightness measurements at low excitation intensities, while peak molecular brightness (the maximum molecular brightness with increasing excitation intensity) is measured at higher intensities at which probe photophysical effects become significant. The spectral shape of these two parameters was similar across all dye families tested. Peak molecular brightness spectra, which can be obtained rapidly and with reduced experimental complexity, can thus serve as a first-order approximation to cross-section spectra in determining optimal wavelengths for two-photon excitation, while providing additional information pertaining to probe photostability. The data shown should assist in probe choice and experimental design for multiphoton microscopy studies. Further, we show that, by the addition of a passive pulse splitter, nonlinear bleaching can be reduced—resulting in an enhancement of the fluorescence signal in fluorescence correlation spectroscopy by a factor of two. This increase in fluorescence signal, together with the observed resemblance of action cross section and peak brightness spectra, suggests higher-order photobleaching pathways for two-photon excitation.
Introduction
Multiphoton fluorescence microscopy has had profound implications for the investigation of complex biological samples (1). Although higher-order processes have been investigated, most experiments involve the simultaneous absorption of two photons by a fluorophore. In two-photon absorption (TPA), two photons are absorbed by the ground state of a fluorescent molecule to excite a higher energy electronic state. TPA is a nonlinear process, as the probability of TPA depends on the square of the excitation light intensity. Due to this quadratic dependence, two-photon fluorescence excitation (TPE) microscopy provides intrinsic axial sectioning and reduced out-of-plane photobleaching (2). Furthermore, the excitation wavelengths used for two-photon microscopy are approximately double those for one-photon excitation, providing greater penetration depth in living tissue. Because of these advantages, TPE has achieved wide-spread usage in biological imaging. Although the emission spectra are the same for one- and two-photon excitation, the absorption spectrum can differ considerably from the corresponding one-photon spectrum due to different selection rules governing TPA (3). Accurate determination of TPA cross section without using a standard is a difficult task, requiring detailed knowledge of the excitation parameters and sample concentration. Because of these experimental difficulties, TPE spectra have only been reported for a limited number of fluorophores, mostly in nonphysiological solvents (4–8). Yet, reliable TPE spectra for a large number of compounds are needed to optimize probe selection and experimental design in biological TPE imaging.
Several techniques have been developed to determine the TPA cross section, based on either direct or indirect measurements. Direct measurements determine the nonlinear transmission through a sample, such as in the z-scan technique (9). These methods yield the TPA cross section directly, but are hampered by poor sensitivity, high excitation intensities, and high dye concentrations. Indirect techniques are based on the measurement of the two-photon-induced fluorescence emission of the dye, corresponding to the TPA cross section multiplied by the quantum efficiency (10). Fluorescence-based techniques are highly sensitive and can be performed in very dilute solutions, but depend strongly on system calibration. Xu et al. (11–13) have recorded a number of TPA spectra by means of the emitted fluorescence, either by determining the product of cross section and quantum efficiency (termed “action cross section”), or by comparing the data to a known reference (14). The latter method alleviates systematic errors associated with the strong dependence of the absorption rate on the temporal and spatial profiles of the excitation source.
Following earlier work (15,16), we use peak molecular brightness as an alternative measure to the TPA cross section. Molecular brightness, abbreviated ε, is defined as the number of recorded counts per unit time per molecule. It is usually measured in kilocounts per second per molecule (kcpsm). For TPE, plotting the molecular brightness against the excitation intensity produces a squared dependence that gradually levels off at high irradiances, reaching a peak value (17). This maximum value, termed “peak molecular brightness”, εmax, has been shown to be dictated by photobleaching and volume saturation effects, which appear at high excitation intensities (18,19). Previous studies have found εmax to be a highly repeatable value that can be used to benchmark a dye in a specific environment, as well as the detection efficiency of the acquisition setup (16). Furthermore, peak molecular brightness measurements can be used to optimize the choice of excitation wavelength for biological applications (20).
Photon-counting techniques such as fluorescence correlation spectroscopy (FCS) are able to determine the two-photon fluorescence emission per molecule, independent of dye concentration. FCS analyzes the spontaneous fluorescence fluctuations that arise from an ensemble of identical emitters in the focal volume of a fluorescence microscopy setup. The second-order autocorrelation function of the fluorescence signal reveals the underlying dynamics and the number of dye molecules in the observation volume (21). The molecular brightness is easily obtained by dividing the recorded fluorescence by the number of emitters. In FCS experiments, it is the critical parameter determining the signal/noise ratio (22).
We devised a fully automated spectrophotometer that can record two-photon peak brightness excitation spectra of fluorescent dyes over the entire wavelength range of a commercial Ti:Sapphire laser. The apparatus is based on an FCS setup that collects molecular brightness data of a fluorophore at various wavelengths and excitation intensities. We systematically present peak brightness spectra for a large set of small molecule and protein fluorophores. We tested common organic dyes, calcium indicators, and fluorescent proteins, all under physiologically relevant conditions. We found that peak molecular brightness spectra could be reliably obtained, were similar in spectral shape with action cross-section spectra, and were less prone to experimental/instrument error than action cross-section measurements. They also provide information on fluorophore photostability, not given by cross-section experiments. Thus, the methods and datasets that we have determined will be of great use to experimentalists attempting to optimize the choice of dye, laser, and wavelength for two-photon imaging.
Using the same apparatus, the two-photon action cross section can be determined from the initial data points of molecular brightness intensity curves, where the slope is 2.0 (16). FCS has the important advantages of intrinsic determination of the sample concentration and greatly simplified measurement apparatus. We report action cross sections that are in good agreement with previous reports.
Comparison of the spectral shape of action cross section and peak brightness showed a high correlation between these parameters for all dye families tested. A practical consequence of these observations is that peak molecular brightness spectra can serve as a useful proxy, to first order, for action cross-section spectra in determining optimal wavelengths for TPE.
The observed correlation between peak molecular brightness and action cross section is not expected a priori. In the case of a quadratic dependence of the photobleaching rate on the excitation intensity, the peak brightness spectrum is expected to be independent of the action cross section (16). On the contrary, we found the two measures to be qualitatively similar over a wide array of probes. We reason here that this spectral correlation of εmax with action cross section is based on highly nonlinear photobleaching in TPE. To test this hypothesis, we employed a passive pulse splitter to increase the excitation repetition rate, which has been shown to significantly reduce photobleaching in TPE microscopy (23). Assuming that peak molecular brightness is limited by photobleaching that is due to higher-order photon interactions (18), this device should improve the observed εmax values. We indeed found such an increase in peak molecular brightness up to a factor of two, supporting the hypothesis of highly nonlinear photobleaching in TPE. In sum, peak molecular brightness spectra provide information about both the absorption and photostability characteristics of probes under two-photon excitation.
Materials and Methods
Setup
The experimental setup is shown in Fig. 1 a. To facilitate the automated and fast acquisition of a large number of peak brightness spectra for a variety of two-photon excited probes, we constructed an automated fluorescence correlation spectroscopy apparatus. Briefly, the linearly polarized output beam of a tunable, mode-locked Ti:Sa laser (Chameleon Ultra II; Coherent, Santa Clara, CA) was first power-adjusted, then expanded 5× by two pairs of achromatic lenses (Linos, Göttingen, Germany) to slightly overfill the back aperture of a 60×, 1.2 NA NIR water immersion objective (UplanSApo 60×W; Olympus, Tokyo, Japan), mounted on an inverted microscope (IX81; Olympus).
Figure 1.
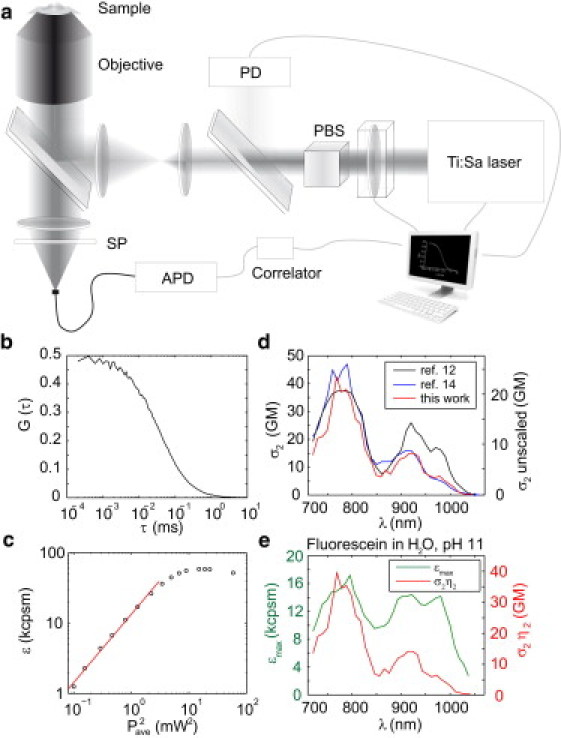
(a) Setup to record molecular brightness and action cross section based on fluorescence correlation spectroscopy (FCS). PBS, polarizing beam splitter; PD, photodiode; SP, shortpass emission filter; APD, avalanche photodiode. (b) Autocorrelation curve G(τ) resulting from FCS measurement. The amplitude G(0) is proportional to the inverse of the number of molecules in the focal volume. (c) Plot of the molecular brightness versus the square of the average excitation power. (Red line) Quadratic dependence at low excitation powers (linear in the double logarithmic plot against squared power). (d) Comparison of cross section of fluorescein obtained by Xu and Webb (12) and Makarov et al. (14) (plotted on left axis), and the unscaled two-photon absorption cross section for fluorescein as determined by this work using FCS (right axis). (e) Plot of peak brightness spectra (εmax, left axis) and scaled action cross section (σ2η2, right axis) for fluorescein, where the action cross section has been scaled by 1.9× from the measured (unscaled) value based on comparison to literature values for fluorescein.
The laser power adjustment was accomplished using a half-wave plate in a motorized rotation stage followed by a polarizing beam splitter cube (Thorlabs, Newton, NJ). Part of the transmitted beam was reflected onto a photodiode detector (Thorlabs), to constantly monitor the laser power reaching the objective. This was related to the power at the focus of the objective by using a photodiode, calibrated before measurements for all wavelengths with a thermopile power meter (LabMax TO; Coherent, Santa Clara, CA), placed after the microscope objective at the location of the sample. Laser wavelength and power were fully computer-controlled. Samples consisted of a buffer solution containing the fluorophore, separated from the water-immersion 60× objective by a No. 1.5 coverslip.
Emitted photons were collected by the same objective and separated from the excitation light by a dichroic mirror (FF670-SDi01-25×36; Semrock, Rochester, NY) and two shortpass filters (FF01-720/SP-25, FF01-750/SP-25; Semrock). The fluorescence signal was detected by a fiber-coupled Avalanche Photodiode (SPCM-AQRH-14-FC; PerkinElmer Optoelectronics, Vaudreuil, Quebec) that yields a 200-μm aperture (AFS200/220Y; Thorlabs). The transistor-transistor logic output of the APD was fed to an external correlator (Flex03LQ-01; Correlator.com, Bridgewater, NJ), which also provided the software for the autocorrelation.
Size and form factor of the focal spot size were determined from calibration measurements with AlexaFluor 546 (diffusion coefficient DA546 = 341 μm2 s−1 (24), Molecular Probes, Eugene, OR) at an excitation wavelength of 820 nm, yielding a 1/e2 radial dimension of ω0 = 393 nm and a form factor (defined as the ratio of the axial over the lateral 1/e2 radius of the focal volume) of 4.0. The form factor was fixed in all subsequent fitting procedures to improve the robustness of the fit. Each measurement lasted between 10 and 300 s and was stopped after a sufficient number of photons was collected. To control for the cover-slide thickness, the correction collar was adjusted before each data run for a particular dye. The collar setting was found to be independent of wavelength. Laser parameters and data acquisition were coordinated with custom software written in C, allowing the excitation wavelength and intensity to be set to a desired step size and range. Data sets were analyzed with a custom MATLAB script (The MathWorks, Natick, MA).
We scanned the excitation wavelength across a range of 720–1060 nm, corresponding to the accessible range of the Chameleon laser (Coherent). With the spectral width of the excitation pulses on the order of 10 nm, we chose a scanning step size of 10 nm. At each wavelength, between 10 and 15 different excitation light intensities were measured to determine the peak brightness. For measurements where action cross section was extracted, the power range included lower powers where ε(Iave) was quadratic. The temporal pulse width of the laser pulses was measured with an optical autocorrelator (Carpe; APE, Berlin, Germany) using an external detector placed at the focus of the objective. The pulse width ranged from 130 fs at 1030 nm to 220 fs at 720 nm, assuming a squared hyperbolic secant (sech2) pulse shape (25).
For brightness measurements, it was shown previously that peak brightness does not depend on temporal pulse width over this pulse width range of the excitation source (26). To ensure a fair comparison of TPE emission efficiencies, the same emission filter and dichroic were used for all dyes. As a control for setup stability and repeatability, the peak brightness of a reference dye (AlexaFluor 546; Molecular Probes) was determined before each measurement series. Over a 12-month period, this value varied <2.5%. The data were fitted with a model for freely diffusing molecules in three dimensions (21), without an additional term describing molecules in the triplet state. No rise of the correlation amplitude in the μs time range, which would indicate a population of the triplet state, could be observed (27).
For experiments testing the effects of increased laser pulse repetition rate, two flip mirrors coupled a passive pulse splitter (described in Ji et al. (23)) into the beam path. The configuration for N = 8 required four beamsplitters and three delay lines (see Fig. S1 in the Supporting Material). Nonpolarizing beamsplitters (BS1-3; Thorlabs) divided the incoming laser beam, and a polarizing beamsplitter (Newport, Irvine, CA) together with a half-wave plate (Thorlabs) merged all beams into one output beam. Custom-made delay lines (DL1-3), consisting of two opposing mirrors four inches apart in an aluminum casing, result in three additional reflections per mirror, increasing the path length by 2.5 ns. Due to the additional optics, the splitter caused a slightly enlarged focal volume (ω0 = 400 nm).
Results and Discussion
We investigate the TPE spectral characteristics of common organic and genetically encoded dyes by means of fluorescence correlation spectroscopy and peak brightness spectra. FCS measurements report on the fluorescence signal 〈F(t)〉, where 〈〉 represents time-averaging, as well as the amplitude G(0) of the autocorrelation function that results from Poissonian particle occupancy fluctuations of the dye molecules within the TPE volume (28). A typical FCS curve for one laser wavelength λ and at one laser intensity is shown in Fig. 1 b. The number of fluorescent molecules in the excitation volume corresponds to the inverse of the amplitude of the autocorrelation function, NAC = 1/G(0). For TPE, in the absence of photobleaching and ground-state depletion, the time-averaged rate of detected fluorescence photons can be written as (12)
| (1) |
Here, C is the concentration of dye, ϕ is the collection efficiency, and η2 is the fluorescence quantum yield. The dimensionless quantity gp = gfτ (gp = 0.664 for a Gaussian-shaped pulse, gp = 0.588 for a hyperbolic-secant square pulse (12)) corresponds to the temporal coherence of the excitation pulse temporal intensity profile g = 〈I0(t)〉2/〈I0(t)〉2. The value f is the pulse repetition rate of the laser and τ the temporal pulse width (full width at half-maximum). The peak intensity I0 is related to the time-averaged intensity 〈I0(t)〉 = Iave (defined as the average power divided by focused beam area) by I0 = aIave/fτ, where a = 0.88 for a sech2 pulse shape and a = 0.94 for a Gaussian pulse shape. Two photons are needed per excitation event, represented by the factor 1/2. The emission rate for a two-photon process is proportional to the TPA cross-section σ2 and the square of the incident intensity I0 at the center of the volume.
Following Xu and Webb (12), the spatiotemporal distribution of the excitation intensity in the sample volume is described by , where is a dimensionless spatial profile representing the point spread function (PSF) and I0(t) is the temporal distribution at the geometric focal point. The spatial distribution is expressed in Eq. 1 by the product γVAC. The value γ, termed “volume contrast”, relates the number of molecules NAC, and therefore the volume as determined from the amplitude of the FCS autocorrelation curve to the number of molecules in the measurement volume defined by the PSF, and γ = VPSF /VAC = NPSF /NAC (19).
The molecular brightness of a fluorophore is defined as the number of detected photons per unit time per molecule, . Given that NAC = CVAC, the molecular brightness is found to be
| (2) |
A typical intensity curve for one laser wavelength is shown in Fig. 1 c. At low excitation intensities, the molecular brightness increases quadratically with the excitation intensity because γ is constant for a given PSF (e.g., γ = 0.35 for a three-dimensional Gaussian excitation volume PSF and γ = 0.1875 for a Gaussian-Lorentzian PSF (29)). In this intensity regime, the action cross-section σ2η2 can be readily extracted from the initial values in the ε(I2ave) plot (Fig. 1 d).
At higher intensities, where ε is no longer quadratic in Iave, γ is also no longer constant, but rather is shown to decrease due to photobleaching (18), as well as increase due to focal volume saturation (i.e., the probability of per-pulse excitation at the focal volume center approaches unity (16,30)). Experimentally, the combination of these effects is that with increasing excitation intensity, the molecular brightness reaches a peak value before decreasing again (Fig. 1 c). As we will discuss in subsequent sections, peak molecular brightness spectra yield information about the excitation wavelength-dependent performance of a dye, similar to that of action cross-section spectra. Thus, two separate parameters—peak molecular brightness and action cross section—can be extracted from the FCS molecular brightness curves, as shown for fluorescein in Fig. 1 e.
Peak brightness spectra
Figs. 2–4 show experimentally measured two-photon peak brightness spectra collected for a diverse range of probes, including AlexaFluor (Fig. 2), classic rhodamines (Fig. 3), and organic and genetically encoded calcium indicators (Fig. 4). All dyes tested obey the square-law dependence of TPE fluorescence at low excitation intensities. Each of the dyes could be excited by TPE, although some not at all wavelengths. For cases where the peak brightness could not be reached or emission was below detection threshold, no data points are shown. This was usually observed at wavelengths >1000 nm due to insufficient laser power or absorption cross section of the dye.
Figure 2.
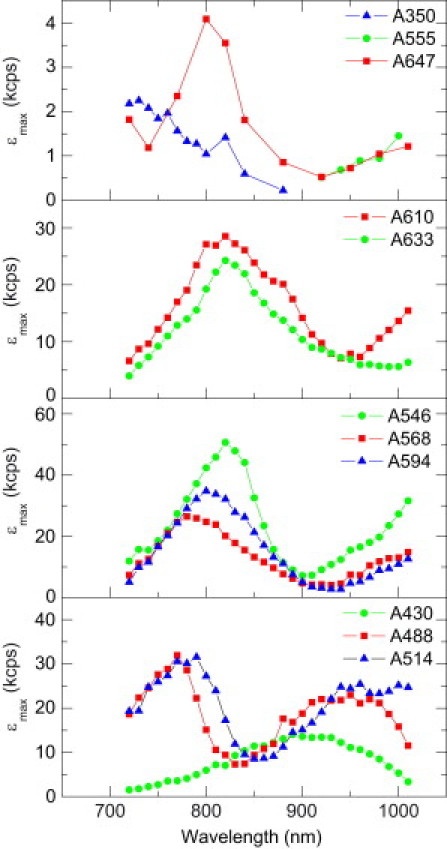
Two-photon fluorescence excitation spectra of AlexaFluor dyes in PBS. Data (every 10 nm, line added to connect data points) represent peak molecular brightness.
Figure 3.
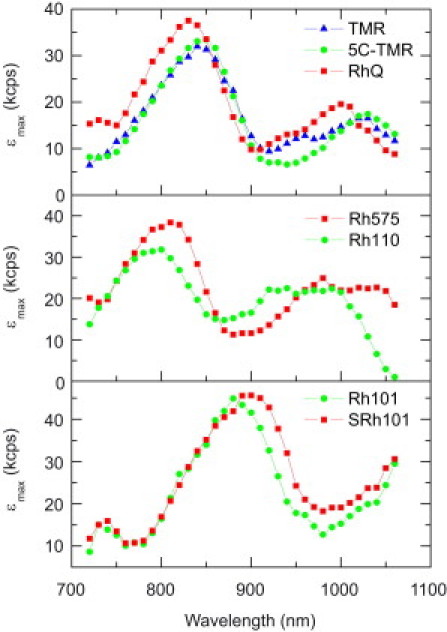
Peak molecular brightness spectra of rhodamine dyes in PBS.
Figure 4.
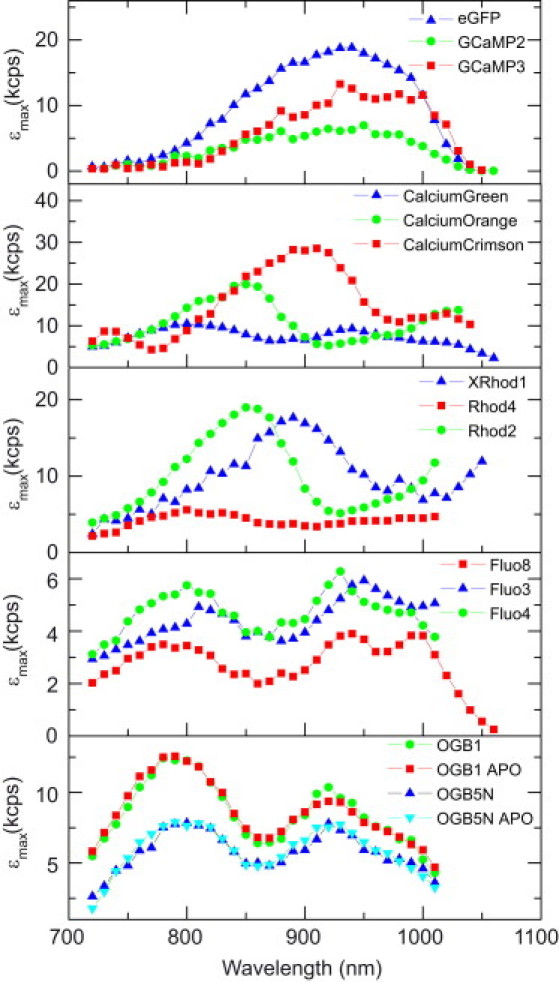
Peak molecular brightness spectra of genetically encoded and organic Ca2+ indicators in 39 μM free Ca2+ calibration buffer (30 mM MOPS, 100 mM KCl, 10 mM CaEGTA, pH 7.2). Peak molecular brightness spectra of OGB-1 and OGB-5N were also determined at 0 μM Ca2+ (30 mM MOPS, 100 mM KCl, 10 mM EGTA; OGB-1 APO, OGB-5N APO).
AlexaFluor dyes are commonly used in fluorescence microscopy as marker and calibration molecules due to their excellent brightness, solubility, and photostability. These dyes are sulfonated derivatives of a wide range of dye families, including coumarin, pyrene, rhodamine, or cyanine dyes (31). Fig. 2 summarizes peak brightness spectra of the AlexaFluor dyes. AlexaFluor 546, a rhodamine derivative, is by far the brightest dye tested, with a peak brightness of 58 kcpsm when excited at 820 nm in water. Measurements in phosphate-buffered saline (PBS) (Fig. 2) or 3-(n-morpholino)propanesulfonic acid (MOPS) (data not shown) buffer yielded slightly lower values (∼51 kcpsm), presumably due to minor fluorescence quenching effects of the buffer.
Rhodamines, isologues of fluorescein, feature low pH sensitivity, high extinction coefficients and quantum yields, as well as excellent photostability. Two-photon peak brightness spectra of rhodamine 101 (Rh101), 110 (Rh110), 575 (Rh575), sulforhodamine 101 (SRh101), tetramethylrhodamine (TMR), 5-carboxy-tetramethylrhodamine (5C-TMR), and Q-rhodamine (RhQ) are shown in Fig. 3. All seven dyes exhibit peak brightness values significantly higher than fluorescein (Fig. 1 e), with excitation maxima ranging from 800 (Rh110) to 900 nm (SRh101).
The advantages of TPE microscopy are especially prominent in deep, highly scattering tissues and it has therefore become a widely used method in neuroscience to image inside the living brain (32). Its applications range from studies on imaging synaptic function in brain slices and live animals to the study of neuronal plasticity (33,34). Neural activity is accompanied by calcium (Ca2+) transients that can be visualized by chemically engineered fluorescent organic (for review, see Paredes et al. (35)) or genetically encoded (for review, see Mank and Griesbeck (36)) Ca2+ indicators. These reporter molecules change their emission properties when bound to Ca2+, allowing real-time visualization of the activity of individual neurons by noninvasive imaging techniques. Peak brightness spectra of a number of organic and genetically encoded calcium indicators (saturated in 39 μM free Ca2+ MOPS) are depicted in Fig. 4. Spectra included the green fluorescent protein-based Ca2+ probes GCaMP2 (37) and GCaMP3 (38). As previously observed (38), GCaMP3 is roughly twofold brighter than its predecessor GCaMP2, but still twofold dimmer than enhanced green fluorescent protein. The peak brightness spectrum of GCaMP3 exhibits a slight red shift compared to that of GCaMP2. The absorption maximum for GCaMP3 is ∼950 nm, whereas GCaMP2 is centered at ∼940 nm, consistent with one-photon results (38).
Depleting the MOPS buffer solution of Ca2+ resulted in a strongly reduced number of molecules in the bright state and overall reduced fluorescence signal, yet peak brightness values of the individual molecules in the bright state remained largely unchanged (as shown for OGB-1 and OGB-5N in Fig. 4). This suggests that the change in fluorescence emission upon Ca2+ binding is an on-off mechanism at the single-molecule level for these specific synthetic indicators.
Action cross-section spectra
Equation 2 implies that the two-photon action cross section (σ2η2) of a fluorophore can be readily extracted from molecular brightness data, as all the other parameters are constant in the limit of low excitation powers (i.e., where the dependence of ε(Iave) is quadratic). To obtain (σ2η2) spectra for a variety of dyes, we collected ε(Iave) curves including additional points at low power levels, selecting points at each wavelength showing quadratic dependence. It is assumed that the γ-parameter is known and constant (i.e., the measurement is taken in a low-power regime where ε is proportional to , free of photobleaching or saturation effects (19)). The peak molecular brightness values εmax were determined from measurements at higher power in the same data set. The simultaneously measured εmax and (σ2η2) spectra are shown in Fig. 5.
Figure 5.
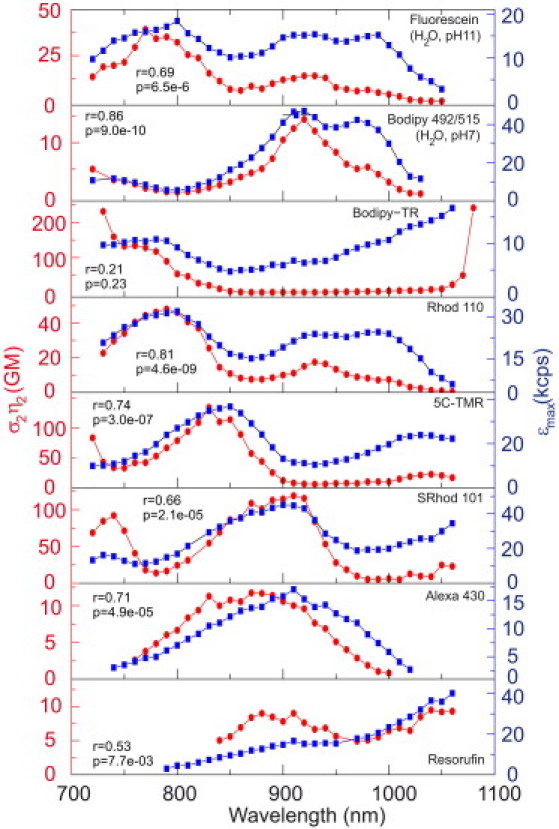
Two-photon action cross section and peak brightness are correlated. Action cross section (red circles, line connects data points) and peak brightness (blue boxes) spectra of fluorescein, BODIPY 492/515, BODIPY-TR, rhodamine 110, 5C-TMR, Sulforhodamine 101, AlexaFluor 430, and Resorufin, as determined by FCS. Measurements were performed in 39 μM Ca2+ MOPS, pH 7.2, buffer, except for fluorescein and BODIPY 492/515, which were measured in H2O at pH 11.0 and pH 7.0, respectively. Action cross-section values were normalized to the peak of fluorescein from Makarov et al. (14). The Pearson correlation coefficient r, and the associated p-test value, are given for each curve pair.
For the action cross-section extraction, Iave was determined from the applied average power Pave, following the relation Iave=Pave/A, where A is the beam area in the focal plane. The area was computed via the relation , where ω0 is the 1/e2 radius of a Gaussian profile extracted from the measured FCS diffusion time τD. For the volume contrast parameter, we employ the value γ = 0.26, which has been numerically computed for a diffraction-limited PSF (29), to most accurately capture the axial intensity distribution. In contrast to classic cross-section measurements, the concentration was not separately measured, but determined from the FCS data set. Information regarding the action cross-section extraction is provided in the Supporting Material.
Representative data for the well-known dye fluorescein are shown in Fig. 1 d. To compare our results to prior work, we convert the action cross-section σ2 to an absolute cross section using the cited quantum efficiency η2 = 0.9, which is based on the assumption that η1 = η2 (12). The resulting cross-section spectral shape closely follows that of Xu and Webb (12) and Makarov et al. (14). The secondary peak at 920 nm is lower than reported by Xu and Webb but matches the more recent work by Makarov and co-authors.
The absolute cross-section data in Fig. 1 d show values approximately twofold smaller (σ2 = 20.2 GM at 780 nm) across the spectrum compared to these prior reports (12,14). In contrast to these other works, we have employed a high-NA focusing system, because FCS measurements require small focal volumes and offer a saturation intensity for a wider spectral range (12,20). The use of high-NA geometry creates greater uncertainty for the cross-section value, owing to heightened optical aberrations that may affect the true values of the focal spot area A and the γ-parameter. Because of the good agreement in spectral shape with prior work (Fig. 1 d), our data appear accurate to within a global scaling factor of 1.9 (20.2 vs. 38.0 GM at 780 nm). Therefore, the action cross-section data are presented in Fig. 1 e and in Fig. 5 as scaled by this factor of 1.9, to best compare other dyes to the well-known fluorescein standard.
In addition to fluorescein as a reference dye, we focused our action cross-section measurements on common two-photon probes with unknown spectra in physiological buffers. Fig. 5 shows two-photon action cross-section spectra for several dyes from different dye families. Among them are fluorescein and the rhodamines: rhodamine 110, 5C-TMR, and sulforhodamine 101. The boron-dipyrromethene (BODIPY) dyes BODIPY 492/515 and BODIPY-TR dyes are bright, environmentally insensitive dyes. AlexaFluor 430 is a sulfonated aminocoumarin, whereas resorufin belongs to the phenoxazine dye family. For BODIPY 492/515 in water solution, the shape, peak location (920 nm), and relative magnitude at the peak (σ2η2 = 14.4 GM) obtained using the FCS technique in this work agrees quite well with Xu and Webb (12) (σ2η2 = 17 GM at 920 nm peak). This provides further confidence in the accuracy of the relative magnitudes and shapes of the action cross-section spectra obtained in this work.
A resemblance between the spectral shape of σ2η2 and εmax is observed for all tested dyes—the maxima and minima seen in each type of spectrum are apparent in the other (Fig. 5). This similarity was quantified by a Pearson correlation coefficient over the entire wavelength range indicating significant correlation (p < 0.001 for six dyes, p < 0.01 for resorufin) for each of the dyes except BODIPY-TR (p = 0.23). Peak brightness thus can be a useful substitute for cross-section measurements in determining the optimal excitation wavelength(s) of a dye. Experimentally, peak brightness is obtained faster and more easily than cross section. The resemblance between σ2η2 and εmax spectra is not obvious from first principles: action cross section is determined at low powers, whereas peak brightness requires high excitation powers leading to photobleaching of the dye. In the following discussion, we will argue that the spectral similarity of peak brightness and action cross section most likely arises from the presence of highly nonlinear (>quadratic) photobleaching in the probes we tested. From Eq. 2, it follows that the molecular brightness increases quadratically with the excitation intensity Iave and depends on the action cross section and volume contrast γ. This form is also valid in the case of saturation and/or spatially variable concentration due to photobleaching, only γ has to be modified/redefined such that it covers the appropriate geometrical changes (18). Here we will first discuss the effects of saturation and photobleaching on peak molecular brightness individually and subsequently the combination of both.
In the case of focal volume saturation only, as the excitation intensity is increased, the number of absorption events per molecule per pulse approaches unity. We define the mean number of absorption events per laser pulse at the focal volume center as
| (3) |
With Eqs. 2 and 3, the molecular brightness is then described by
| (4) |
Further, we define Isat so that Isat = Iave when μ(I2ave) = 1. Isat corresponds to the intensity at which one absorption event occurs per pulse. With Eq. 3, we get
| (5) |
The mean number of absorption events per pulse μ(I2ave), as defined by Eq. 3, can increase indefinitely with increasing Iave. In reality, though, more than one absorption event per pulse cannot be exceeded. Limiting the maximum number of excitation events per pulse to 1 and modeling a Poisson process, the actual number of absorption events can then be expressed as (16)
| (6) |
where the exponential term is the Poissonian probability of no absorption event taking place. The value of μsat(I2ave) defined by Eq. 6 asymptotically approaches unity with increasing intensity. When Iave approaches and exceeds Isat, a breakdown of the quadratic dependence of the fluorescence in intensity results. The degree of saturation is determined by the excitation profile: molecules in the center of the volume are saturated first (19). As a result, the effective size and shape of the observation volume are altered, changing the volume contrast. The observation volume increases dramatically, forming a flatter, top-hat shape spatial profile (19). The volume contrast γsat,max asymptotically approaches a constant value that depends on the functional form of . As a result, the peak brightness spectrum, in the case of saturation only, becomes a flat, wavelength-independent spectrum of constant value:
| (7) |
Here it is assumed that η2 is wavelength-independent (Kasha-Vavilov rule (39)).
Assuming only photobleaching effects, the volume contrast decreases with Iave due to the depletion of fluorophores. The rate of photobleaching is most pronounced in the center of the volume, where the excitation intensity is highest, reducing the fluorescence emission from the central region of the volume. If the bleaching rate depends on the second power of the excitation intensity Iave (that is, kb = , where the bleaching quantum efficiency is ηb), then the volume contrast can also be expressed with respect to the bleaching rate kb, becoming a function of , γbl() (18). For this quadratic dependence of bleaching on Iave, the molecular brightness is expressed as
| (8) |
Thus, in the case of bleaching only, the peak molecular brightness depends on the cross-section σ2 and excitation intensity Iave only via the product . When the value of σ2 changes with wavelength, the same peak molecular brightness is reached but at a shifted reference threshold value of Iave. The molecular brightness initially increases with Iave; for higher excitation intensities, the quadratic dependence is lost, reaching a peak value εmax determined by the bleaching quantum efficiency ηb. Here, ηb is assumed to be independent of excitation wavelength or to exhibit spectral dependence of a form independent of σ2.
When both saturation and bleaching depend on σ2 and Iave only via the product , both represent functional forms independent of σ2. It follows directly from this that when combining both effects εmax is also independent of cross section. Experimentally, however, a significant resemblance between εmax and action cross-section spectra is observed (Fig. 5). In case of a quadratic dependence of photobleaching on Iave, this correlation is only possible if ηb were itself to show spectral variation anticorrelated with σ2. As soon as photobleaching becomes other than quadratic in Iave, ηb becomes effectively a function of Iave and the dependence of εbl on σ2 and Iave is not simply via the product . Then ηb becomes effectively spectrally anticorrelated with σ2, i.e., bleaching becomes effectively stronger where the cross section is decreased because bleaching increases more rapidly with intensity than absorption. A global maximum will exist for a particular pair of σ2 and , and a notable correlation between εmax and σ2η2 spectra emerges. Previous studies have reported highly nonlinear photobleaching, with dependencies on the order of 2.5 (40), 3.0 (41,42), or up to 4.0 (43). We therefore conclude highly nonlinear photobleaching to be the dominant mechanism underlying the observed similarity in shape of the εmax and action cross-section spectra at the wavelengths and intensities used for the dyes in Fig. 5, and aim to demonstrate this experimentally using a passive pulse splitter in the next section.
Peak brightness values and spectra are thus integrative measurements, incorporating a dye's absorption cross section as well as providing additional information about its photostability. In general, large brightness values result from a combination of a large TPE action cross section and low photobleaching. A large TPE action cross section alone does not automatically imply a high brightness value. Table S1 in the Supporting Material summarizes the maximal peak brightness and action cross section obtained from each spectrum. For this comparison, the peak brightness values were normalized by their emission-spectra overlap with the detection spectrum, relative to fluorescein. It can be seen, for instance, that BODIPY 492/515 has the highest peak molecular brightness, greater than SRh101, even though its action cross section is an order-of-magnitude lower. The peak brightness metric thus reveals that BODIPY 492/515 may be an attractive candidate for two-photon probe development for applications where photostability is paramount. In addition to these rank-order differences in magnitude, a trend for the ratio of εmax/σ2η2 to be relatively higher at longer wavelengths is observed (see Fig. S2), suggesting that the deteriorating effects of photobleaching may be less pronounced at longer wavelengths. Peak molecular brightness spectra can therefore complement action cross-section spectra to provide a fuller picture of a probe's performance.
Improvement of brightness by means of a passive pulse splitter
To validate the presence of higher-order photobleaching and to test strategies that improve peak brightness, we implemented a recently developed passive pulse splitter that increases the repetition rate of the excitation pulses (23). This device has been demonstrated to reduce photobleaching while achieving the same fluorescence rate as no splitter at all. For TPE, splitting a laser pulse train by N increases the repetition rate f by N, while reducing the squared peak intensity by N2, together reducing the emission 〈F(t)〉 according to Eq. 2. To restore the original emission rate, the average power needs to be increased by ; in this regime, the squared peak intensity is reduced by N. In the case where photobleaching scales as with the power β of intensity, and β > 2, bleaching is reduced by the factor N1−β/2 (23).
In our splitter setup, three beamsplitters divide the input beam into eight beams (Fig. S1). The beams are delayed with respect to each other and recombined into an output beam with an 8× higher repetition rate. The resulting output beam has an excitation frequency of 640 MHz and an interpulse spacing of >1 ns. Using this assembly, we addressed the dependence of molecular brightness on excitation intensity and repetition rate. Fig. 6 a shows ε versus P2ave curves for rhodamine 110 at excitation rates of 80 (N = 1) and 640 (N = 8) MHz. The squared power is normalized by the splitting ratio N (either 1 or 8). At low irradiance, the curves follow the squared dependence and overlap. At high excitation powers, the 8× splitter assembly results in an increase in peak brightness by a factor of ∼2 for rhodamine 110. Table S2 summarizes the effect of increasing the repetition rate on peak brightness for the common organic dyes TMR, AlexaFluor 546, Oregon Green, and rhodamine 110.
Figure 6.
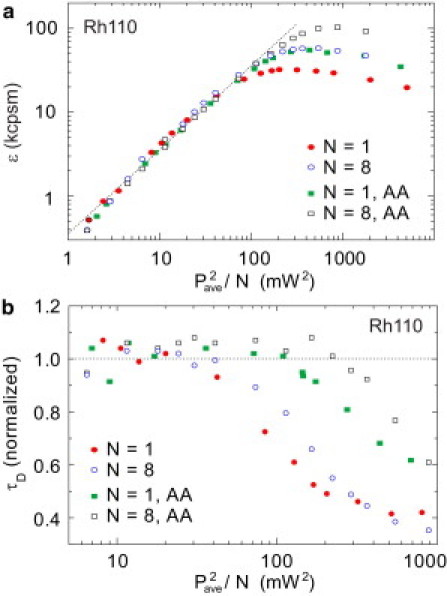
Effect of passive pulse splitter on Rhodamine 110. (a) Brightness per molecule as a function of squared excitation intensity divided by the splitting ratio N (N = 1 or 8). (b) 8× splitting as well as ascorbic acid reduce the effects of bleaching. Apparent residence time (normalized to the initial values) decreases with increasing illumination intensity. Addition of ascorbic acid or the splitter increases the bleaching effect thresholds.
Photobleaching of dye molecules is a complex phenomenon, because there are in general several possible mechanisms by which a fluorophore can be irreversibly photobleached. Absorption of multiple photons by excited singlet or triplet states can yield unstable species. Because of its long lifetime, the triplet state is considered to be an important precursor for photobleaching pathways. No triplet state dynamics are usually visible in two-photon FCS experiments, possibly due to saturated transitions from the long-lived triplet state into higher excited triplet states and subsequent photobleaching of the molecule (44). Observations of increased fluorescence yield when reducing the excitation repetition rate to allow transient triplet states to relax before the next excitation cycle support this view (45). Thus, in two-photon FCS, due to the high irradiances involved, there seems to be no recovery from the triplet state, whereas under single photon excitation, a fluorophore in the triplet state is capable of relaxation to the singlet ground state.
Here, we employ a reducing agent that lowers the photobleaching yield and increases the peak brightness of a fluorophore. We use ascorbic acid (AA), an antioxidant, as a stabilizing reagent. As previously reported (27), the addition of AA (without using the splitter) results in a strongly increased brightness (Fig. 6 a (46)). The effects of photobleaching can also be inferred from the reduction in the apparent residence time of the molecule in the focus. The characteristic decay of the autocorrelation function is associated with the dwell time of the molecule in the focal volume. A molecule that undergoes photodestruction during transit through the focus appears to have a reduced residence time τD. Fig. 6 b shows the decrease in the apparent diffusion time with increasing excitation intensity. The onset of bleaching is shifted to higher excitation intensities with AA treatment. When applying the 8× splitter in combination with AA treatment, the positive effects roughly add, resulting in an increase in peak brightness up to a factor of ∼4 (see Table S2) in combination with a delayed onset of bleaching, as observed in the apparent diffusion time (Fig. 6 b). Increase of peak brightness by means of a passive pulse splitter and reduction of photoionized fluorophores by an antioxidant, appear to be two largely independent processes.
We showed that by increasing the excitation repetition rate by means of a passive pulse splitter, the signal/noise ratio in two-photon FCS measurements could be increased by a factor of two. Together with the addition of ascorbic acid, the peak molecular brightness was increased up to a factor of four. These improvements can be vital, especially in intracellular FCS applications, increasing the statistical accuracy of the data or reducing the necessary measurement times. Higher splitting ratios N are possible, at least up to 128 (23), albeit with additional complexity in the splitter design. These may provide a further increase in the peak brightness. We plan to explore this in future work.
Conclusion
The spectroscopic properties of two-photon excited probes have been investigated by a fully automated two-photon FCS apparatus. Two-photon excitation spectra in the form of peak brightness spectra of 37 common, commercially available organic dyes and Ca2+ indicators have been screened in the tuning range of a mode-locked Ti:Sapphire laser. This comprehensive data set can be used as a reference in the selection of dyes and wavelengths for optimal signal/noise ratio in two-photon imaging as well as FCS. For example, peak brightness spectra play a crucial role in optimizing choice of fluorophores and wavelength for two-photon dual-color cross correlation experiments. Different selection rules for one- and two-photon absorption allow efficient excitation of spectrally separable dyes with a single wavelength. Thus, it is possible to study the interaction of two differently labeled molecules, eliminating problems associated with two excitation sources, such as poor beam overlap (20).
Molecular brightness intensity curves can also be used to determine the two-photon action cross section of a fluorophore. Our experimentally determined peak brightness spectra resemble action cross-section spectra, corroborating that peak brightness is a relevant means to describe the spectral performance of a dye and identify optimal TPE wavelengths. Compared to action cross section, peak brightness values and spectra are integrative measures containing additional information pertaining to probe photostability. The notable similarity between peak brightness and action cross-section spectra can be theoretically explained by the presence of higher-order photobleaching effects. This has been experimentally confirmed with a passive pulse splitter, increasing the peak brightness in two-photon FCS experiments by up to twofold.
Acknowledgments
The authors thank Na Ji for assistance with the pulse splitter.
J.M. was supported by a German Academic Exchange Service fellowship. This research was funded by the Howard Hughes Medical Institute.
Supporting Material
References
- 1.Zipfel W.R., Williams R.M., Webb W.W. Nonlinear magic: multiphoton microscopy in the biosciences. Nat. Biotechnol. 2003;21:1369–1377. doi: 10.1038/nbt899. [DOI] [PubMed] [Google Scholar]
- 2.Denk W., Strickler J.H., Webb W.W. Two-photon laser scanning fluorescence microscopy. Science. 1990;248:73–76. doi: 10.1126/science.2321027. [DOI] [PubMed] [Google Scholar]
- 3.Albota M.A., Xu C., Webb W.W. Two-photon fluorescence excitation cross sections of biomolecular probes from 690 to 960 nm. Appl. Opt. 1998;37:7352–7356. doi: 10.1364/ao.37.007352. [DOI] [PubMed] [Google Scholar]
- 4.Kauert M., Stoller P.C., Ricka J. Absolute measurement of molecular two-photon absorption cross-sections using a fluorescence saturation technique. Opt. Express. 2006;14:8434–8447. doi: 10.1364/oe.14.008434. [DOI] [PubMed] [Google Scholar]
- 5.Oulianov D.A., Tomov I.V., Rentzepis P.M. Observations on the measurement of two-photon absorption cross-section. Opt. Commun. 2001;191:235–243. [Google Scholar]
- 6.Tian P., Warren W.S. Ultrafast measurement of two-photon absorption by loss modulation. Opt. Lett. 2002;27:1634–1636. doi: 10.1364/ol.27.001634. [DOI] [PubMed] [Google Scholar]
- 7.Sengupta P., Balaji J., Maiti S. Sensitive measurement of absolute two-photon absorption cross sections. J. Chem. Phys. 2000;112:9201–9205. [Google Scholar]
- 8.Kapoor R., Friend C.S., Patra A. Two-photon-excited absolute emission cross-sectional measurements calibrated with a luminance meter. J. Opt. Soc. Am. B. 2003;20:1550–1554. [Google Scholar]
- 9.Sheik-Bahae M., Said A.A., Van Stryland E.W. Sensitive measurement of optical nonlinearities using a single beam. IEEE J. Quantum Electron. 1990;26:760–769. [Google Scholar]
- 10.Hermann J.P., Ducuing J. Absolute measurement of two-photon cross section. Phys. Rev. A. 1972;5:2557–2568. [Google Scholar]
- 11.Xu C., Zipfel W., Webb W.W. Multiphoton fluorescence excitation: new spectral windows for biological nonlinear microscopy. Proc. Natl. Acad. Sci. USA. 1996;93:10763–10768. doi: 10.1073/pnas.93.20.10763. [DOI] [PMC free article] [PubMed] [Google Scholar]
- 12.Xu C., Webb W.W. Measurement of two-photon excitation cross sections of molecular fluorophores with data from 690 to 1050 nm. J. Opt. Soc. Am. B. 1996;13:481–491. [Google Scholar]
- 13.Xu C., Williams R.M., Webb W.W. Multiphoton excitation cross-sections of molecular fluorophores. Bioimaging. 1996;4:198–207. [Google Scholar]
- 14.Makarov N.S., Drobizhev M., Rebane A. Two-photon absorption standards in the 550–1600 nm excitation wavelength range. Opt. Express. 2008;16:4029–4047. doi: 10.1364/oe.16.004029. [DOI] [PubMed] [Google Scholar]
- 15.Larson D.R., Zipfel W.R., Webb W.W. Water-soluble quantum dots for multiphoton fluorescence imaging in vivo. Science. 2003;300:1434–1436. doi: 10.1126/science.1083780. [DOI] [PubMed] [Google Scholar]
- 16.Iyer V., Rossow M.J., Waxham N.M. Peak two-photon molecular brightness of fluorophores is a robust measure of quantum efficiency and photostability. J. Opt. Soc. Am. B. 2006;23:1420–1433. [Google Scholar]
- 17.Schwille P., Haupts U., Webb W.W. Molecular dynamics in living cells observed by fluorescence correlation spectroscopy with one- and two-photon excitation. Biophys. J. 1999;77:2251–2265. doi: 10.1016/S0006-3495(99)77065-7. [DOI] [PMC free article] [PubMed] [Google Scholar]
- 18.Petrásek Z., Schwille P. Photobleaching in two-photon scanning fluorescence correlation spectroscopy. Chem. Phys. Chem. 2008;9:147–158. doi: 10.1002/cphc.200700579. [DOI] [PubMed] [Google Scholar]
- 19.Nagy A., Wu J., Berland K.M. Observation volumes and γ-factors in two-photon fluorescence fluctuation spectroscopy. Biophys. J. 2005;89:2077–2090. doi: 10.1529/biophysj.104.052779. [DOI] [PMC free article] [PubMed] [Google Scholar]
- 20.Heinze K.G., Koltermann A., Schwille P. Simultaneous two-photon excitation of distinct labels for dual-color fluorescence crosscorrelation analysis. Proc. Natl. Acad. Sci. USA. 2000;97:10377–10382. doi: 10.1073/pnas.180317197. [DOI] [PMC free article] [PubMed] [Google Scholar]
- 21.Mütze J., Ohrt T., Schwille P. Fluorescence correlation spectroscopy in vivo. Laser Photonics Rev. 2011;5:52–67. [Google Scholar]
- 22.Koppel D.E. Statistical accuracy in fluorescence correlation spectroscopy. Phys. Rev. A. 1974;10:1938–1945. [Google Scholar]
- 23.Ji N., Magee J.C., Betzig E. High-speed, low-photodamage nonlinear imaging using passive pulse splitters. Nat. Methods. 2008;5:197–202. doi: 10.1038/nmeth.1175. [DOI] [PubMed] [Google Scholar]
- 24.Petrásek Z., Schwille P. Precise measurement of diffusion coefficients using scanning fluorescence correlation spectroscopy. Biophys. J. 2008;94:1437–1448. doi: 10.1529/biophysj.107.108811. [DOI] [PMC free article] [PubMed] [Google Scholar]
- 25.Demtröder W. Springer; New York: 2008. Laser Spectroscopy. Vol. 1: Basic Principles. [Google Scholar]
- 26.Mütze J., Petrásek Z., Schwille P. Independence of maximum single molecule fluorescence count rate on the temporal and spectral laser pulse width in two-photon FCS. J. Fluoresc. 2007;17:805–810. doi: 10.1007/s10895-007-0246-5. [DOI] [PubMed] [Google Scholar]
- 27.Dittrich P.S., Schwille P. Photobleaching and stabilization of fluorophores used for single-molecule analysis with one- and two-photon excitation. Appl. Phys. B. 2001;73:829–837. [Google Scholar]
- 28.Magde D., Elson E.L., Webb W.W. Fluorescence correlation spectroscopy. II. An experimental realization. Biopolymers. 1974;13:29–61. doi: 10.1002/bip.1974.360130103. [DOI] [PubMed] [Google Scholar]
- 29.Xu C., Webb W.W. Plenum Press; New York: 1997. Topics in Fluorescence Spectroscopy. Vol. 5: Nonlinear and Two-Photon-Induced Fluorescence. [Google Scholar]
- 30.Mertz J. Molecular photodynamics involved in multi-photon excitation fluorescence microscopy. Eur. Phys. J. D. 1998;3:53–66. [Google Scholar]
- 31.Panchuk-Voloshina N., Haugland R.P., Haugland R.P. Alexa dyes, a series of new fluorescent dyes that yield exceptionally bright, photostable conjugates. J. Histochem. Cytochem. 1999;47:1179–1188. doi: 10.1177/002215549904700910. [DOI] [PubMed] [Google Scholar]
- 32.Helmchen F., Denk W. Deep tissue two-photon microscopy. Nat. Methods. 2005;2:932–940. doi: 10.1038/nmeth818. [DOI] [PubMed] [Google Scholar]
- 33.Mainen Z.F., Maletic-Savatic M., Svoboda K. Two-photon imaging in living brain slices. Methods. 1999;18:231–239. doi: 10.1006/meth.1999.0776. [DOI] [PubMed] [Google Scholar]
- 34.Svoboda K., Tank D.W., Denk W. Direct measurement of coupling between dendritic spines and shafts. Science. 1996;272:716–719. doi: 10.1126/science.272.5262.716. [DOI] [PubMed] [Google Scholar]
- 35.Paredes R.M., Etzler J.C., Lechleiter J.D. Chemical calcium indicators. Methods. 2008;46:143–151. doi: 10.1016/j.ymeth.2008.09.025. [DOI] [PMC free article] [PubMed] [Google Scholar]
- 36.Mank M., Griesbeck O. Genetically encoded calcium indicators. Chem. Rev. 2008;108:1550–1564. doi: 10.1021/cr078213v. [DOI] [PubMed] [Google Scholar]
- 37.Tallini Y.N., Ohkura M., Kotlikoff M.I. Imaging cellular signals in the heart in vivo: cardiac expression of the high-signal Ca2+ indicator GCaMP2. Proc. Natl. Acad. Sci. USA. 2006;103:4753–4758. doi: 10.1073/pnas.0509378103. [DOI] [PMC free article] [PubMed] [Google Scholar]
- 38.Tian L., Hires S.A., Looger L.L. Imaging neural activity in worms, flies and mice with improved GCaMP calcium indicators. Nat. Methods. 2009;6:875–881. doi: 10.1038/nmeth.1398. [DOI] [PMC free article] [PubMed] [Google Scholar]
- 39.Wawilow S.J. The fluorescence yield of dye solutions as a function of the exciting light wavelength. II. Z. Phys. 1927;42:311–318. [Google Scholar]
- 40.Hopt A., Neher E. Highly nonlinear photodamage in two-photon fluorescence microscopy. Biophys. J. 2001;80:2029–2036. doi: 10.1016/S0006-3495(01)76173-5. [DOI] [PMC free article] [PubMed] [Google Scholar]
- 41.Patterson G.H., Piston D.W. Photobleaching in two-photon excitation microscopy. Biophys. J. 2000;78:2159–2162. doi: 10.1016/S0006-3495(00)76762-2. [DOI] [PMC free article] [PubMed] [Google Scholar]
- 42.Niesner R., Roth W., Gericke K.-H. Photophysical aspects of single-molecule detection by two-photon excitation with consideration of sequential pulsed illumination. Chem. Phys. Chem. 2004;5:678–687. doi: 10.1002/cphc.200300881. [DOI] [PubMed] [Google Scholar]
- 43.Chen T.S., Zeng S.Q., Zhou W. High-order photobleaching of green fluorescent protein inside live cells in two-photon excitation microscopy. Biochem. Biophys. Res. Commun. 2002;291:1272–1275. doi: 10.1006/bbrc.2002.6587. [DOI] [PubMed] [Google Scholar]
- 44.Sanchez E.J., Novotny L., Xie X.S. Room-temperature fluorescence imaging and spectroscopy of single molecules by two-photon excitation. J. Phys. Chem. A. 1997;101:7019–7023. [Google Scholar]
- 45.Donnert G., Eggeling C., Hell S.W. Major signal increase in fluorescence microscopy through dark-state relaxation. Nat. Methods. 2007;4:81–86. doi: 10.1038/nmeth986. [DOI] [PubMed] [Google Scholar]
- 46.Widengren J., Chmyrov A., Seidel C.A. Strategies to improve photostabilities in ultrasensitive fluorescence spectroscopy. J. Phys. Chem. A. 2007;111:429–440. doi: 10.1021/jp0646325. [DOI] [PubMed] [Google Scholar]
- 47.Mitchison T.J., Sawin K.E., Mallavarapu A. Caged fluorescent probes. Methods Enzymol. 1998;291:63–78. doi: 10.1016/s0076-6879(98)91007-2. [DOI] [PubMed] [Google Scholar]
Associated Data
This section collects any data citations, data availability statements, or supplementary materials included in this article.