Background: Amyloid β peptide plays a role in Alzheimer disease.
Results: Interaction of amyloid β peptides with 40 and 42 amino acids has consequences for oligomer formation.
Conclusion: Increased production of amyloid β peptide with 42 amino acids affects the behavior of the entire amyloid β peptide pool.
Significance: This might explain the synaptotoxic effect observed with a shift in amyloid β peptide production.
Keywords: Alzheimer Disease, Amyloid, Mass Spectrometry (MS), Neurodegeneration, NMR, Protein Structure, Aggregation, Amyloid-beta Peptide, Oligomer
Abstract
The β-amyloid peptide (Aβ) is directly related to neurotoxicity in Alzheimer disease (AD). The two most abundant alloforms of the peptide co-exist under normal physiological conditions in the brain in an Aβ42:Aβ40 ratio of ∼1:9. This ratio is often shifted to a higher percentage of Aβ42 in brains of patients with familial AD and this has recently been shown to lead to increased synaptotoxicity. The molecular basis for this phenomenon is unclear. Although the aggregation characteristics of Aβ40 and Aβ42 individually are well established, little is known about the properties of mixtures. We have explored the biophysical and structural properties of physiologically relevant Aβ42:Aβ40 ratios by several techniques. We show that Aβ40 and Aβ42 directly interact as well as modify the behavior of the other. The structures of monomeric and fibrillar assemblies formed from Aβ40 and Aβ42 mixtures do not differ from those formed from either of these peptides alone. Instead, the co-assembly of Aβ40 and Aβ42 influences the aggregation kinetics by altering the pattern of oligomer formation as evidenced by a unique combination of solution nuclear magnetic resonance spectroscopy, high molecular weight mass spectrometry, and cross-seeding experiments. We relate these observations to the observed enhanced toxicity of relevant ratios of Aβ42:Aβ40 in synaptotoxicity assays and in AD patients.
Introduction
Alzheimer disease (AD)6 is a multifactorial neurodegenerative disease that mainly affects the growing population of the elderly. The primary agents of AD, the β-amyloid peptides (Aβ), are produced from the amyloid precursor protein by sequential endoproteolytic cleavages. The severity of dementia correlates with soluble assemblies of Aβ peptides rather than with the final fibrillar Aβ deposits observed in the brain (1) and a plethora of different toxic oligomers have been identified (2–5).
Imprecise cleavage of the amyloid precursor protein substrate by γ-secretase or altered catabolism of the Aβ peptides affect the relative amounts of Aβ42 and Aβ40, the two main Aβ fragments (6–8). An increased Aβ42:Aβ40 ratio seems to coincide with more aggressive forms of the disease compared with cases of sporadic AD (9) and affects synaptic activity, viability of neuronal cells, and memory formation in animals (7, 8, 10–12). Recently, minor shifts in the Aβ42:Aβ40 ratio have been reported to drastically influence the formation of neurotoxic oligomers (13, 14). Despite the very similar chemical nature of the two peptides, they seem to have quite different structural and biophysical properties. Aβ42 is known to be highly fibrillogenic and more prone than Aβ40 to form neurotoxic assemblies (13, 15–17). Different architectures of in vitro-generated amyloid fibrils from pure Aβ40 and Aβ42 peptides have been revealed by nuclear magnetic resonance (NMR) (18), electron microscopy (EM) (19), and x-ray fiber diffraction methods (20–22). A limited number of studies have demonstrated that Aβ40 and Aβ42 each affect the aggregation rates of the other, and it is generally reported that Aβ40 inhibits the aggregation of Aβ42 (12, 14, 23–27).
To date, most structural and biophysical studies have been performed using Aβ40 or Aβ42 in isolation. However, the aberrant behavior of neurotoxic Aβ peptides directed by the Aβ42:Aβ40 ratio requires the need to simultaneously investigate Aβ40 and Aβ42. In the present study, we address how Aβ40 and Aβ42 influence and modulate assembly and consider how structural aspects of intermediates along the aggregation pathway can direct the cytotoxic response of Aβ42:Aβ40 ratios. By combining transmission electron microscopy (TEM), x-ray fiber diffraction, surface plasmon resonance (SPR), solution NMR, and high molecular weight mass spectrometry, we have characterized the start and end states of different relevant Aβ42:Aβ40 ratios. Using the unique combination of 15N-edited and 15N-filtered NMR experiments, we have been able to isolate the specific behavior of either Aβ40 or Aβ42 in mixtures. We show that Aβ40 and Aβ42 can interact and that they mutually influence their aggregation behavior. Interestingly, cross-seeding and mass spectrometry (MS) experiments reveal differences in the prefibrillar stage of aggregation, which are reflected by different aggregation kinetics.
EXPERIMENTAL PROCEDURES
Preparation of Aβ Peptide Ratios
The Aβ40 and Aβ42 peptides and their uniformly 15N-labeled variants were purchased from rPeptide (rPeptide catalogue no. A-1153-1, A-1163-1, A-1101-2, and A-1102-2). The Aβ40 and Aβ42 peptides were combined in monomeric form in the desired ratios as described in detail elsewhere (28). In brief, Aβ peptides were dissolved in 1,1,1,3,3,3-hexafluor-2-propanol, Aβ42 and Aβ40 were then mixed in molar ratios of 1:9 and 3:7 together with pure Aβ42 and Aβ40 samples, and after evaporation of 1,1,1,3,3,3-hexafluor-2-propanol, they were redissolved in dimethyl sulfoxide (DMSO). The peptide was passed through a desalting column and eluted in a 50 mm Tris, 1 mm EDTA buffer, pH 7.5. Peptide concentrations were measured by the Bradford assay or by UV absorbance at 280 nm (ϵ280 = 1490 m−1cm−1). The samples were kept on ice until required, with a maximum lag time of 30 min.
SPR Analysis
N-terminally labeled biotin-linker chain Aβ40 (biotin-Aβ40) and biotin-Aβ42 (rPeptide catalogue no. A-1112-1 and A-1118-1, respectively) and Aβ40, Aβ42, and a non-assembling peptide with the sequence KAAEAAAKKFFE (29) were treated as described above except using a 10 mm HEPES, 100 mm NaCl, 1 mm EDTA, and 0.05 mm NaN3, pH 7.4 buffer, and the peptide was eluted using a 2-ml Zeba spin column for buffer exchange. SPR measurements were carried out on a Biacore® 2000 system (GE Healthcare) using carboxymethylated dextran preimmobilized with streptavidin sensor chips (GE Healthcare). A volume of 150 μl of biotin-Aβ40 or biotin-Aβ42 was immobilized to the sensor surface at a concentration of 10 μm at a flow rate of 30 μl/min. Concentrations of 10 μm of Aβ40, Aβ42 or KAAEAAAKKFFE were injected at 3 μl/min. Measurements were done in triplicate and analyzed with the built-in BIAevaluation software. Curve fitting relied on the Marquardt-Levenberg algorithm, and the change in response was fitted to the binding isotherm Req = Rmax[A]/((koff/kon)+[A]), where Req is the equilibrium response, Rmax is the maximum signal response, [A] is the analyte concentration, koff is the dissociation rate constant, and kon is the association rate constant.
Fiber Diffraction
Samples of mature fibers were aligned by suspending a droplet of solution at 4 mg/ml between two wax-tipped capillaries positioned end-to-end. Fibers were mounted on a goniometer head, and x-ray diffraction data were collected using a Rigaku CuKα rotating anode with a wavelength of 1.5419 Å and RAxis IV++ detector. Specimen to detector distances were 160 and 250 mm with an exposure time of 10 min. Diffraction patterns were examined in CLEARER (30). For additional inspection, meridional, and equatorial axes signals were sampled through an angular search width of 60°, exported as a function of distance (pixels), and plotted using Braggs Law.
TEM Analysis
Aliquots of 4 μl Aβ were adsorbed for 30 s onto freshly prepared carbon-coated and glow-discharged copper grids, washed briefly with milli-Q water, and subsequently stained with 1% (w/v) uranyl acetate for 30 s. Samples were examined with a JEOL 1200 transmission electron microscope operating at 100 KV.
Cross-seeding Monitored with ThT
Aliquots (100 μl) of each Aβ ratio at 50 μm were incubated at 25 °C in 50 mm Tris, 1 mm EDTA, pH 7.5. After 24 h incubation these samples were sonicated at 4 °C for 10 min at maximum power and mixed with freshly and simultaneously prepared Aβ ratios to induce (cross-)seeding of Aβ aggregation. Final concentrations in these mixtures were 0.5 μm of sonicated Aβ and 25 μm of monomeric Aβ. The seed preparations were examined by TEM.
ThT Fluorescence
Aβ peptide samples of 25 μm were incubated with 12 μm thioflavin T (ThT) in a total volume of 150 μl in a Greiner 96-well plate. Fibrillization kinetics were followed using a Fluostar OPTIMA fluorescence plate reader using 440 nm excitation wavelength and an emission wavelength of 480 nm. Readings were recorded in triplicate every 10 min for a period of 24 h.
High Molecular Weight MS
High mass measurements were performed at CovalX AG (Schlieren, Switzerland) using an ABI 4800 MALDI TOF mass spectrometer retrofitted with CovalX HM2 TUVO high mass system. A phosphate-buffered saline buffer was used to prepare the Aβ ratios, which were subjected to cross-linking with gluteraldehyde at specific time points. Each sample was mixed with sinapinic acid matrix (10 mg/ml) in acetonitrile/water (1:1, v/v), TFA 0.1% and spotted on the MALDI plate (SCOUT 384, AchorChip). High-mass MALDI TOF MS analysis was performed using standard nitrogen laser and focusing on different mass ranges from 8 to 1000 kDa in linear and positive mode and at a gain voltage of 3.14 kV and an acceleration voltage of 20 kV for HM2 High-Mass detection. The instrument was calibrated using insulin, BSA, and IgG. The analysis was repeated in triplicate.
Solution NMR
Aβ samples for NMR studies varied between 20 and 200 μm (monomer concentration) in 50 mm Tris-HCl, 1 mm EDTA at pH 7.5, supplemented with 10% (v/v) D2O (>99.96%, Sigma Aldrich). The experiments were performed at 25 °C either on a Bruker Avance (equipped with cryoprobe) or on a Varian Inova spectrometer both operating at 14.1 Teslas (600 MHz). 15N sofast heteronuclear single quantum coherence (HSQC) spectra were each collected over 30 min to monitor aggregation. 15N NOESY-HSQC and 1H,1H TOCSY experiments were recorded at 5 °C to obtain sequence specific 1HN,15N assignments to identify the HSQC peaks. A combination of 15N-edited and 15N-filtered experiments (31) acquired on samples containing uniformly 15N-labeled and unlabeled Aβ peptides at different ratios was used to selectively monitor Aβ42 and Aβ40 in solution.
Protection factors of mature Aβ fibers were measured by comparing the amide peak intensities obtained for Aβ samples incubated in H2O or in D2O after for a period of 672 h to allow amide exchange. The fibers were collected by centrifugation, washed, and incubated in D2O at 25 °C for 48 h, flash-frozen to quench the hydrogen-deuterium exchange (HDX), lyophilized, and redissolved in 100% DMSO-d6 (99.9%, Cambridge Isotope Laboratories) acidified with 0.1% (v/v) trifluoroacetic acid (Fluka) for 30 s, followed by a 10-fold dilution with perdeuterated DMSO (32). Amide exchange was measured by collecting two-dimensional 15N-1H HSQC spectra in comparison to control samples that were incubated in H2O. The 15N-1H HSQC cross-peak assignment was confirmed with a 15N-resolved NOESY experiment.
Cross-seeding Monitored via NMR
Seeds were prepared of pure Aβ40 or pure Aβ42 as described above. An aliquot of 30 μl seeds (50 μm equivalent monomeric concentration) was mixed with 330 μl of the corresponding Aβ samples that were preincubated in an NMR tube (Shigemi), whereas the non-seeded signals were monitored. 15N-edited and 15N-filtered spectra (31) were acquired as a function of time to simultaneously monitor both Aβ alloforms in the 1:9 and 3:7 ratios, whereby Aβ42 was 15N-labeled and Aβ40 was unlabeled. Only one-dimensional proton spectra were recorded as a function of time for the pure Aβ40 or pure Aβ42 unlabeled samples.
RESULTS
Direct Interactions between Aβ40 and Aβ42
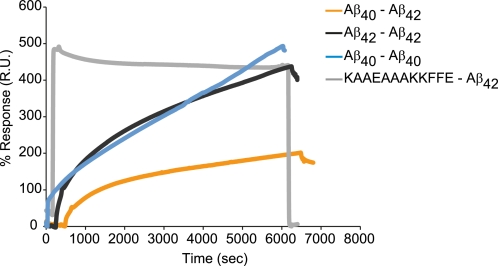
SPR was used to explore whether Aβ40 and Aβ42 are able to directly associate. Either biotinylated Aβ42 or Aβ40 were tethered to a chip and measurements of interactions between Aβ42-Aβ42 and Aβ40-Aβ40 adsorption resulted in initial fast adsorption of the Aβ peptides, followed by a slower kinetics phase of peptide binding, characteristic for high affinity binding (Fig. 1). A similar binding profile has been reported for the aggregation and fibrillization of isolated Aβ42, where a high incidence of specific binding is observed between 11-mercaptoundecanoic acid tethered Aβ42 and monomeric Aβ42 in bulk solution (33). The interaction between tethered Aβ42 with Aβ40 monomers showed a similar binding profile but slightly weaker binding. Binding between the same Aβ alloform resulted in greater mass adsorption to the sensor surface compared with mixed Aβ oligomeric interactions. These data show that the strongest binding occurs between the same alloform such as Aβ42-Aβ42 or Aβ40-Aβ40. However, strong specific binding was also observed between Aβ42-Aβ40.
FIGURE 1.
Aβ40 and Aβ42 interact directly. 10 μm covalently tethered biotinylated Aβ40 or Aβ42 to streptavidin-coated SA chips show binding between 10 μm Aβ variants. The sensorgram presents the interaction between Aβ40-Aβ42 (orange), Aβ42-Aβ42 (black), Aβ40-Aβ40 (blue), and the negative control nonspecific binding between Aβ42-KAAEAAAKKFFE (gray).
Different Molar Aβ42:Aβ40 Ratios Are Structurally Similar at Beginning of Aggregation Process
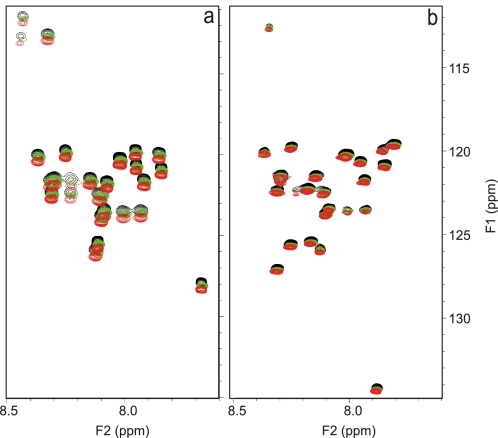
Because Aβ42 and Aβ40 were found to interact directly, we used NMR to explore whether the interactions could influence the conformation of Aβ at different Aβ42:Aβ40 ratios immediately following their preparation. The peptides were treated according to a new protocol designed to yield completely solubilized samples without solvent contamination (13). 15N-labeling of one Aβ alloform at a time allowed us to monitor the individual structural behavior of each alloform within the context of different molar ratios. The structural fingerprints of pure Aβ42 and Aβ40 peptides by the 15N-1HN HSQC spectra are in excellent agreement with data shown in the literature (Fig. 2) (27, 34). The spectra of 15N-labeled Aβ42 at different molar ratios do not present chemical shift variations, not even for the resonances of the C terminus, which should be the most sensitive to even a small change of environment (Fig. 2B). This indicates that the co-presence of the two alloforms has no influence on the structure at an atomic level, as expected for the monomeric state. The same is observed for Aβ40 (Fig. 2A). We conclude that samples with different Aβ ratios are structurally equivalent to samples of pure individual peptides prior to aggregation.
FIGURE 2.
The monomeric structures of Aβ42:Aβ40 ratios are identical at atomic level. Shown is the overlay of the 1H-15N HSQC spectra immediately after sample preparation of a, 15N-labeled Aβ40 in pure Aβ40 sample (black), ratio 1:9(15 N) (green) and ratio 3:7(15 N) (red). b, 15N-labeled Aβ42 in pure Aβ42 sample (black), ratio 1(15 N):9 (red), and ratio 3(15 N):7 (green). For representation purposes and clarity, we have artificially introduced a systematic shift of the spectra of the 1:9 and 3:7 Aβ42:Aβ40 ratios.
Fibers Formed by Different Aβ Ratios Have Similar Morphology and Cross-β Structure
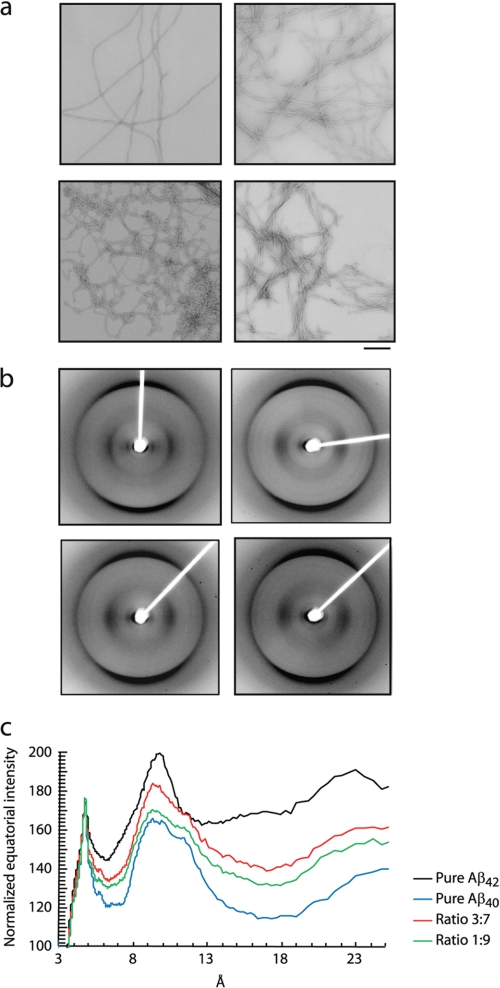
Negative stain TEM was used for a morphological characterization of the end states of the Aβ aggregation reactions. Upon long term incubation, all Aβ ratios display a similar morphology with long, unbranched amyloid fibrils with detectable helicity and uniform diameters of 5.4, 10.2, and 16 nm, depending on the number of laterally associated protofilaments (Fig. 3A). At a qualitative level, the fibrillar structure of the 3:7 ratio of Aβ42:Aβ40 appeared to be slightly more polymorphic compared with the other ratios.
FIGURE 3.
Morphology and detailed structure analysis of fibrils of Aβ42:Aβ40 ratios reveals similar structural characteristics. a, TEM images of Aβ ratios obtained upon aggregation for 2 weeks at 25 °C without agitation. Top left panel, pure Aβ40; top right panel, ratio 1:9; bottom left panel, ratio 3:7; bottom right panel, pure Aβ42. Bar, 200 nm. b, fiber diffraction patterns of Aβ ratios obtained upon aggregation for 4 weeks at 25 °C without agitation. Top left panel, pure Aβ40; top right panel, ratio 1:9; bottom left panel, ratio 3:7; bottom right panel, pure Aβ42. c, overlay showing the normalized x-ray scattering intensity function of D-spacing plotted from b.
X-ray fiber diffraction showed that the samples of pure Aβ and mixed ratios all exhibit the classic cross-β fiber diffraction patterns described in the literature (38, 39), showing a strong meridional reflection at 4.7 Å and a major equatorial reflection at ∼10 Å consistent with a cross-β architecture (Fig. 3B). The patterns arising from Aβ42 and Aβ40 fibrils both share the same 9.7–9.8 Å major equatorial reflection, which we attribute to the β-sheet spacing perpendicular to the fiber axis. The fiber diffraction pattern obtained from Aβ42 fibrils was distinguishable from Aβ40 fibrils only by the sharper signals likely to arise from a higher degree of order in the Aβ42 fibers, whereas the mixtures of the two peptides give rise to patterns that are virtually indistinguishable from that of Aβ40. This could be due to the large amount of Aβ40 relative to Aβ42 such that the signal from Aβ40 dominates the pattern. Although subtle differences in the fiber diffraction patterns likely arise from differing degrees of order and composition of the samples, the equatorial signal positions and relative intensities of signals are largely comparable for all samples (Fig. 3C).
To confirm structural similarity of fiber architecture of various Aβ ratios at a higher resolution, we measured the protection factors of the Aβ peptides by acquiring 15N-1HN HSQC spectra for monomeric Aβ40 and Aβ42 after resolubilizing amyloid fibers that were subjected to HDX (supplemental Fig. S1). Amide protection factors were measured by comparing the amide peak intensities obtained for the sample in H2O and the sample in D2O after the exchange period. The backbone amide chemical shift data are consistent with those previously reported in acidified DMSO-d6 (32), although we observed (partial) overlaps in the cross-peaks of residues 11/23, 12/18, 13/27, 19/40, and 32/41 for Aβ42 (supplemental data). Only residues 11/23 and 13/27 have overlapping cross-peaks in the Aβ40 spectrum. The HDX pattern of 15N-labeled Aβ40 for the 1:9(15 N) and 3:7(15 N) ratios and for pure Aβ40 fibers shows that the stretches comprising residues 18–22 and 30–34 are more protected from solvent exchange than the N terminus (supplemental Fig. S2). The C-terminal residues 37–40 also appear more accessible to solvent exchange. This agrees with earlier observations and proposed models for Aβ40 fibrils (18, 40–42). The HDX patterns of 15N-labeled Aβ42, Aβ40, and the ratios showed only small differences. Extensive exchange times (up to 672 h) (supplemental Fig. S2) of Aβ42 showed no noticeable effects in agreement with the suggestion that Aβ42 fibrils are highly resistant to solvent exchange (32, 43). The pattern for pure Aβ42 and the 3(15 N):7 and 1(15 N):9 ratios is less distinct but indicates a clear distinction between the N- and the C-terminal halves with higher protection of the C-terminal half.
We conclude that the architecture of Aβ fibers in pure or mixed form is overall indistinguishable both at a macromolecular and high resolution level, although small differences at atomic level may be present. As these mature fibrils have been shown to have weak toxicity, we will focus on differences in the oligomeric regime.
Aβ40 and Aβ42 Affect Aggregation Kinetics of the Other
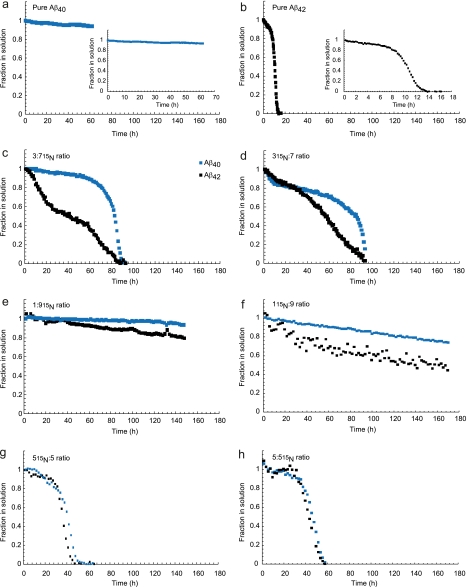
To address whether aggregation kinetics are affected by different ratios, we monitored the intensity of NMR spectra as a function of time, exploiting the disappearance of the resonances due to the increased molecular weight, typical of events in a slow exchange regime. We exploited again the possibility of 15N-isotope labeling only one of the Aβ alloforms, in combination with 15N-edited filter experiments to monitor the aggregation of both the 15N-labeled and unlabeled peptides simultaneously. This experimental setup offers the advantage that the individual Aβ alloforms are selectively observed in parallel and within the same sample preparation, thereby circumventing any uncertainty that might arise from different sample preparations or peptide batches. In all cases, we observed the concomitant disappearance of all peaks according to a cooperative behavior along the whole peptide or at least the region of it visible in the NMR spectrum. No sufficiently populated lower molecular weight assemblies were observed, indicating that Aβ aggregates directly into NMR invisible assemblies under these experimental conditions. Due to the long apparent lag phase, we did not detect a sigmoidal transition for Aβ40 and the 1:9 ratio over a time scale of 180 h (Fig. 4, A, E, and F). In contrast, pure Aβ42 aggregates very rapidly with a sigmoidal signal disappearance (Fig. 4B). Interestingly, the Aβ42 component of the 1:9 ratio remains in solution significantly longer in the presence of Aβ40. The kinetics recorded for Aβ40 and Aβ42 within the 3:7 ratios with either 15N-labeled Aβ42 or 15N-labeled Aβ40 (named 3(15 N):7 and 3:7(15 N), respectively) indicate that Aβ40 remains longer in solution compared with Aβ42, which aggregates more rapidly (Fig. 4, C and D). However, the complete loss of signal for Aβ42 in the presence of Aβ40 is delayed in comparison with pure Aβ42, suggesting that the shorter Aβ40 alloform reduces the aggregation propensity of the longer Aβ42 alloform. To make sure that these observations could not be explained as the average of populations containing only the same alloforms, we analyzed a 5:5 ratio where 15N-labeled Aβ42 or Aβ40 are present in equimolar amounts of the unlabeled alloform (Fig. 4, G and H). We observed a nearly simultaneous disappearance of the signals of Aβ42 and Aβ40, which strongly suggests co-aggregation of both peptides into mixed fibers. We conclude that Aβ40 and Aβ42 mutually influence the aggregation kinetics of the other.
FIGURE 4.
Aβ40 and Aβ42 show different aggregation behavior in different Aβ42:Aβ40 ratios. a, pure Aβ40 at a concentration of 180 μm does not aggregate within the timeframe of data collection. b, pure Aβ42 at a concentration of 20 μm displays a lag phase and a sigmoidal transition from monomeric species into NMR invisible aggregates. c, 3:7(15 N) ratio, whereby the Aβ sample is composed of 70% 15N-labeled Aβ40, which is monitored via HSQC (140 μm Aβ40 monomer concentration) and 30% unlabeled Aβ42 (at a monomer concentration of 60 μm), which is simultaneously monitored via the amide region 15N-filtered one-dimensional NMR spectrum. d, the 3(15 N):7 ratio whereby the Aβ sample is composed of 30% 15N-labeled Aβ42 and 70% unlabeled Aβ40. e, the 1:9(15 N) ratio with 10% unlabeled Aβ42 (20 μm) and 90% 15N-labeled Aβ40 (180 μm). f, the 1(15 N):9 ratio with 10% 15N-labeled Aβ42 and 90% unlabeled Aβ40. g, the 5(15 N):5 ratio whereby the 15N-labeled Aβ42 and unlabeled Aβ40 are present in equimolar amounts (60 μm of each alloform). h, the 5:5(15 N) ratio whereby equimolar amounts (60 μm) of unlabeled Aβ42 and 15N-labeled Aβ40 are present. The blue symbols represent Aβ40, and the black symbols correspond to Aβ42.
Aβ40 and Aβ42 Ratios Both Form Complex but Different Ensembles of Oligomers
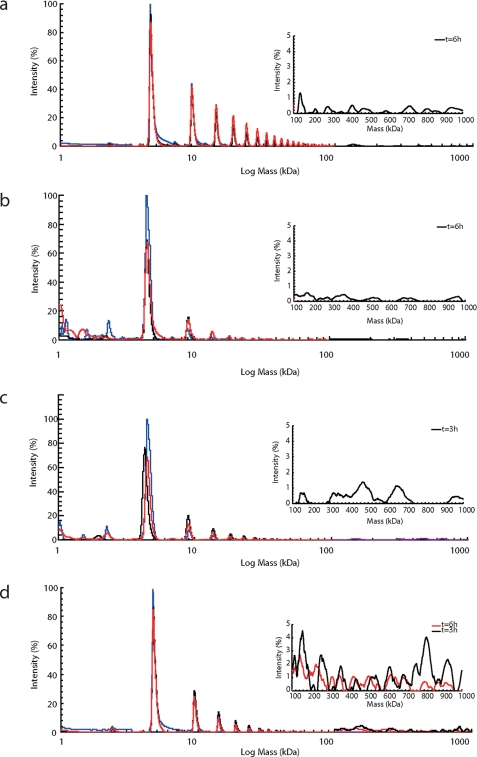
To investigate whether the observed alloform influence on the aggregation arises from an impact on the formation of intermediates along the aggregation pathway, we followed aggregation of the Aβ mixtures using high molecular weight MS, a technique that uses high voltages to enable detection of high molecular weight species. Because non-covalent complexes disassemble at these voltages, we incubated our samples prior to analysis with glutaraldehyde as cross-linking agent. The resulting masses reveal various interesting features (Fig. 5 and supplemental Table S1). First, the masses of Aβ42 and of the two mixtures are consistently larger than those of Aβ40, in support of the hypothesis that there are appreciable populations of oligomers that contain both alloforms. Second, early aggregation proceeds through a monomer addition process during which oligomers gradually grow by the addition of one monomer at a time. Third, in all cases we observed that assemblies accumulate during aggregation, the maximum size of which depends on the Aβ42:Aβ40 ratio. At an incubation time of 1 h, Aβ40 samples contain oligomers with a range of sizes from dimers up to 13-mers. As the process continues, larger oligomers are formed and after 6 h of incubation, 25-mer assemblies are detected together with larger oligomers at apparent molecular weights of 186 up to 852 kDa. For 1:9 ratios, we observe formation of much smaller oligomers with a maximum of 8-mers and accumulation of larger sized oligomers at apparent molecular masses of 171 up to 515 kDa. The 3:7 ratios aggregate in a similar manner but share features closer to the pattern observed for Aβ42. No very large molecular weight oligomers are observed after 6 h of incubation, presumably because they become so large that either they cannot become mobile or are not efficiently cross-linked. These results reveal clear differences in the pattern of small oligomeric species formed under different ratio conditions, indicating a potential basis for the difference in toxic effect (13).
FIGURE 5.
Oligomer formation by Aβ42:Aβ40 ratios shows a monomer addition process and a dynamic distribution of oligomeric species. Mass spectra of the different ratios with the high molecular weight detection spectra as insets whereby the blue trace is t = 1 h, the black trace is t = 3 h, and the red trace is t = 6 h. a, pure Aβ40; b, 1:9 ratio; c, 3:7 ratio; d, pure Aβ42. These aggregation patterns for the different ratios are also presented in supplemental Table S1.
Differences between Aβ42:Aβ40 Ratios Reside along Aggregation Pathway
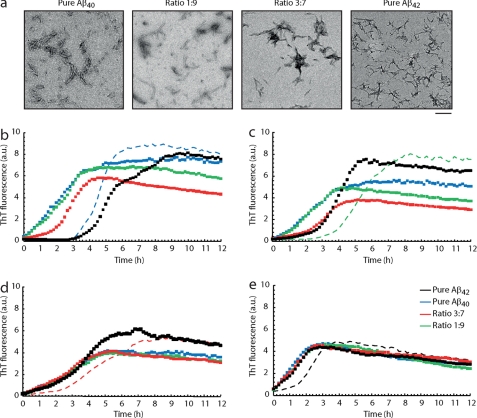
The influence of the Aβ40 and Aβ42 ratios on aggregation kinetics is also evident from cross-seeding experiments where sonicated protofibrils were added to monomeric solutions of different Aβ42:Aβ40 ratios. Seed preparations were verified by TEM (Fig. 6A) and added to freshly prepared monomeric Aβ solutions. The aggregation kinetics were followed by in situ ThT fluorescence (Fig. 6, B–E). Aβ40 aggregation was efficiently seeded by Aβ40 seeds and the 1:9 ratio seeds leading to elimination of the lag phase (Fig. 6B). The initial parts of the two curves overlap, indicating that the properties of Aβ40 are predominant, also in the 1:9 mixture. Addition of 3:7 seeds also induces aggregation, but some lag phase is retained. Addition of pure Aβ42 not only does not seed aggregation, but even lengthens the lag phase. Seeding of Aβ40 therefore appears to proceed in a highly specific manner with preference for the same alloform seeds. The 1:9 ratio is seeded by any seed but, as for pure Aβ40, Aβ40, and 1:9 seeds have a similar strong seeding effect, whereas Aβ42 and 3:7 seeds have a milder effect, which, however, still preferentially selects the same alloform (Fig. 6C). In contrast, pure Aβ42 and the 3:7 ratio were equally effectively seeded by any Aβ seed, regardless of whether they were formed from Aβ40 or Aβ42 or a mixture (Fig. 6, D and E). Therefore, it appears that Aβ42 monomers have a higher degree of plasticity so that they may use a less specific surface as a template, whereas Aβ40 oligomers have higher selectivity.
FIGURE 6.
Cross-seeding reveals that Aβ42 oligomers show plasticity, whereas Aβ40 oligomers display a higher selectivity. a, TEM of seed preparations. Seeds were prepared by incubation of 50 μm Aβ ratios for 24 h followed by sonication at maximum power for 10 min. From left to right: pure Aβ40, ratio 1:9; ratio 3:7, pure Aβ42. Bar, 0.2 μm. Freshly prepared seeds were added to monomeric solutions of Aβ42:Aβ40 ratios at final concentrations of 0.5 μm and 25 μm, respectively. b, ThT of Aβ40 monomers seeded with pure Aβ40 seeds (blue dotted trace); with seeds from ratio 1:9 (green dotted trace), with seeds from ratio 3:7 (red dotted trace), and with seeds from pure Aβ42 (black dotted trace). The blue dashed line represents the unseeded Aβ40 control. c, ThT of ratio 1:9 monomers seeded with Aβ ratios as compared with the non-seeded aggregation curve. The colors are as described in b. d, ThT of ratio 3:7 monomers seeded with Aβ ratios as compared with the non-seeded aggregation curve (red dashed line). Colors are as described in b. e, ThT of Aβ42 monomers seeded with Aβ ratios in comparison with the non-seeded sample (black dashed line). Colors are as described in b.
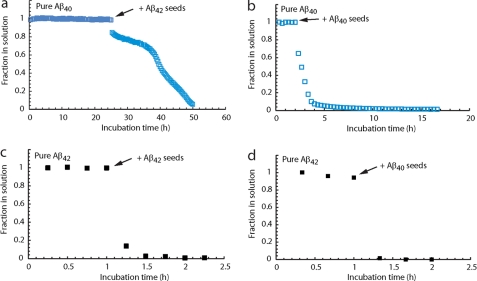
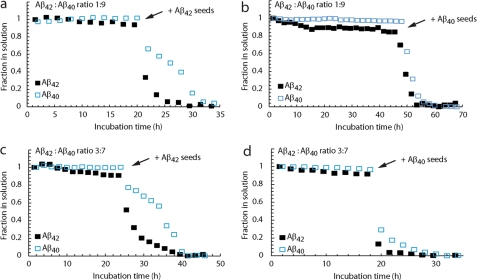
The effect of cross-seeding on the disappearance of the NMR signals of the different Aβ alloforms was also studied. In these experiments, we limited ourselves to the addition of seeds of pure Aβ40 or pure Aβ42 to the preincubated samples of which the NMR signals were monitored. In all cases, adding seeds resulted in appreciable aggregation irrespectively of the time point at which the addition was made. The control experiments were performed without any addition and this ensured that the effect is the direct consequence of the addition. Pure Aβ42 monomers could be easily seeded by both peptides (Figs. 7, C and D). Induction of aggregation of Aβ40 with Aβ40 seeds was also highly efficient (Fig. 7B), whereas Aβ42 seeds induced some initial signal disappearance but with a delayed aggregation (Fig. 7A). In the 1:9 and 3:7 ratios, Aβ40 seeds could efficiently induce aggregation of the two Aβ alloforms in the mixtures, while the Aβ42 seeds efficiently seeded the Aβ42 alloform, whereas the Aβ40 alloform lags behind in the aggregation. This implies that the presence of Aβ42 monomers in the ratios influences the behavior of the Aβ40 alloform. Overall, it is observed that the Aβ40 seeds can efficiently induce aggregation of Aβ samples, whereas the Aβ40 alloform responds less efficiently to the Aβ42 seeds (Fig. 8 and Table 1). These data show a genuine difference between the two peptides at the level of the oligomeric state. They reveal that even a relatively small increase in Aβ42 in the mixture confers aggregation properties to Aβ40 that are markedly more similar to pure Aβ42.
FIGURE 7.
Cross-seeding was monitored by NMR by recording one-dimensional proton spectra as a function of time with unlabeled pure Aβ40 (a and b) and pure Aβ42 (c and d) monomers using preformed Aβ40 seeds (b and d) and Aβ42 seeds (a and c). Pure Aβ40 samples (blue) were prepared at a concentration of 180 μm, whereas pure Aβ42 samples (black) were at a concentration of 20 μm. The addition of 10% (v/v) of a 50 μm (monomeric equivalent) seed preparation was added at the time points indicated by the arrow.
FIGURE 8.
Cross-seeding was monitored by 15N-filtered and 15N-edited NMR experiments with Aβ samples composed of the Aβ42:Aβ40 ratio 1(15 N):9 (a and b), whereby 20 μm15N-labeled Aβ42 is present with 180 μm unlabeled Aβ40 and the Aβ42:Aβ40 ratio 3(15 N):7 (c and d) with 60 μm15N-labeled Aβ42 and 140 μm unlabeled Aβ40. The addition of 10% (v/v) of a 50 μm (monomeric equivalent) preparation of preformed Aβ40 seeds (b and d) and Aβ42 seeds (a and c) is indicated by the arrows.
TABLE 1.
Efficiency of cross-seeding on Aβ alloforms as monitored by isotope-labeled NMR
| Monomeric sample | Seeds | Efficiency of seeding monitored by NMR |
|
|---|---|---|---|
| Aβ42 | Aβ40 | ||
| Pure Aβ42 | Aβ40 | +++ | NAa |
| Aβ42 | +++ | NA | |
| Aβ42:Aβ40 ratio 3:7 | Aβ40 | +++ | +++ |
| Aβ42 | +++ | + | |
| Aβ42:Aβ40 ratio 1:9 | Aβ40 | +++ | +++ |
| Aβ42 | +++ | + | |
| Pure Aβ40 | Aβ40 | NA | +++ |
| Aβ42 | NA | + | |
a NA, not applicable.
+, seeding induces aggregation, +++, seeding induces aggregation very efficiently.
DISCUSSION
Although previous structural studies have mostly focused on pure Aβ alloforms and the identification of a single oligomeric species, the present work aims to understand the determinants of the toxicity of different Aβ42:Aβ40 ratios. We demonstrate by independent evidence from MS, NMR, and SPR that the two peptides interact, although recognition between the same alloforms is preferred over interactions between different ones. We therefore expect that the populations of the two peptides in the aggregates will be mixed. This explains and expands previous data (23, 25, 27) that indicate that Aβ40 and Aβ42 influence their respective aggregation properties.
To understand which step along the aggregation pathway is responsible for this effect, we compared the structures and morphologies of all the species formed. We show that the initial monomeric and final fibrillar states do not differ to a large extent. NMR analysis of freshly prepared samples at different Aβ42:Aβ40 ratios conclusively reveals the presence of predominant monomeric species that lack a regular and well defined structure. Therefore, at this stage, the peptides are not affected by the presence of the other alloform. Likewise, we do not observe appreciable differences between the mature fibrillar states by TEM, HDX, and fiber diffraction: fibers formed during long incubation times are virtually identical. The absence of significant differences in the start and end points of Aβ fibrillation directed our focus to the formation of transient oligomeric intermediates. Previous data had indicated differences in the protofibrillar morphologies and Fourier transform infrared spectroscopy data following short term incubation, which, together with the present data, underline the importance of the aggregation pathway and of the dynamics of the oligomeric state (13, 44, 45).
We observed subtle but clear differences between the different Aβ ratios along the aggregation pathway. NMR experiments visualizing the spontaneous aggregation (Fig. 4) showed that the presence of monomeric Aβ40 slows down the aggregation kinetics of Aβ42, increasing the time frame that soluble forms are found in solution for any peptide ratio. Vice versa Aβ42 stimulates Aβ40 aggregation as revealed by comparing the 3:7 and 1:9 ratios with pure Aβ40. This is compatible with the view that Aβ42 drives aggregation and acts as a template by lowering the kinetic barriers that prevent Aβ40 from aggregating (15, 25, 46). Aβ40 potentially delays Aβ42 aggregation through “non-productive” interactions. Although these conclusions are in agreement with previous reports (25, 27, 46), our cross-seeding data suggest that Aβ40 monomers specifically require Aβ40 oligomers to induce growth of mature fibrils, whereas Aβ42 monomers are less selective and are stimulated by all types of seeds.
It might be argued that there is an apparent discrepancy between the progressive Aβ aggregation as monitored by NMR (Fig. 4) and the cross-seeding data (Figs. 6–8). By NMR, we observe that Aβ42 stimulates Aβ40 to aggregate while Aβ40 simultaneously delays Aβ42 aggregation. Vice versa, the cross-seeding data reveal that monomeric Aβ40 is not efficiently seeded by sonicated Aβ42 protofibrils. It is reasonable to explain this discrepancy by assuming that the oligomers formed during the aggregation process have features that are distinct from the sonicated protofibrillar species (seeds) that may have undergone advanced structural maturation. For pure Aβ42, these seeds would not be the optimal templates to directly incorporate Aβ40 monomers and perhaps even entail a conformational restructuring to lead to productive aggregation. We cannot rule out the possibility that monomeric Aβ40 could be able to resolubilize Aβ42 seeds, thereby bringing Aβ42 into solution and promoting in this way productive aggregation, as hinted by Yan and Wang (27). Because our observations with high molecular weight MS underline that the aggregation process proceeds through a monomer addition mechanism, the dynamic interplay (productive and non-productive) of monomeric Aβ with soluble Aβ assemblies seems appropriate to explain toxicity of the Aβ42:Aβ40 ratios. This relevance of monomer addition processes for neurotoxicity was recently described by Jan and colleagues for pure Aβ42 aggregation (44). Thus, the modulation of the Aβ oligomer formation by the Aβ42:Aβ40 ratio adds to the cause of neurotoxicity and the Alzheimer disease pathology.
In conclusion, our work indicates that the Aβ42:Aβ40 ratio behavior cannot be simply interpreted by stating that Aβ42 can induce Aβ40 aggregation while at the same time, Aβ40 can prevent or delay Aβ42 aggregation. Rather than the morphology of the amyloid fibrils, the Aβ42:Aβ40 ratio modulates the Aβ oligomer formation. Our data indicate that neurotoxicity is more likely to be explained by the dynamic nature of the ongoing Aβ aggregation rather than by the prevailing view that Aβ toxicity is associated with a distinct assembly. A change in the Aβ42:Aβ40 ratio induces differences in conformational plasticity of the oligomeric peptide mixtures and the pattern of detectable oligomeric species. That the oligomer formation along the amyloid assembly pathway is affected by the different Aβ ratios emphasizes the necessity to further expand our understanding of the exact compositional, temporal, and structural properties of the homo- and hetero-oligomers. The implications of this finding for AD therapy are fundamental: the results imply that it is less important to focus on lowering the total amyloid burden in patients, although it appears crucial to affect the relative ratios of the peptides.
Supplementary Material
Acknowledgments
We thank the MRC Biomedical NMR centre. We are sincerely indebted with Lesley Calder for generous assistance with TEM analysis. We acknowledge Bart De Strooper for useful discussions.
This work was supported in part by the Fund for Scientific Research Flanders, the Federal Office for Scientific Affairs, Belgium IUAP P6/43, Alzheimer's Research UK, the Research Foundation–Flanders (FWO), Stichting Alzheimer Onderzoek (SAO), and the FWO Odysseus Program.

This article contains supplemental Table S1 and Figs. S1 and S2.
- AD
- Alzheimer disease
- SPR
- surface plasmon resonance
- HDX
- hydrogen deuterium exchange
- DMSO
- dimethyl sulfoxide
- TEM
- transmission electron microscopy
- ThT
- thioflavin T
- HSQC
- heteronuclear single quantum coherence.
REFERENCES
- 1. McLean C. A., Cherny R. A., Fraser F. W., Fuller S. J., Smith M. J., Beyreuther K., Bush A. I., Masters C. L. (1999) Soluble pool of Aβ amyloid as a determinant of severity of neurodegeneration in Alzheimer disease. Ann. Neurol. 46, 860–866 [DOI] [PubMed] [Google Scholar]
- 2. Lambert M. P., Barlow A. K., Chromy B. A., Edwards C., Freed R., Liosatos M., Morgan T. E., Rozovsky I., Trommer B., Viola K. L., Wals P., Zhang C., Finch C. E., Krafft G. A., Klein W. L. (1998) Diffusible, nonfibrillar ligands derived from Aβ1–42 are potent central nervous system neurotoxins. Proc. Natl. Acad. Sci. U.S.A. 95, 6448–6453 [DOI] [PMC free article] [PubMed] [Google Scholar]
- 3. Klyubin I., Betts V., Welzel A. T., Blennow K., Zetterberg H., Wallin A., Lemere C. A., Cullen W. K., Peng Y., Wisniewski T., Selkoe D. J., Anwyl R., Walsh D. M., Rowan M. J. (2008) Amyloid β protein dimer-containing human CSF disrupts synaptic plasticity: prevention by systemic passive immunization. J. Neurosci. 28, 4231–4237 [DOI] [PMC free article] [PubMed] [Google Scholar]
- 4. Shankar G. M., Li S., Mehta T. H., Garcia-Munoz A., Shepardson N. E., Smith I., Brett F. M., Farrell M. A., Rowan M. J., Lemere C. A., Regan C. M., Walsh D. M., Sabatini B. L., Selkoe D. J. (2008) Amyloid β protein dimers isolated directly from Alzheimer brains impair synaptic plasticity and memory. Nat. Med. 14, 837–842 [DOI] [PMC free article] [PubMed] [Google Scholar]
- 5. Lashuel H. A., Hartley D., Petre B. M., Walz T., Lansbury P. T., Jr. (2002) Nature 418, 291. [DOI] [PubMed] [Google Scholar]
- 6. Suzuki N., Cheung T. T., Cai X. D., Odaka A., Otvos L., Jr., Eckman C., Golde T. E., Younkin S. G. (1994) An increased percentage of long amyloid β protein secreted by familial amyloid β protein precursor (β APP717) mutants. Science 264, 1336–1340 [DOI] [PubMed] [Google Scholar]
- 7. Duff K., Eckman C., Zehr C., Yu X., Prada C. M., Perez-tur J., Hutton M., Buee L., Harigaya Y., Yager D., Morgan D., Gordon M. N., Holcomb L., Refolo L., Zenk B., Hardy J., Younkin S. (1996) Increased amyloid β42(43) in brains of mice expressing mutant presenilin 1. Nature 383, 710–713 [DOI] [PubMed] [Google Scholar]
- 8. Scheuner D., Eckman C., Jensen M., Song X., Citron M., Suzuki N., Bird T. D., Hardy J., Hutton M., Kukull W., Larson E., Levy-Lahad E., Viitanen M., Peskind E., Poorkaj P., Schellenberg G., Tanzi R., Wasco W., Lannfelt L., Selkoe D., Younkin S. (1996) Secreted amyloid β protein similar to that in the senile plaques of Alzheimer disease is increased in vivo by the presenilin 1 and 2 and APP mutations linked to familial Alzheimer disease. Nat. Med. 2, 864–870 [DOI] [PubMed] [Google Scholar]
- 9. Hellström-Lindahl E., Viitanen M., Marutle A. (2009) Comparison of Aβ levels in the brain of familial and sporadic Alzheimer disease. Neurochem. Int. 55, 243–252 [DOI] [PMC free article] [PubMed] [Google Scholar]
- 10. Citron M., Westaway D., Xia W., Carlson G., Diehl T., Levesque G., Johnson-Wood K., Lee M., Seubert P., Davis A., Kholodenko D., Motter R., Sherrington R., Perry B., Yao H., Strome R., Lieberburg I., Rommens J., Kim S., Schenk D., Fraser P., St. George Hyslop P., Selkoe D. J. (1997) Mutant presenilins of Alzheimer disease increase production of 42-residue amyloid β protein in both transfected cells and transgenic mice. Nat Med 3, 67–72 [DOI] [PubMed] [Google Scholar]
- 11. Mann D. M., Iwatsubo T., Cairns N. J., Lantos P. L., Nochlin D., Sumi S. M., Bird T. D., Poorkaj P., Hardy J., Hutton M., Prihar G., Crook R., Rossor M. N., Haltia M. (1996) Amyloid β protein (Aβ) deposition in chromosome 14-linked Alzheimer disease: predominance of Aβ42(43). Ann Neurol 40, 149–156 [DOI] [PubMed] [Google Scholar]
- 12. Wang R., Wang B., He W., Zheng H. (2006) Wild-type presenilin 1 protects against Alzheimer disease mutation-induced amyloid pathology. J. Biol. Chem. 281, 15330–15336 [DOI] [PubMed] [Google Scholar]
- 13. Kuperstein I., Broersen K., Benilova I., Rozenski J., Jonckheere W., Debulpaep M., Vandersteen A., Segers-Nolten I., Van Der Werf K., Subramaniam V., Braeken D., Callewaert G., Bartic C., D'Hooge R., Martins I. C., Rousseau F., Schymkowitz J., De Strooper B. (2010) Neurotoxicity of Alzheimer disease Aβ peptides is induced by small changes in the Aβ42 to Aβ40 ratio. EMBO J. 29, 3408–4320 [DOI] [PMC free article] [PubMed] [Google Scholar]
- 14. Yoshiike Y., Chui D. H., Akagi T., Tanaka N., Takashima A. (2003) Specific compositions of amyloid β peptides as the determinant of toxic β aggregation. J. Biol. Chem. 278, 23648–23655 [DOI] [PubMed] [Google Scholar]
- 15. Jarrett J. T., Lansbury P. T., Jr (1993) Seeding “one-dimensional crystallization” of amyloid: a pathogenic mechanism in Alzheimer disease and scrapie? Cell 73, 1055–1058 [DOI] [PubMed] [Google Scholar]
- 16. Bitan G., Vollers S. S., Teplow D. B. (2003) Elucidation of primary structure elements controlling early amyloid β protein oligomerization. J. Biol. Chem. 278, 34882–34889 [DOI] [PubMed] [Google Scholar]
- 17. Chen Y. R., Glabe C. G. (2006) Distinct early folding and aggregation properties of Alzheimer amyloid β peptides Aβ40 and Aβ42: stable trimer or tetramer formation by Aβ42. J. Biol. Chem. 281, 24414–24422 [DOI] [PubMed] [Google Scholar]
- 18. Petkova A. T., Ishii Y., Balbach J. J., Antzutkin O. N., Leapman R. D., Delaglio F., Tycko R. (2002) A structural model for Alzheimer β amyloid fibrils based on experimental constraints from solid state NMR. Proc. Natl. Acad. Sci. U.S.A. 99, 16742–16747 [DOI] [PMC free article] [PubMed] [Google Scholar]
- 19. Schmidt M., Sachse C., Richter W., Xu C., Fändrich M., Grigorieff N. (2009) Comparison of Alzheimer Aβ(1–40) and Aβ(1–42) amyloid fibrils reveals similar protofilament structures. Proc. Natl. Acad. Sci. U.S.A. 106, 19813–19818 [DOI] [PMC free article] [PubMed] [Google Scholar]
- 20. Kirschner D. A., Abraham C., Selkoe D. J. (1986) X-ray diffraction from intraneuronal paired helical filaments and extraneuronal amyloid fibers in Alzheimer disease indicates cross-β conformation. Proc. Natl. Acad. Sci. U.S.A. 83, 503–507 [DOI] [PMC free article] [PubMed] [Google Scholar]
- 21. Malinchik S. B., Inouye H., Szumowski K. E., Kirschner D. A. (1998) Structural analysis of Alzheimer β(1–40) amyloid: protofilament assembly of tubular fibrils. Biophys. J. 74, 537–545 [DOI] [PMC free article] [PubMed] [Google Scholar]
- 22. Sikorski P., Atkins E. D., Serpell L. C. (2003) Structure and texture of fibrous crystals formed by Alzheimer Aβ(11–25) peptide fragment. Structure 11, 915–926 [DOI] [PubMed] [Google Scholar]
- 23. Snyder S. W., Ladror U. S., Wade W. S., Wang G. T., Barrett L. W., Matayoshi E. D., Huffaker H. J., Krafft G. A., Holzman T. F. (1994) Amyloid β aggregation: selective inhibition of aggregation in mixtures of amyloid with different chain lengths. Biophys. J. 67, 1216–1228 [DOI] [PMC free article] [PubMed] [Google Scholar]
- 24. Frost D., Gorman P. M., Yip C. M., Chakrabartty A. (2003) Co-incorporation of Aβ40 and Aβ42 to form mixed prefibrillar aggregates. Eur. J. Biochem. 270, 654–663 [DOI] [PubMed] [Google Scholar]
- 25. Jan A., Gokce O., Luthi-Carter R., Lashuel H. A. (2008) The ratio of monomeric to aggregated forms of Aβ40 and Aβ42 is an important determinant of amyloid-β aggregation, fibrillogenesis, and toxicity. J. Biol. Chem. 283, 28176–28189 [DOI] [PMC free article] [PubMed] [Google Scholar]
- 26. Kim J., Onstead L., Randle S., Price R., Smithson L., Zwizinski C., Dickson D. W., Golde T., McGowan E. (2007) Aβ40 inhibits amyloid deposition in vivo. J. Neurosci. 27, 627–633 [DOI] [PMC free article] [PubMed] [Google Scholar]
- 27. Yan Y., Wang C. (2007) Aβ40 protects non-toxic Aβ42 monomer from aggregation. J. Mol. Biol. 369, 909–916 [DOI] [PubMed] [Google Scholar]
- 28. Broersen K., Jonckheere W., Rozenski J., Vandersteen A., Pauwels K., Pastore A., Rousseau F., Schymkowitz J. (2011) A standardized and biocompatible preparation of aggregate-free amyloid beta peptide for biophysical and biological studies of Alzheimer's disease. Prot. Eng. Des. Sel. 24, 743–750 [DOI] [PubMed] [Google Scholar]
- 29. Marshall K. E., Morris K. L., Charlton D., O'Reilly N., Lewis L., Walden H., Serpell L. C. (2011) Hydrophobic, aromatic, and electrostatic interactions play a central role in amyloid fibril formation and stability. Biochemistry 50, 2061–2071 [DOI] [PubMed] [Google Scholar]
- 30. Makin O. S., Sikorski P., Serpell L. C. (2007) CLEARER: a new tool for the analysis of x-ray fibre diffraction patterns and diffraction simulation from atomic structural models. J. Appl. Cryst. 40, 966–972 [Google Scholar]
- 31. Ikura M., Bax A. (1992) Isotope-filtered 2D NMR of a protein-peptide complex: study of a skeletal muscle myosin light chain kinase fragment bound to calmodulin. J. Am. Chem. Soc. 114, 2433–2440 [Google Scholar]
- 32. Lührs T., Ritter C., Adrian M., Riek-Loher D., Bohrmann B., Döbeli H., Schubert D., Riek R. (2005) Three-dimensional structure of Alzheimer amyloid-β(1–42) fibrils. Proc. Natl. Acad. Sci. U.S.A. 102, 17342–17347 [DOI] [PMC free article] [PubMed] [Google Scholar]
- 33. Ryu J., Joung H. A., Kim M. G., Park C. B. (2008) Surface plasmon resonance analysis of Alzheimer β-amyloid aggregation on a solid surface: from monomers to fully grown fibrils. Anal. Chem. 80, 2400–2407 [DOI] [PubMed] [Google Scholar]
- 34. Hou L., Shao H., Zhang Y., Li H., Menon N. K., Neuhaus E. B., Brewer J. M., Byeon I. J., Ray D. G., Vitek M. P., Iwashita T., Makula R. A., Przybyla A. B., Zagorski M. G. (2004) Solution NMR studies of the Aβ(1–40) and Aβ(1–42) peptides establish that the Met-35 oxidation state affects the mechanism of amyloid formation. J. Am. Chem. Soc. 126, 1992–2005 [DOI] [PubMed] [Google Scholar]
- 35. Deleted in proof.
- 36. Deleted in proof.
- 37. Deleted in proof.
- 38. Eanes E. D., Glenner G. G. (1968) X-ray diffraction studies on amyloid filaments. J. Histochem. Cytochem. 16, 673–677 [DOI] [PubMed] [Google Scholar]
- 39. Makin O. S., Serpell L. C. (2005) Structures for amyloid fibrils. FEBS J. 272, 5950–5961 [DOI] [PubMed] [Google Scholar]
- 40. Whittemore N. A., Mishra R., Kheterpal I., Williams A. D., Wetzel R., Serpersu E. H. (2005) Hydrogen-deuterium (H/D) exchange mapping of Aβ 1–40 amyloid fibril secondary structure using nuclear magnetic resonance spectroscopy. Biochemistry 44, 4434–4441 [DOI] [PubMed] [Google Scholar]
- 41. Olofsson A., Lindhagen-Persson M., Sauer-Eriksson A. E., Ohman A. (2007) Amide solvent protection analysis demonstrates that amyloid-β(1–40) and amyloid-β(1–42) form different fibrillar structures under identical conditions. Biochem. J. 404, 63–70 [DOI] [PMC free article] [PubMed] [Google Scholar]
- 42. Wetzel R., Shivaprasad S., Williams A. D. (2007) Plasticity of amyloid fibrils. Biochemistry 46, 1–10 [DOI] [PMC free article] [PubMed] [Google Scholar]
- 43. Olofsson A., Sauer-Eriksson A. E., Ohman A. (2006) The solvent protection of Alzheimer amyloid β-(1–42) fibrils as determined by solution NMR spectroscopy. J. Biol. Chem. 281, 477–483 [DOI] [PubMed] [Google Scholar]
- 44. Jan A., Adolfsson O., Allaman I., Buccarello A. L., Magistretti P. J., Pfeifer A., Muhs A., Lashuel H. A. (2011) Aβ42 neurotoxicity is mediated by ongoing nucleated polymerization process rather than by discrete Aβ42 species. J. Biol. Chem. 286, 8585–8596 [DOI] [PMC free article] [PubMed] [Google Scholar]
- 45. Wogulis M., Wright S., Cunningham D., Chilcote T., Powell K., Rydel R. E. (2005) Nucleation-dependent polymerization is an essential component of amyloid-mediated neuronal cell death. J. Neurosci. 25, 1071–1080 [DOI] [PMC free article] [PubMed] [Google Scholar]
- 46. Myszka D. G., Wood S. J., Biere A. L. (1999) Analysis of fibril elongation using surface plasmon resonance biosensors. Methods Enzymol. 309, 386–402 [DOI] [PubMed] [Google Scholar]
Associated Data
This section collects any data citations, data availability statements, or supplementary materials included in this article.


