

Abstract
Epoxyeicosatrienoic acids that have anti-hypertensive and anti-inflammatory properties are mainly metabolized by soluble epoxide hydrolase (sEH, EC 3.3.2.3). Therefore, sEH has emerged as a therapeutic target for treating various cardiovascular diseases and inflammatory pain. N,N’-Disubstituted ureas are potent sEH inhibitors in vitro. However, in vivo usage of early sEH inhibitors has been limited by their low bioavailability and poor physiochemical properties. Therefore, a group of highly potent compounds with more drug-like physiochemical properties were evaluated by monitoring their plasma profiles in dogs treated orally with sEH inhibitors. Urea compounds with an adamantyl or a 4-trifluoromethoxyphenyl group on one side and a piperidyl or a cyclohexyl ether group on the other side of the urea function showed pharmacokinetic profiles with high plasma concentrations and long half lives. In particular, the inhibitor trans-4-[4-(3-adamantan-1-yl-ureido)-cyclohexyloxy]-benzoic acid (t-AUCB) not only is very potent with good physiochemical properties, but also shows high oral bioavailability for doses ranging from 0.01 to 1 mg/kg. This compound is also very potent against the sEH of several mammals, suggesting that t-AUCB will be an excellent tool to evaluate the biology of sEH in multiple animal models. Such compounds may also be a valuable lead for the development of veterinary therapeutics.
Keywords: Soluble epoxide hydrolase inhibitor, Pharmacokinetics, Bioavailability, epoxyeicosatrienoic acids, inflammation, cardiovascular diseases
1. Introduction
Epoxyeicosatrienoic acids (EETs) are endogenous signalling molecules produced by cytochrome P450 from arachidonic acid (Spector, 2008). The EETs act as vasodilators by activating Ca2+-activated K+ channels in vascular smooth muscle cells (Fleming, 2007). EETs also possess anti-inflammatory properties in endothelial cells (Node et al., 1999). EETs and related epoxy fatty acids are mainly metabolized by the soluble epoxide hydrolase (sEH; EC 3.3.2.3) (Liu et al., 2005; Newman et al., 2005), which hydrolyzes the EETs into dihydroxyeicosatrienoic acids (DHETs), resulting in partial or complete loss of their initial biological activities. Inhibition of sEH stabilizes endogenous EETs and thus reduces hypertension in multiple rodent models (Imig et al., 2002; Imig et al., 2005; Jung et al., 2005; Chiamvimonvat et al., 2007; Huang et al., 2007; Loch et al., 2007). The inhibition of sEH also reduces the production of nitric oxide, cytokines and pro-inflammatory lipid mediators, in addition to significantly improving survival in lipopolysaccharide (LPS)-induced systemic inflammation in mice (Liu et al., 2005; Schmelzer et al., 2005; Smith et al., 2005). The sEH is also a potential target for the treatment of ischemic stroke (Dorrance et al., 2005; Zhang et al., 2007a) and cardiac hypertrophy (Xu et al., 2006). Furthermore, sEH inhibition reduces pain in several rodent models (Inceoglu et al., 2006). Thus, sEH is an emerging target for pharmacological treatment of cardiovascular diseases (Monti et al., 2008), inflammation, and possibly other diseases (Gauthier et al., 2007; Harris et al., 2008).
N,N’-Disubstituted ureas are potent sEHIs (sEH inhibitors) with Kis in the low nanomolar range (Morisseau et al., 1999b). Early urea-based inhibitors, such as 12-(3-adamantane-1-yl-ureido)- dodecanoic acid (AUDA), 12-(3-adamantane-1-yl-ureido)- dodecanoic acid n-butyl ester (AUDA-nBE) and 1-adamantan-1-yl-3-{5-[2-(2- ethoxyethoxy)ethoxy]pentyl}urea (AEPU) (Imig et al., 2002; Kim et al., 2004), were used to investigate the biology associated with the inhibition of sEH in animal models (Dorrance et al., 2005; Imig et al., 2005; Jung et al., 2005; Schmelzer et al., 2005; Sellers et al., 2005; Smith et al., 2005; Inceoglu et al., 2006; Xu et al., 2006; Ai et al., 2007; Huang et al., 2007; Loch et al., 2007; Zhang et al., 2007a; Li et al., 2008; Olearczyk et al., 2008; Parrish et al., 2008). However, their in vivo usage is limited due to poor physiochemical properties, rapid metabolism and/or poor bioavailability. Tedious formation such as the use of nanocrystals from cryomilling with careful selection of salts and solvents are needed to formulate such materials for efficient delivery in a small capsule (Ghosh et al., 2008). As an alternative to such formulation approaches, a medicinal chemistry approach was taken to develop new potent inhibitors that are more water-soluble and more metabolically stable by methodically modifying their structures (Zhao et al., 2004; Hwang et al., 2006; Jones et al., 2006; Li et al., 2006; Morisseau et al., 2006; Hwang et al., 2007; Kim et al., 2007a; Kim et al., 2007b; Kasagami et al., 2009; Shen et al., 2009).
While simple, rapid and efficient methods have been developed to estimate the inhibitory potency of new compounds (Jones et al., 2005; Wolf et al., 2006) as well as their solubility and other physiochemical properties, it is more difficult and costly to evaluate their pharmacokinetic properties. It is believed that compounds with favorable pharmacokinetics are more likely to be efficacious and safe (Dingemanse and Appel-Dingemanse, 2007). We previously developed a rapid pharmacokinetic screening method using cassette dosing and measuring compounds with minuscule serial bleedings in mice (Watanabe et al., 2006). This method was efficient in classifying compounds on their relative bioavailability. However, because of the small size of the animal used, it is difficult to extrapolate to larger animals or humans. Although we routinely monitor blood levels with 5 μl of blood for these compounds (Watanabe et al., 2006), the small volume of blood in a mouse limits our ability to monitor multiple blood biomarkers and, in particular, oxylipins which are promising indicators of the efficacy of sEHIs in vivo. Herein we report the use of dogs (black Labrador retrievers) for rapid pharmacokinetics screen of sEHIs. Due to the relatively large body size of the dogs (~20 kg each), this method allows for easier administration of drugs and collection of plasma with larger sample size. Moreover, dogs are much closer phylogenetically and in size to humans than rodents, making extrapolation to humans more reliable (Tibbitts, 2003). Finally, there is a need for novel anti-inflammatory and pain therapies in dogs and cats (Lascelles et al., 2005). For example, the non-steroid anti-inflammatory drugs (NSAIDs) are potent canine analgesic and anti-inflammatory drugs, but their use is limited by a variety of adverse effects such as causing gastrointestinal disorders. Thus, the canine data obtained herein will not only be valuable in refining the structure of sEHI for clinical use in humans and for use in canine models of human diseases, but also these data could lead to the development of novel veterinary therapeutics either used alone or as synergists with existing drugs such as NSAIDs (Schmelzer et al., 2006).
2. Materials and Methods
2.1. Chemicals
All sEHIs tested were synthesized according to previously reported methods (Kim et al., 2004; Kim et al., 2005; Hwang et al., 2006; Jones et al., 2006; Morisseau et al., 2006; Hwang et al., 2007; Kim et al., 2007a; Kim et al., 2007b; Kasagami et al., 2009). References for the synthesis and properties are given in Table S1. Details for the preparation of new compounds (17, 18, 25, 26, 27, 29, 30, 31, and 32) are described in supplementary material. The purity and structural assignment of all compounds were supported at least by NMR and MS. The purity was supported additionally by TLC chromatography at least two systems, a sharp melting point, and a single peak on LC/MS. In each case, LC/MS and NMR analysis indicated that a symmetrical urea, which is a possible side-product formed during the urea synthesis and also a potent sEHI, exists below the detection limit. HPLC-grade methanol, acetonitrile, and ethyl acetate were purchased from Fisher Scientific (Pittsburgh, PA). Formic acid (98%) and lactose were purchased from Sigma-Aldrich (St. Louis, MO). Water (>18.0 MΩ) was purified by NANO pure II system (Barnstead, Newton, MA). Hydroxypropylmethylcellulose (HPMC) was purchased from the Dow Chemical Company (Midland, MI). Oleic ester rich triglyceride was a gift from Adams Specialty Oils (Arbuckle, CA).
2.2. Animals and Dosing
All animal experiments were performed according to the protocols approved by the Animal Use and Care Committee of University of California-Davis. Three female black Labrador retrievers (5 to 6 years old; 17-22 kg) were obtained from a previous study (Frick et al., 2005) and housed at the U.C. Davis animal facility. They were given water ad libidum and fed twice a day at 7 a.m. and 3 p.m. On the day of an experiment, food was provided 2 hours after drug administration (generally around 9 a.m.). Studies were conducted once a week (generally on Tuesday), allowing the dogs to completely eliminate any inhibitor and recover. In the morning of an experiment, the cephalic veins of the dogs were catheterized per-cutaneously with a 20 gauge catheter, secured with Vetwrap™, and maintained in place for the duration of the experiment. The catheters were removed at the end of the study. For high-throughput screening (n = 1), the inhibitors were given in cassettes of three compounds at a dose of 0.3 mg/kg for each adjusted by weight. The day before the administration, 6 mg of each inhibitor was weighed and dissolved in 1 ml of commercially available triglyceride (Crisco®, Ohio). The solutions were sonicated at 50 °C for 10 min and checked to insure a transparent solution. Then, the three solutions were mixed together in a final volume of 3 ml triglycerides, warmed to 30-35 °C, and the appropriate amount was given orally to the dogs by eating. The blood samples (1 ml) were collected at scheduled time points up to 24 hours into blood collection tubes containing 0.04 ml of 7.5% EDTA (K3) solution (Kendall, Massachusetts) and centrifuged immediately at 3000 rpm for 10 minutes. The plasma was transferred to a fresh tube and stored at -80 °C until further use. For the determination of oral bioavailability (n = 3), compounds were given both i.v. and p.o. with single-compound dosing and diluted in 10 ml to yield a dose of 0.3 or 0.1 mg/kg depending on their solubility. AEPU, t-AUCB, and APAU were dissolved in 0.9% NaCl 99:1 water-ethanol, 0.9% NaCl 99:1 water-morpholine, and 0.9% NaCl in water, respectively. For the dose-response study, t-AUCB was dissolved in 0.9% NaCl 99:1 water-morpholine to yield doses of 0.03, 0.1, 0.3, and 1 mg/kg. For the comparison of various formulation methods, a dose of t-AUCB of 0.3 mg/kg was used. Gelatin capsules (size 00) were used to administer solid forms of t-AUCB given as the pure compound or a mixture with 1:1 HPMC/lactose at 1:10 ratio.
2.3. Sample Preparation
In polypropylene microcentrifuge tubes, 100 μl of plasma was added to 200 μl of water followed by 10 μl of surrogate solution (1-(5-butoxypentyl)-3-adamantylurea at 250 ng/ml in methanol). After mixing 500 μl of ethyl acetate was added and then vigorously mixed for 30 seconds. The organic layer was collected into a new tube after centrifuging at 12,000 g for 5 minutes. The extraction was repeated and the combined organic layers were dried under vacuum. The samples were reconstituted with 50 μl of internal standard solution (100 ng/ml of 1-adamantan-1-yl-3-decyl-urea in methanol), and then transferred into a glass insert for LC/MS quantitative analysis. Extraction efficiency for the surrogate standard spiked at 50 ng/ml in the plasma was 102±10 S.D. The surrogate standard and analyte standard curves were used to insure that there was high extraction efficiency.
2.4. Analytical Procedures
LC-MS/MS analyses were carried out using a Micromass Quattro Premier triple quadrupole tandem mass spectrometer (Micromass, Manchester, UK) interfaced to an electrospray ionization source (ESI). The ESI was performed following HPLC in the positive mode at 1.0 kV capillary voltage. The source and the desolvation temperatures were set at 125 °C and 300 °C, respectively. Cone gas (N2) and desolvation gas (N2) were maintained at flow rates of 50 and 650 l/h, respectively. Mass spectra of the precursor ions were obtained by syringe pump infusions, while scanning over the range of 50 to 550 m/z at 1 s/scan. Data were acquired in continuous mode. Quantitative analysis was performed in the multiple reaction monitoring (MRM) mode with a dwell time of 0.2 seconds. The MRM of each analyte is listed in the supplementary data (Table S1). The separation was performed by Ultra Performance LC (UPLC; Waters Corporation, Milford, MA) equipped an Acquity column (BEH C18, 50 × 2.1 mm I. D., 1.7 μm; Waters Corporation) with a flow rate of 0.3 ml/min at ambient temperature. Solvent A was 10% acetonitrile and 89.9% water containing 0.1% formic acid and solvent B was acetonitrile containing 0.1 % formic acid. Mobile phases were mixed with a linear gradient from 30 % B to 100 % B over 0-5 min. Following the gradient, the mobile phase was kept at 100% B for 8 minutes followed by a return to initial conditions for a 2 minute equilibrium. The post run was performed to equilibrate the column to the initial conditions for 2 minutes before the next run. Data were analyzed with MassLynx software version 4.1.
Stock solutions (200-800 μg/ml) of each compound were prepared in methanol and stored at -20 °C (Watanabe et al., 2006). These solutions were further diluted with methanol to give a series of standards with concentrations ranging from 0.98 to 250 ng/ml. The calibration curves were calculated by (1/x) least-square linear regression analysis of the peak area ratio of analytes to internal standard versus the concentration of the standards by weight. The limit of detection (LOD) was defined as the concentration which gave a blank signal±3 S.D. on the calibration curve (Table S1). Five uls of standard solutions and the extracted plasma samples were injected onto the column. Repeated injections of the same samples provided 5-10% variation. The extraction efficiencies were confirmed by spiking respective amounts of surrogate and selected analytes to blank dog plasma. The extraction recoveries were 80-120% for selected analytes over a large range of polarity. Even for compound 14 (APAU, one of the most polar compounds analyzed) the recovery was 85±5%. The accuracies of the method for multiple analytes extracted from dog plasma (n= 5, for each analyte) was under 10% S.D. and the precisions were less than 10%. In these cases the samples extracted from dog plasma were compared with samples extracted in the same way from water and from direct methanol injections. There was no difference detected in extraction efficiency, accuracy or precision among the three methods. Therefore for the actual run the standard curve was prepared in methanol.
2.5. Analysis of epoxides and diols
Samples stored at -80°C were thawed at room temperature and spiked with 10 μl 500 nM surrogate solution (PGE2-d4, 11(12)-EET-d8). Solid phase extraction was performed with Waters Oasis HLB cartridges (3cc/60 mg) and the cartridges were washed with 6 ml of 5% methanol/water solution containing 0.1% acetic acid. Then, the analytes were eluted into a tube with 0.5 ml methanol followed by 2 ml of ethyl acetate. The eluate was evaporated with 10 μl of a trap solution (30% glycerol in methanol) by vacuum centrifugation (Speed-Vac). Prior to analysis, residues were reconstituted by adding 50μl of 200 nM of the internal standard solution described in the supplementary materials. The conditions for the LC were as follows; Acquity BEH C18 column (100×2.1 mm, particle size 1.7um, Waters Co.) at flow rate 400 μl/min, buffer A was 0.1% (v/v) acetic acid in H2O, buffer B was 0.1% (v/v) acetic acid in a solution of acetonitrile/methanol mixture (85/10 (v/v)). The gradient table is attached in the supplementary material (Table S2). For MS/MS analyses, a 4000 QTRAP (Applied Biosystems, Foster City, CA) hybrid, triple-quadrupole, linear ion trap mass spectrometer equipped with a Turbo V ion source was used and operated in MRM mode. The source was operated in negative electrospray mode and the QTRAP was set as follows: CUR= 20 psi, GS1=50 psi, GS2=30 psi, IS=-4500 V, CAD= HIGH, TEM=500 °C, DP= -60 V. The collision energies used for CAD (-18 to -38 eV) varied according to molecular species and were optimized for each compound.
2.6. IC50 determination
For the radioactive, fluorescent and LC/MS based assays, enzymes were used at a concentration that gave linear generation of product with both time and protein concentration. The concentrations of sEH are given below. IC50, the concentration of inhibitor that reduces enzyme activity by 50%, was determined by regression of at least five datum points with a minimum of two points in the linear region of the curve on either side of the IC50. Results are the average of triplicate determinations. For the homogenous recombinant human, murine and rat sEH, the IC50s were determined by a fluorescent assay previously described (Wolf et al., 2006) using cyano(6-methoxy-naphthalen-2-yl)methyl trans-[(3-phenyloxyran-2-yl)methyl] carbonate (CMNPC; Fig. S1) as a fluorescent substrate (Jones et al., 2005). The r2 value of standard curve was 0.96-0.99 of each compound. Recombinant human, mouse, and rat sEH enzymes were produced in a baculovirus expression system and purified by affinity chromatography (Wixtrom et al., 1988).
In order to determine IC50s in complex system such as dog liver cytosol and sEH depleted dog liver cytosol (prepared method in supplementary materials), IC50s reported herein were determined using racemic [3H]-trans-1,3-diphenylpropene oxide (t-DPPO) or 14, 15-EET (Borhan et al., 1995; Morisseau and Hammock, 2007) (Fig. S1). Livers from dogs were obtained from Dr. Medhora (Medical College of Wisconsin, USA). Cytosolic fractions were prepared by differential centrifugation as described (Morisseau et al., 1999a) and frozen at -80°C until used. Protein concentration was quantified using the Pierce BCA assay with bovine serum albumin (BSA) as the calibrating standard. Human liver cytosol was purchased from BD Biosciences (San Jose, CA). For the t-DPPO assay, the cytosolic fractions were diluted with a sodium phosphate buffer (100 mM, pH 7.4) containing 0.1 mg/ml BSA, and were incubated with inhibitors (1 < [I]final < 100,000 nM) for 5 min at 30 °C prior to radiolabeled substrate introduction ([S]t-DPPO: 50 μM; ~ 12,000 cpm/assay). The enzymes were incubated at 30 °C for 10 minutes and the reaction was quenched by addition of 60 μl of methanol and then 200 μl of isooctane followed by vigorous mixing. The isooctane extracts the remaining epoxide but not the diol from the aqueous phase. The activity was determined by measuring the quantity of radioactive corresponding diol remaining in the aqueous phase using a liquid scintillation counter (Wallac Model 1409, Gaithersburg, MD). For the LC/MS assay, 14, 15-EET was used as a substrate ([EET]final: 5 or 50 μM) and incubated in the appropriate human or canine liver cytosol at 30 °C for 10 minutes. The reaction was terminated by addition of 400 μl of methanol and 500 μl of 68 ng/ml of internal standard. The activity was determined by measuring the quantity of corresponding diol, 14, 15-DHET, by LC/MS. All assays were run in triplicate.
2.7. Water solubility determination
An excess of the test compounds was added to vials containing 1 ml of 0.1 M sodium phosphate buffer (pH 7.4), and a suspension of the mixture was equilibrated during 24 hours of shaking at 25°C. After centrifugation at 10,000 rpm for 10 min, the water supernatant (2.5 μl) was dissolved in 0.5 ml of methanol followed by adding 0.5 ml of internal standard solution (1-adamantanyl-3-decylurea ADU; 100 ng/ml in methanol). Then, the amount of each compound dissolved in buffer was determined by LC-MS/MS as described above.
2.8. Experimental LogP determination
The compounds (4 mg) were dissolved in pH 7.4 0.1 M sodium phosphate buffer-saturated 1-octanol (5 ml). 1-Octanol-saturated (5 ml) 0.1 M sodium phosphate buffer (pH 7.4) was then added to the solution above, and the mixture was equilibrated during 24 hours of shaking at 25°C (Kim et al., 2007b). The 1-octanol solution and buffer solution (2.5 μl) were dissolved in 0.5 ml of methanol separately, and 0.5 ml of internal standard solution (ADU; 100 ng/ml in methanol) was added to each of the methanol solutions. The samples were quantified by the LC-MS/MS as described above. The experimental log P value (LogP) was obtained with the following equation: LogP = log [octanol]/[water]. The cLogP values estimated by Crippen’s method were obtained by ChemDraw Ultra version 9.0.
2.9. Pharmacokinetic and statistical analyses
The pharmacokinetic parameters were obtained by non-compartmental or compartmental analysis from WinNonlin (Pharsight Corporation, Mountain View, CA). For the non-compartmental analysis, the time of maximum concentration (Tmax) and the maximum concentration (Cmax) were obtained from the observed value. Area under the curve (AUC) was calculated using the trapezoidal rule with the extrapolation method. For the compartmental analysis, the time of maximum concentration (Tmax) and the maximum concentration (Cmax) were obtained from the predicted value. The clearance (Cl) and volume of distribution at steady state (Vss) were calculated by the software. The lag time parameter was used depending on the coefficient obtained from the models. Statistical analysis was performed by the student’s t test and p < 0.05 was used to indicate statistical significance. All results were expressed as mean ± S.D. unless otherwise noted.
3. Results
3.1. The effects of structure of sEH inhibitors on potency and oral availability
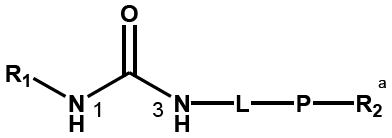
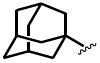
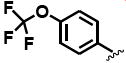
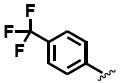
The general structure of sEH urea inhibitors screened in this study is given in Table 1. They are composed of non-polar groups (R1), usually a urea central pharmacophore, linker moieties (L), varied polar functional (P) groups, which are putative secondary pharmacophores, and R2 groups. The inhibitors are divided into four groups based on the nature of the linker moiety L attached to the 3 position on the urea as follows (Table 1): a flexible alkyl; a piperidyl; a cyclohexyl ether; and a phenyl group. Each group is divided in four-subgroups based on the nature of the moiety present on position 1 of the urea group (R1): an adamantyl; a 4-trifluoromethoxyphenyl; a 4-trifluoromethylphenyl; or a cycloheptyl group. Early lead compounds such as dicyclohexyl urea and, in this study triclocarban, (74) were dialkyl or diphenyl ureas. Although some of these materials were potent inhibitors of murine and human recombinant sEH, they were generally high melting, lipophilic, water insoluble and difficult to formulate. These studies, coupled with X-ray crystallography, demonstrated that a variety of groups can confer high activity at R1 on the left side of the urea. The adamantyl group initially was selected as R1 for most compounds because it is potent against the sEH enzymes of several species and easily detected by LC/MS. The LC/MS conditions are listed in the supplementary materials (Table S1), while the complete chemical structures, human sEH IC50s and canine AUCs are listed in the supplementary materials (Table S3). Unless otherwise noted IC50, values refer to those determined on the homogenous recombinant human enzyme determined with CMNPC as the fluorescent substrate (Fig. S1). As one estimate of potential efficacy, we use a ratio of exposure to potency or plasma AUC/IC50. The IC50 again refers to that determined with the CMNPC assay. The potencies against the human sEH of the selected seventy four inhibitors are summarized in Table 1. All of the compounds with the urea central pharmacophore are good sEHIs (IC50 < 100 nM). The fluorescent assay as performed here has a standard error between 10 and 20%, suggesting that only differences of two fold or greater in IC50 are significant.
Table 1.
IC50 values against recombinant human soluble epoxide hydrolase and non-compartmental pharmacokinetic parameters after oral administration of sEH inhibitors in dogs (n=1).
 | |||||||
|---|---|---|---|---|---|---|---|
| Text # | Structure | HsEH IC50b (nM) | AUCc (uM*min) | T1/2d (h) | Teffe (h) | C24/IC50f | |
| La | R1a | ||||||
| 1 |
|
|
3.2 | 3.1 | 2.9 | 3 | <0.1 |
| 2 | 0.8 | < LODg | - | - | - | ||
| 3 | 14.1 | 2.4 | 1.0 | 0.5 | <0.1 | ||
| 4 | 1.4 | 0.6 | 6.2 | 1 | <0.1 | ||
| 5 | 9.0 | < LOD | - | - | - | ||
| 6 | 2.5 | < LOD | - | - | - | ||
| 7 | 5.1 | < LOD | - | - | - | ||
|
|
|||||||
| 8 |
|
7.3 | 8.9 | 1.7 | 6 | <0.1 | |
| 9 | 2.4 | < LOD | - | - | - | ||
|
|
|||||||
| 10 |
|
5.9 | < LOD | - | - | - | |
| 11 | 2.1 | < LOD | - | - | - | ||
|
|
|||||||
| 12 |

|
3.9 | 1.7 | 1.2 | 6 | <0.1 | |
| 13 | 0.8 | < LOD | - | - | - | ||
|
| |||||||
| 14 |
|
|
14.5 | 36 | 1.4 | 5 | <0.1 |
| 15 | 3.2 | 5.6 | 1.6 | 6 | <0.1 | ||
| 16 | 1.7 | 2.6 | 1.7 | 6 | <0.1 | ||
| 17 | 1.4 | 4.9 | 2.0 | 8 | <0.1 | ||
| 18 | 0.9 | 5.4 | 3.6 | 8 | <0.1 | ||
| 19 | 2.6 | 2.6 | 1.8 | 4 | <0.1 | ||
| 20 | 2.7 | < LOD | - | - | - | ||
| 21 | 1.3 | < LOD | - | - | - | ||
| 22 | 1.2 | 4.8 | 0.8 | 5 | <0.1 | ||
| 23 | 1.1 | < LOD | - | - | - | ||
|
|
|||||||
| 24 |
|
11.5 | 390 | >24 | >24 | 6.0 | |
| 25 | 3.7 | 600 | 14 | >24 | 51 | ||
| 26 | 2.1 | 260 | 15 | >24 | 36 | ||
| 27 | 2.9 | 1700 | >24 | >24 | 130 | ||
| 28 | 10.2 | < LOD | - | - | - | ||
| 29 | 0.4 | < LOD | - | - | - | ||
| 30 | 0.8 | < LOD | - | - | - | ||
|
|
|||||||
| 31 |
|
27.6 | 220 | 5.2 | 24 | 1.0 | |
| 32 | 2.3 | 160 | 2.8 | 8 | 0.8 | ||
|
| |||||||
| 33 |
|
|
1.6 | 2.0 | 1.6 | 6 | <0.1 |
| 34 | 1.8 | 8.0 | 2.2 | 8 | <0.1 | ||
| 35 | 6.6 | < LOD | - | - | - | ||
| 36 | 0.4 | 1.2 | 3.2 | 8 | <0.1 | ||
| 37 | 0.4 | < LOD | - | - | - | ||
| 38 | 4.8 | 13.7 | 6.1 | 8 | <0.1 | ||
| 39 | 1.5 | 240 | 19 | >24 | 46 | ||
| 40 | 1.3 | 290 | >24 | >24 | 51 | ||
| 41 | 8.1 | 17.4 | 7.3 | 8 | <0.1 | ||
| 42 | 3.8 | 4.0 | 1.2 | 2 | <0.1 | ||
| 43 | 6.1 | < LOD | - | - | - | ||
|
|
|||||||
| 44 |
|
1.4 | 29.8 | 9.3 | >24 | 5.1 | |
| 45 | 0.6 | 240 | >24 | >24 | 86 | ||
| 46 | 2.8 | 0.7 | 1.5 | 1 | <0.1 | ||
|
|
|||||||
| 47 |
|
1.2 | 31.2 | 6.6 | >24 | 3.9 | |
| 48 |
|
0.4 | 19.2 | 3.5 | >24 | 12 | |
|
| |||||||
| 49 |
|
|
5.8 | < LOD | - | - | - |
| 50 | 0.8 | < LOD | - | - | - | ||
| 51 | 11.6 | < LOD | - | - | - | ||
| 52 | 1.8 | 10.2 | 5.4 | 8 | 0.5 | ||
| 53 | 3.3 | 6.7 | 5.3 | 8 | 0.2 | ||
| 54 | 11.3 | < LOD | - | - | - | ||
| 55 | 23.6 | < LOD | - | - | - | ||
| 56 | 4.7 | 5.9 | 2.3 | 5 | <0.1 | ||
| 57 | 3.1 | 5.1 | 3.2 | 5 | <0.1 | ||
| 58 | 1.5 | 1.4 | 5.3 | 3 | <0.1 | ||
| 59 | 0.9 | < LOD | - | - | - | ||
| 60 | 5.1 | < LOD | - | - | - | ||
| 61 | 0.8 | < LOD | - | - | - | ||
| 62 | 2.8 | 12.6 | 7.9 | 8 | 0.7 | ||
| 63 | 71.4 | < LOD | - | - | - | ||
| 64 | 0.9 | 11.3 | 5.1 | 8 | <0.1 | ||
| 65 | 5.2 | < LOD | - | - | - | ||
| 66 | 24.6 | < LOD | - | - | - | ||
| 67 | 28.7 | < LOD | - | - | - | ||
| 68 | 13.6 | < LOD | - | - | - | ||
|
|
|||||||
| 69 |
|
12.2 | 8.5 | 4.5 | 4 | <0.1 | |
| 70 | 94.6 | < LOD | - | - | - | ||
|
| |||||||
| 71 |
|
39.9 | <LOD | - | - | - | |
| 72 |
|
274 | 5.8 | 1.0 | 0 | <0.1 | |
| 73 |
|
28.3 | <LOD | - | - | - | |
| 74 |
|
13 | 1.8 | 0.5 | 2 | <0.1 | |
R1= non-polar substituent: 1-adamantyl, 4-trifluoromethoxyphenyl, 4-trifluoromethylphenyl, cycloheptyl. L= linker: n-alkyl, piperidyl, cyclohexyloxy, phenyl. P= varied polar functional group or putative secondary pharmacophore. R2= varied substituent.
IC50 determined by fluorescent assay with recombinant human enzyme.
area under the curve (Time0-infinite) obtained from non-compartmental analysis.
terminal half-life.
time of inhibitor concentration in vivo above IC50 determined with human recombinant sEH.
ratio of blood concentration over the IC50 determined with recombinant human sEH after 24 hour.
under the limit of detection (Table S1).
For the compounds that were detected in the blood above the limit of quantification (LOQ) following oral gavage (41 out of 74), their pharmacokinetic parameters were determined using a non-compartmental analysis (Table 1). This analysis was performed on plasma levels of the respective inhibitors as a function of time. The curves are shown in Figures 1-4 arranged to show compounds with similar structures. These data are also plotted in the supplementary material \ showing compounds with similar Cmax values for clarity (Fig. S2). The area under the curve (AUC) represents the amount of administered compound that reaches the blood as a function of time. AUC is an estimation of the availability of a given drug. As seen in Table 1, in general, compounds with an alkyl chain or a phenyl ring as the linker moiety at position 3 of the urea showed low AUCs, but compounds with a piperidyl or a cyclohexyl ether moiety lead to much larger AUCs. Further, compounds with a 4-trifluoromethoxyphenyl group or a cycloheptyl group as R1 have larger AUCs with longer elimination half lifes (T1/2) which could be due to relatively slower metabolism and/or excretion. This is particularly true for the compounds with a cyclohexyl ether or piperidyl L moiety at position 3 of the urea because of a possible metabolically labile adamantyl group (Table 1).
Fig. 1.
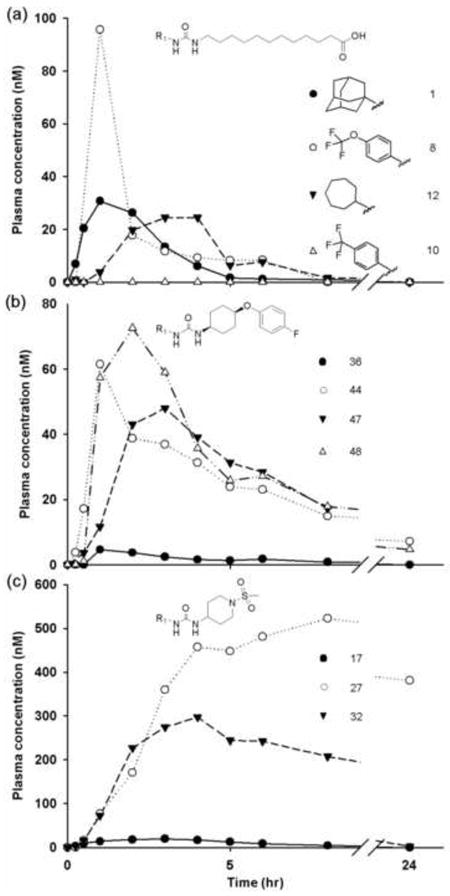
Plasma concentration-time profiles of sEH inhibitors with varied non-polar group (R1) after an oral dose of 0.3 mg/kg body weight. (a) Alkyl acid and derivatives (AUDA series) (● 1, ○ 8, and ▼ 12). (b) Cyclohexyl ether linker with cis-ether polar group and para-fluorophenyl R2 group (● 36, ○ 44, ▼ 48, and Δ 47). (c) Piperidyl linker with a sulfonamide group (● 17, ○ 27, and ▼ 32). Each curve represents data from one dog (n = 1).
Fig. 4.
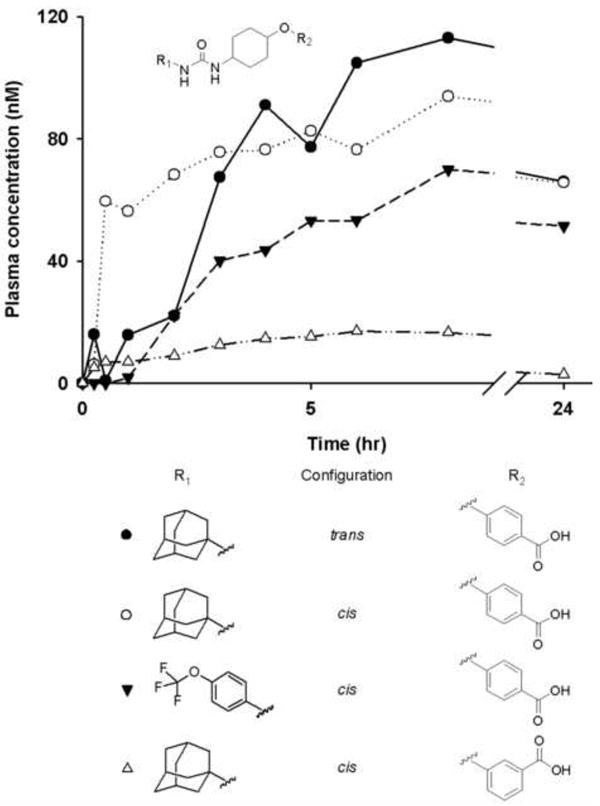
Plasma concentration-time profiles of sEH inhibitors with cyclohexyl ether linker after an oral dose of 0.3 mg/kgbody weight (n = 1). Cyclohexyl ether linker with cis- or trans- ether polar group, para- or meta-benzoic acid and varying R1 groups (● 39, ○ 40, ▼ 45, and Δ 41). Each curve represents data from one dog (n = 1).
Because compound 1 (also known as AUDA, 12-(3-adamantane-1-yl-ureido)-dodecanoic acid), 8, and compound 12 have long alkyl chains at the 3 position leading to β-oxidation in vivo, it is hard to observe small effects resulting from changing the R1 group (Fig. 1a). However, the trifluoromethoxyphenyl derivative 8 has a far higher Cmax and a three fold higher AUC at the expense of a drop in potency to the sEH. Both compound 8 and the cycloheptyl derivative 12 show a much longer β phase in a two compartment model. It is assumed that the metabolism of the compounds in Figure 1a is dominated by β-oxidation. The low blood level of the trifluoromethylphenyl derivative 10 is surprising given its good AUC in other series (Fig. 1a). Over all, altering the R1 group in this series did little to improve the AUC/IC50 ratio of these compounds. In contrast, replacing the R1 adamantyl group had a large effect on AUC of compounds with the cyclohexyl L moiety, an ether as the putative secondary pharmacophore P and a fluorophenyl R2 (Fig. 1b). The AUC/IC50 increased from 3 to 21, 26, and 48 for the trifluoromethylphenyl R1. Presumably when the metabolic susceptibility of the long alkyl chain is removed, the adamantane becomes the principal metabolic liability. The effects of altering R1 are even more dramatic with the piperidyl L moiety and a sulfonamide secondary pharmacophore P (Fig. 1c), although the trends are similar. The sulfonamides of the piperidines 17, 27, and 32 are all potent inhibitors of the human sEH and the trifluoromethoxyphenyl and cycloheptyl derivatives have low IC50 values, high blood levels and relatively long half-lives making these piperdyl sulfonamides attractive scaffolds for fine tuning pharmacokinetic properties. The AUC/IC50 values increase from 3.5 for the adamantane compound 17 to 440 for the trifluoromethoxyphenyl compound 27. The cycloheptyl compound with an exposure to potency ratio of 70 however may have more attractive properties for dosing. The calculated and experimental LogP values indicate reduced lipophilicity but the water solubility of 27 (TUPS) is quite low and the melting point very high (Table 2). These limitations may be overcome by potency. Although much larger R groups on the sulfonamide can result in highly potent inhibitors of the human enzyme (29, 30, Table 1, Table S3), their plasma levels were below limits of detection. By minor changes in R1 and small substituents on the sulfonamide, highly potent compounds for human use could be tailored.
Table 2.
Physiochemical properties of selected soluble epoxide hydrolases inhibitors
| # | Water solubilitya (μg/ml) | cLogPb | LogPc (pH 7.4) | m.p.d (°C) |
|---|---|---|---|---|
| 1 | 19 | 6.0 | 3.0 | 142-143 |
| 3 | 120 | 5.8 | 2.6 | 78-79 |
| 14 | 490 | 0.8 | 2.1 | 205-206 |
| 24 | 51 | 1.0 | 2.3 | 157-158 |
| 27 | 14 | 1.6 | 1.9 | 236-238 |
| 39 | 250 | 3.7 | 2.0 | 250-255 |
| 40 | 130 | 3.7 | 1.7 | 178-187 |
| 45 | 100 | 3.1 | 1.6 | 210-212 |
0.1 M sodium phosphate buffer (pH 7.4).
calculated LogP by ChemDraw 9.0.
experimentally determined log P = Log([C]octanol/[C]0.1 M sodium phosphate buffer at pH 7.4).
melting point.
Because the effective in vivo blood level of these inhibitors is unknown, the in vitro IC50s (Table 1) are used for the evaluation of an effective time (Teff), which is the total time that the blood concentration was above the determined IC50 for the human enzyme. Interestingly, even with small plasma concentrations, Teffs often are above 8 hours for many of the compounds. This is especially clear for the piperidyl or cyclohexyl ether L moiety, because the inhibitors are very potent in vitro. After 24 hours, the plasma concentrations above the IC50 value (C24/IC50) can be considered indicative of a dose needed for a once a day medication. For some inhibitors, especially the piperidyl or cyclohexyl ether L moiety with a 4-trifluoromethoxyphenyl moiety, the C24/IC50 values are still great due to slower metabolism and/or excretion rate especially compared to the compounds with an adamantyl moiety.
A previous study showed that polar groups P such as carbonyl or the ether and sulfonamide moieties in Figure 1 located 7-8 Å from the urea carbonyl increased polarity while retaining inhibitory potency (Kim et al., 2007b). Therefore, to improve water solubility and hopefully improve oral availability, some polar functional groups were added after the L moiety at position P, the putative secondary pharmacophore. In many cases, this polar secondary pharmacophore also increases the potency of the compounds. Compounds 3 (also known as AEPU, 1-adamantan-1-yl-3-{5-[2-(2- ethoxyethoxy)ethoxy]pentyl}urea), 4, 33, 52, and 53 have a polyethylene glycol chain after the L moiety (Fig. 2a). Compound 3 (AEPU) has higher water solubility and lower lipophilicity than its parent compound 1 (AUDA), and a low melting point simplifying formulation (Table 2). However, the AUCs of these polyethylene glycol compounds are much smaller than many other compounds with more lipophilic R2 groups possibly due to the oxidation on the adamantyl groups and polyethylene glycol chains (Ulu et al., 2008). AEPU showed an AUC/IC50 of only 0.17. However the analog approach illustrated in Fig 2a demonstrated that replacement of the alkyl chain with a cyclohexyl or better phenyl resulted in an increase of 8-34 fold in the exposure to potency ratio. Surprisingly an ω-trifluoromethyl group to block terminal hydroxylation failed to increase AUC. As a group the potency and bioavailabity of the polyether series could likely be dramatically improved by changes in R1 while retaining the desirable physical properties.
Fig. 2.
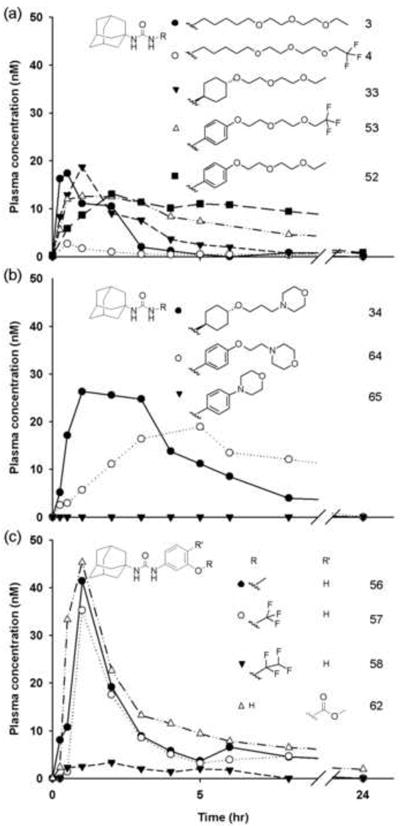
Plasma concentration-time profiles of sEH inhibitors with the adamantyl non-polar group and varied linker, polar group and R2 group after an oral dose of 0.3 mg/kgbody weight (n = 1). (a) Polyethylene glycol derivatives (● 3, ○ 4, ▼ 33, Δ 53 and ■ 52). (b) Heterocylic R2 group with varied linkers (● 34, ○ 64, and ▼ 65). (c) Phenyl linker with varied R2 groups (● 56, ○ 57, ▼ 58, and Δ 62). Each curve represents data from one dog (n = 1).
A number of compounds with morphilino and related groups as R2 in the adamantyl R1 series give low or non-detectable plasma levels of the parent compound (5, 65, 66, 67, & 68) (Tables 1, S3). However, compound 64 with a terminal morpholine is a very potent inhibitor with a moderate AUC (Fig 2b). A trisubstituted nitrogen in compound 65 results in reduced biological activity compared to an ether in 34, 64 and other compounds when used as the secondary pharmacophore P. Thus, fine tuning these heterocyclic R2 groups should be coordinated with optimizing R1 for better physiochemical properties and metabolic stability. A variety of R2 groups were examined using compounds with the adamantyl group at position 1 and a phenyl group at position 3 (Fig. 2c). Compound 58 with a tetrafluoroethyl R2 group has a smaller AUC compared to the methyl (56) or trifluoromethyl (57) R2 groups. Several salicylic acid derivatives were made. The ester 61 (Table S3) is a very potent sEHI which should yield both an active sEHI metabolite and acetylsalicylic acid on hydrolysis, but neither it nor its phenolic metabolite 55 nor the salicylic acid are detected in plasma. Compounds 62 and 69 (Table S3), containing ester groups, give surprisingly good plasma levels while the other salicylates are not detectable (63 & 70). Interestingly, the ester compounds (62 & 69) are not hydrolyzed quickly by esterases in vivo. Overall these salicylates and related compounds gave low AUC/IC50 values.
3.2. Structure optimization of selected inhibitors with piperidyl L moieties
Because a series of compounds with a piperidyl amides or cyclohexyl ethers as a linker had larger AUCs than compounds with alkyl or phenyl linker (Table 1), the compounds were further optimized based on these linkers. Compound 14 (also known as APAU, N-(1-acetylpiperidin-4-yl)-N’-(adamant-1-yl) urea) with an adamantyl R1 group and piperidyl linker has a larger AUC than other commonly utilized sEHIs (AUDA 1, AEPU 3) (Fig. 3a). The corresponding amide central pharmacophore (72) has a relatively small AUC compared to the urea due to rapid hydrolysis. In addition, this amide is a weak inhibitor of the human sEH. These properties are common to all the compounds tested here with an amide central pharmacophore (71, 72 & 73). Compound 14 has unexpectedly high water solubility and low lipophilicity (Table 2). Though there is the concern that amides can be rapidly hydrolyzed, this usually can be avoided by steric hindrance of the piperidyl linker to improve water solubility. By extending the acetamide chain of 14 by one (15) and two carbons (19), the potency on the human enzyme increases from 4 to 7 fold but the AUC decreases so dramatically that there is a net reduction in the AUC/IC50 ratio of 2.5 with 14 (Fig. 3b). The longer amide groups dramatically decrease water solubility and increase lipophilicity apparently leading to rapid metabolism of the compounds as reflected by reduced AUCs. When the adamantane at R1 of compound 14 is changed to a trifluoromethoxyphenyl group (24), the AUC increases dramatically. This change takes the ratio for 14 (APAU) of 2.5 to 33 for the corresponding acetamide 24, 162 for the propamide 25, and 123 for the butamide 26. Thus the apparent increase in sensitivity to metabolism of the compounds with an adamantane at R1 with an increase in the total lipophilicity of the molecule does not seem to apply to more stable groups. This increase in AUC can also be observed with compound 27 with methyl sulfonamide (Fig. 1c). This suggests that increasing the hydrophobicity of the acetamide (14, 15 & 19) may result in slower uptake or more rapid metabolism of the labile adamantyl moiety, but this situation is not observed with metabolically more stable cycloheptyl or trifluoromethoxyphenyl groups at R1 (34, 24-26). The simplicity, high inhibitory potency, conformational constraints, and promising pharmacokinetics of this series of compounds suggests it as well could yield pharmacologically attractive inhibitors following optimization at R1 and possibly the amide function.
Fig. 3.
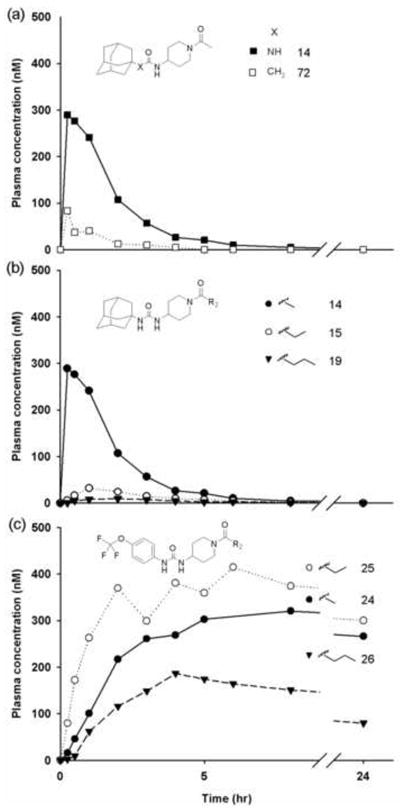
Plasma concentration-time profiles of sEH inhibitors with piperidyl linker after an oral dose of 0.3 mg/kgbody weight (n = 1). (a) Primary pharmacophore of urea (■ 14) or amide group (□ 72). (b) Urea with adamantyl R1 group, a piperidyl linker and amides with varying chain lengths (● 14, ○ 15, and ▼ 19). (c) Urea with 4-trifluoromethoxyphenyl R1 group, a piperidyl linker and amides with varying chain lengths (● 24(CH3), ○ 25(C2H5), and ▼ 26(C3H7)). Each curve represents data from one dog (n = 1).
3.3. Structure optimization of selected inhibitors with cyclohexyl ether L moieties
In hopes of improving water solubility, the fluorophenyl R2 groups (Fig. 1b) were substituted with a para-benzoic acid (Fig. 4), the cyclohexyl ether linker and an ether secondary pharmacophore, P. It is observed that both the trans-(39, also known as t-AUCB, trans-4-[4-(3-adamantan-1-yl-ureido)-cyclohexyloxy]-benzoic acid) and the cis-isomers (40) have large AUCs and high AUC/IC50 ratios of 160 and 233 respectively. Making the methyl ester of 39 to give 42 slightly reduces the AUC. This illustrates that like with AUDA, prodrugs and salts of the benzoic acid can be used to dramatically alter the physiochemical properties of the compounds and their bioavailability. The corresponding meta-benzoic acid (41) has a reduced potency and AUC to give a ratio of 2.1. It is interesting that replacing the adamantyl of 40 with a trifluoromethoxyphenyl group 45 yields similar plasma profiles and AUCs, unlike the APAU series (Fig. 3). However the increase in potency takes the exposure potency ratio to 400 for compound 45. It should be noted that the IC50 of 0.6 nM for this compound may be greater than numerically indicated since this IC50 value approaches the limit of the ability of the CMNPC assay to distinguish among potent inhibitors. The above observations bring up the possibility that potency can be dramatically increased by obvious analog approaches at R1. Also the AUC and T1/2 can be systematically altered by varying R1. The fact that the AUC of 45 is similar to that of 40 suggests that, in this series of compounds, the adamantyl moiety is not so large a metabolic liability as it is in the piperidine series.
3.4. Physiochemical properties of selected inhibitors
As outlined in Lipinski’s rule of five (Lipinski et al., 2001), physiochemical properties such as water solubility and LogP, are commonly associated with the bioavailability of a particular compound. Thus, the water solubility and experimental LogP values of several inhibitors were determined (Table 2). Over the range of compounds tested the correlations (r2 = 0.28) between cLogP and the experimentally determined LogP were poor as is commonly observed with ureas. Also, poor correlations (r2 < 0.20) were observed among LogP, water solubility, melting points, or the determined AUC (Table 1). These results suggest that for the series of compounds studied, these physiochemical properties are not valuable quantitative indicators of bioavailability. Extreme values for these parameters are certainly useful for rejecting leads based on Lipinski’s rules. Although these data do not appear to be valuable for fine optimization of ADME for this series of sEHIs, the improved water solubility and reduced LogP of the piperidines and cyclohexyl ethers discussed above makes them easier to formulate.
3.5. In vitro activity of selected inhibitors with sEH from different species
To test the ubiquity of action of the inhibitors, several compounds were selected based on their potency with the human enzyme and the cassette-dosing screening results (Table 1, S3). Their inhibitory activities were determined using CMNPC (the same fluorescent assay used for the recombinant human enzyme) against homogenous recombinant sEHs from two additional animal species (mouse and rat), commonly used for disease models (Table 3). In contrast, a radioactive sEH assay based on t-DPPO was used with cytosolic preparations from canine liver because esterases and glutathione-S-transferases present in cytosol result in a very high background with the fluorescent assay. Comparing the IC50s determined with the human recombinant sEH with CMNPC and dog liver cytosol with t-DPPO, compounds with a piperidyl linker (14, 24, 27, 31) are 30-1000 fold less active with the canine sEH while compounds with a cyclohexyl ether linker and three related compounds show only 1-3 fold lower potencies. This great reduction seen with the canine enzyme may derive from the differences in relative binding of these competitive transition state inhibitors to the canine sEH enzyme in competition with the two substrates or less likely from non-specific effects of cytosolic proteins. When comparing the IC50s determined with the fluorescent assay (CMNPC), most compounds evaluated with the recombinant human, murine and rat enzymes are potent (<50 nM) except for compound 24 with rodent enzymes. It is observed that there are only 2-10 fold differences among these three species with regard to the inhibitory potency of the 10 compounds assayed with the canine enzyme being an outlier only with regard to the piperidine containing compounds (14, 24, 27, 31). When comparing the IC50s determined with the human recombinant sEH between the fluorescent and the radiochemical assays (Table 3), one is of course looking largely at a competition between the inhibitors and the substrate for enzyme binding. However, the relative Kms of the two substrates (1 and 5μM, respectively) are of little assistance in this comparison since the Kms have little or no relationship to Kas in a two step enzymatic reaction. Thus among the nonpiperidine compounds there is only a 1-3 fold decrease in potency when moving from the fluorescent to the radiochemical assay using the human enzyme. In contrast, compounds with a piperidyl linker are far less potent on the human sEH in the t-DPPO assay (8-20 fold) than the fluorescent assay indicating that piperidyl compounds are more easily displaced from the enzyme by t-DPPO than by the fluorescent substrate CMNPC. Comparing the IC50s between human recombinant sEH and sEH in canine liver cytosol using the t-DPPO assay, the IC50s of the nonpiperidyl inhibitors are identical or very similar (1-3 fold). In contrast, the piperidyl compounds are much weaker inhibitors using the canine liver cytosol (2-100 fold) compared to recombinant human sEH. This difference is likely due to lower affinity of the piperidyl sEHIs to the canine enzyme, but it could be because of some factor in dog liver cytosol.
Table 3.
Inhibitory potency with sEH of different species
| Acronymd | Enzyme | CMNPC | t-DPPO | ||||
|---|---|---|---|---|---|---|---|
| Humana | Mousea | Rata | Humanb | Dogc | |||
| Structure | IC50 | ||||||
| 1 | AUDA |
|
3 | 10 | 11 | 10 | 3 |
| 3 | AEPU |
|
14 | 3 | 5 | 45 | 86 |
| 14 | APAU |
|
15 | 9 | 6 | 300 | 500 |
| 24 | TPAU |
|
12 | 97 | 79 | 160 | 9300 |
| 27 | TUPS |
|
3 | 5 | 9 | 26 | 3200 |
| 31 | CPAU |
|
28 | 12 | 7 | 300 | 930 |
| 39 | t-AUCB |
|
2 | 8 | 8 | 2 | 1 |
| 40 | c-AUCB |
|
1 | 4 | 7 | 1 | 1 |
| 45 | c-TUCB |
|
1 | 4 | 6 | 1 | 4 |
| 62 | AUSM |
|
3 | 10 | 8 | 6 | 31 |
measured with purified recombinant enzyme at protein concentration of 0.012 μg/ml.
measured with purified recombinant enzyme at protein concentration of 0.12 μg/ml.
measured with liver cytosolic preparation at protein concentration of 0.2 mg/ml.
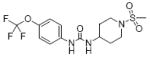
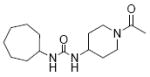
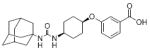
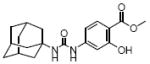
acronym commonly used in the literature. AUDA, 12-(3-adamantane-1-yl-ureido)- dodecanoic acid; AEPU, 1-adamantan-1-yl-3-{5-[2-(2- ethoxyethoxy)ethoxy]pentyl}urea; APAU, N-(1-acetylpiperidin-4-yl)-N’-(adamant-1-yl) urea; TPAU, 1-trifluoromethoxyphenyl-3-(1-acetylpiperidin-4-yl) urea; TUPS, 1-(1-methylsulfonyl-piperidin-4-yl)-3-(4-trifluoromethoxy-phenyl)-urea; CPAU, 1-cycloheptyl-3-(1-acetylpiperidin-4-yl) urea; t-AUCB, trans-4-[4-(3-adamantan-1-yl-ureido)-cyclohexyloxy]-benzoic acid; c-AUCB, cis-4-[4-(3-adamantan-1-yl-ureido)-cyclohexyloxy]-benzoic acid; c-TUCB, cis-4-[4-(3-trifluoromethoxyphenyl-l-ureido)-cyclohexyloxy]-benzoic acid ; AUSM, 4-(3-adamantane-1-yl-ureido)-2-hydroxyl-benzoic acid methyl ester.
Non specific binding is unlikely since the canine cytosol is diluted at least 100 fold before the assay. However, to further test the hypothesis that the large difference between the potency of these compounds to the human compared to the canine enzyme is due to a cysosolic factor, the IC50s of one piperidyl compound (27) and one non-piperidyl compound (39) were determined with both canine liver cytosol (which has a relatively low specific activity among the mammals examined) and sEH depleted canine liver cytosol (preparation method was provided in supplementary materials, Table S4 & Fig. S3) both supplemented with purified human recombinant sEH. The IC50s on the human sEH incubated in canine cytosol and depleted cytosols of compound 27 (130 & 120 nM) and 39 (3 & 2 nM) are similar to those determined for this enzyme in buffer (27: 150 nM; 39: 2 nM) (Table S5). In a second experiment using 14, 15-EET as substrate at two different substrate concentrations bracketing the Km (5μM and 50μM) similar results were obtained at both substrate concentrations. Similar results were obtained between the use of EET and t-DPPO as substrate, and pure recombinant human sEH compared to human hepatic cytosol (Table S6). In addition, using the 50μM EET substrate the following IC50s were obtained when comparing results in human and dog liver cytosols (human sEH: 27: 26 nM; 39: 3nM; dog sEH: 27: 1200 nM; 39: 7 nM). These similar results suggest that piperidine containing sEHIs are less effective on the canine enzyme and that the presence of traces of cytosolic proteins have little or nothing to do with the determined IC50s. These data also support previous observations that for nonpiperidine compounds IC50s are similar whether CMNPC, t-DPPO or 14, 15 EET are used as substrate (Morisseau and Hammock, 2007). These data further caution that the fluorescent assay based on CMNPC tends to over estimate the potency of the piperidyl sEHIs on the human enzyme. In addition the data support that the canine sEH is significantly less sensitive to the piperidyl inhibitors compared to the other compounds in this study.
3.6. Compartmental pharmacokinetics and bioavailability of 3(AEPU), 14 (APAU), and 39 (t-AUCB)
Based on the exposure to potency ratio, and physicochemical properties (Table 2), we selected compound 14 (APAU), 39 (t-AUCB), and 3 (AEPU), to determine their experimental bioavailability (Fig. 5). To avoid any interaction with the vehicle, the compounds were prepared in 0.9% NaCl for both oral and intravenous studies. Pharmacokinetic parameters obtained from compartmental analysis are listed in Table 4 for i.v. injection and Table 5 for oral gavage. To determine the optimal number of compartments (n) for each compound, we sequentially modeled the pharmacokinetic (PK) results with the WinNonlin software while increasing n. We chose the smallest values of n (Table 4) that yielded the statistically highest correlation values. For compound 3, after i.v. administration, though there is graphically a second phase of elimination (Fig. 5a), model results suggested that PK is better predicted with a one compartment model (r2=0.98). This suggested that the second phase is likely due to an enterohepatic circulation in vivo (Granero and Amidon, 2008). While the behavior of 14 (Fig. 5b) was clearly predicted with a one compartment model (r2=0.98), 39 followed a two compartment model (r2=0.99) (Fig. 5c). Using these respective models, we found that the half-life of 3 is 0.16 hour, while that of 14 is 0.6 hour indicating fast elimination from high metabolism and excretion. The T1/2 of the alpha phase of 39 is 0.08 hour on average indicating fast distribution, while the T1/2 of the beta phase is 7.8 hours on average indicating slow elimination. Because of the short half life, the clearance of 3 is fast at 5.8 l/h/kg as expected. The clearance of 14 is 3 fold slower than 3. On the other hand, the clearance of 39 is relatively slow at 0.14 l/h/kg due to the long elimination half-life. Based on the volume of distribution, 3, 14 and 39 appeared to be extensively distributed in the body. This may be due to their relatively high lipophilicity (experimental LogP values between 2.0 and 3.0).
Fig. 5.
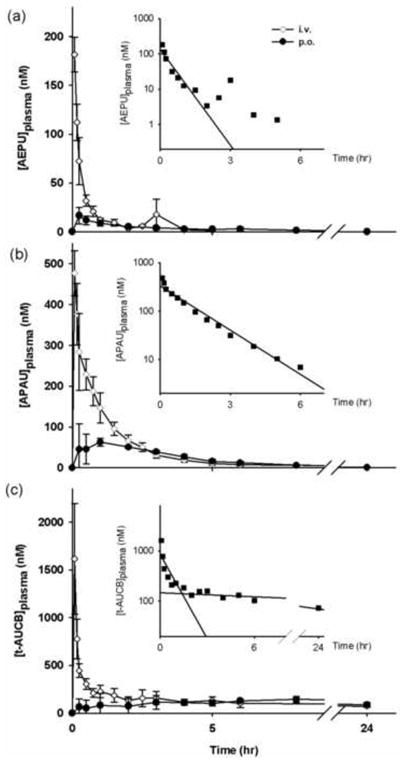
Plasma concentration-time profile of 3 AEPU (a), 14 APAU (b), and 39 t-AUCB (c) after an i.v. or p.o. dose of 0.3 mg/kgbody weight (n = 3) except AEPU after an i.v. dose of 0.1 mg/kg body weight. Data are shown as mean ± S.D. (n = 3). Insert figure: Log scale of plasma concentration-time profile following i.v. administration.
Table 4.
Compartmental pharmacokinetic parameters of sEHIs after i.v. administration in dogs (n = 3)
| # | Acronym | Dose (mg kg -1) | Compartment | Correlation | T1/2a (h) | Cld (L/h/kg) | Vsse (L/kg) | AUCf (μM*min) |
|---|---|---|---|---|---|---|---|---|
| 3 | AEPUg | 0.1 | 1 | 0.98 ± 0.01 | 0.16 ± 0.03 | 5.8 ± 1.0 | 1.3 ± 0.2 | 3.6 ± 0.6 |
| 14 | APAUg | 0.3 | 1 | 0.98 ± 0.02 | 0.6 ± 0.1 | 2.4 ± 0.5 | 2.1 ± 0.5 | 24 ± 5 |
| 39 | t-AUCBg | 0.3 | 2 | 0.99 ± 0.01 | α: 0.08 ± 0.05b | 0.4 ± 0.2 | 2.9 ± 1.8 | 160 ± 80 |
| β: 8 ± 8c |
terminal half life.
distribution half life.
elimination half life.
clearance.
volume of distribution at steady state.
area under the concentration (Time0-24 h).
AEPU: bridging compound to previous literature; APAU: representative piperidine sEHI; t-AUCB: representative cyclohexyl ether sEHI. Note T1/2 of AEPU can be tripled with a slow release formulation in hydroxypropylmethyl cellulose (data not shown).
Table 5.
Compartmental pharmacokinetic parameters of sEHIs after oral gavage at a 0.3 mg/kgdose in dogs (n = 3)
| # | Acronym | Compartment | Correlation | Tmaxa (h) | Cmaxb (μM) | T1/2c (h) | AUCd (μM*min) | Bioavailabilitye (%) |
|---|---|---|---|---|---|---|---|---|
| 3 | AEPU | 1 | 0.99 ± 0.01 | 0.2 ± 0.1 | 0.02 ± 0.01 | 1.7 ± 1.0 | 1.8 ± 0.6 | 21 ± 4 |
| 14 | APAU | 1 | 0.98 ± 0.01 | 1.0 ± 0.7 | 0.08 ± 0.03 | 1.7 ± 0.4 | 14 ± 1 | 64 ± 14 |
| 39 | t-AUCB | 1 | 0.96 ± 0.04 | 7.3 ± 5.4 | 0.15 ± 0.03 | 12 ± 10 | 270 ± 100 | 100 ± 30f |
time of maximum concentration.
maximum concentration.
terminal half life.
area under the concentration (Time0-24 h).
bioavailability=([AUC]p.o./Dose)/([AUC]i.v./Dose).
the bioavailability of t-AUCB was calculated using [AUC]0-24 due to the long beta phase half life.
For oral administration (Table 5), the absorption rate can be assessed roughly by Cmax and Tmax. Both 3 (AEPU) and 14 (APAU) are absorbed rapidly, but a larger amount of 14 (APAU) is absorbed. Compared to those two inhibitors, a larger amount of 39 is absorbed but much more slowly. Although a two phase elimination of 39 was observed with i.v. administration; after p.o. administration, the distribution phase apparently disappeared; possibly due to the slow absorption. Because of the slower absorption, the apparent in vivo half lives are longer after oral administration compared to i.v. administration. The amount of 3 reaching the blood as estimated with AUC is far smaller following oral gavage than with i.v. administration, suggesting a low bioavailability (~ 21%) or possibly very rapid metabolism in dogs. The better absorption of 14 after oral gavage leads to a higher bioavailability (~64%). Because of insufficient time points during the elimination phase of 39 the estimated infinite oral AUC is much larger than the intravenous AUC which makes it impossible to calculate the bioavailability. The bioavailability of 39 was thus calculated by the AUC exposure from 0 to 24 hours yielding an apparent bioavailability of ~100%.
3.7. Dose-response and formulation pharmacokinetics of 39 (t-AUCB) in dogs
Because of its excellent bioavailability in dogs, we determined a dose-response PK profile for 39 (t-AUCB) (Fig. 6) and complete pharmacokinetic parameters were listed in Table S7. As expected, the amount of compound reaching the plasma and maximum plasma concentration increased quasi linear fashion over the dose given (r2 = 0.98, Fig. 6 insert). This relationship will facilitate the prediction of appropriate doses for future studies when blood concentrations sufficient for biological activities are known. We previously showed that the plasma ratio of epoxides to corresponding diols derived from linoleic acids and arachidonic acids is an indicator of sEHI efficacy in vivo in lipopolysaccharide induced inflammation in mice (Schmelzer et al., 2005). Here, the plasma samples 30 minutes after dosing were used for oxylipin analysis because this time is when the drug level reaches the highest concentration in plasma for the highest dose. There is a small dose related increase in the epoxides of each of the 4 regioisomers of the arachidonate epoxides (Table S8). Unexpectedly there are also increases in diols at some of the doses. This results in a very weak positive correlation between the epoxide to diol ratio and dose (Fig. S4 and Table S8) suggesting that these sEHIs are not likely to have any effect on healthy individuals. In other animal models, the ratio of EETs to corresponding diols was lower with inflammation and increased with the sEHI treatment (Schmelzer et al., 2005; Luria et al., 2007; Liu et al., 2009b). Consistently the change in epoxides and diols as well as their ratios are more dramatic in inflamed than normal animals.
Fig. 6.
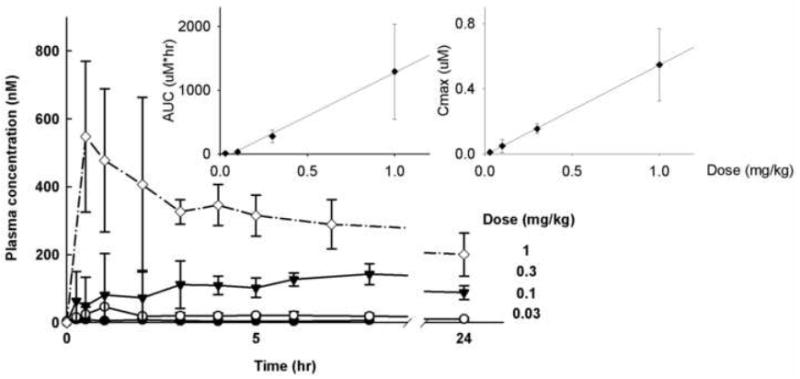
Plasma concentration-time profile of 39 t-AUCB after an oral dose of 0.03, 0.1, 0.3, and 1 mg/kgbody weight. The AUC vs. dose relationship for t-AUCB approaches linearity (r2 = 0.98). Data are shown as mean ± S.D among different dogs. (n=3).
Finally, we compared the influences of four different formulation methods on the oral availability based on the AUCs of 39 (t-AUCB) (Table S9). The best PK parameters were obtained when 39 was administered as a solution in 0.9% NaCl 99:1 water-morpholine. The AUC was very similar to that obtained when 39 was given in a triglyceride solution. Giving 39 dry powder in capsules resulted in a 3 fold lower Cmax. Based on its AUC, we observed that about 5 fold less of 39 reached the blood stream when administered as a powder itself or mixing it with lactose and HPMC than when administered in a triglyceride-rich or saline buffer solution. This was expected from a high melting lipophilic solid.
4. Discussion
In this paper, sEHIs were screened for their pharmacokinetic profiles in dogs and these data used to select sEHIs for further study. Using a cassette of three compounds administered in a single dose to a dog allowed relatively fast screening, but this approach may result in some errors so caution must be exercised with fine interpretation of the data. First, drug-drug interactions may affect the prediction of pharmacokinetic profiles for each individual compound. To minimize such interactions (Manitpisitkul and White, 2004), we used a low individual dose (0.3 mg/kg) and mixed only three drugs together to yield an overall dose < 1 mg/kg. When comparing the cassette dosing data and the individual dosing (Table S10), the AUCs from cassette dosing were similar to individual dosing and they were within the margin of error. In addition, the same rank order was observed suggesting that the cassette method was efficient for selecting compounds for more detailed studies (White and Manitpisitkul, 2001). Second, there are variations resulting from the sample preparation and the analytical method. Even though the polarities of compounds are significantly different, ethyl acetate is an efficient solvent to extract all 74 compounds studies with 10-20% variation from the plasma with repeated extractions. Furthermore, the variations in plasma compound level of multiple samples taken at the same time and from the same dog are 10-30% and those of the work up and injection of the same sample to the LC/MS are 5-10%. Thus, there is 10-30% variation in the data reported. Third and last, we observed 30-50% variation from inter-individual differences (Table 4 & 5). These data suggest that only differences of 3 fold or more are significant. Differences over 1000 fold among some compounds were observed in the study (Table 1).
Dogs are the non-rodent species most often suggested for preclinical pharmacokinetic studies because of their large size, well-known physiology, ease of handling and simplicity of biological sampling. However, there are several physiological differences from humans such as gastrointestinal function, hepatic metabolism and plasma protein binding (Tibbitts, 2003). These issues need to be considered when making extrapolations from canine pharmacokinetics to human. For example, inhibitors with a urea, amide, or carbamate as a central pharmacophore are highly potent against sEH (Morisseau et al., 1999b). However, dogs have lower general carboxylesterase and amidase activities than humans (Taketani et al., 2007). Thus, one can expect a faster hydrolysis of amides in the central pharmacophore such as 72, among the piperidines with an amide as the secondary pharmacophore such as APAU and some carbamates in humans. Although highly potent inhibitors with amides as the central pharmacophore have been reported by this and other laboratories, we focused on urea-based sEHIs in this study because the ureas are more resistant to hydrolysis, thus reducing the importance this difference between canine and human metabolism.
Previous studies have illustrated structure activity relationships for substituents on both sides of the urea in terms of potency (Hwang et al., 2006; Jones et al., 2006; Li et al., 2006; Morisseau et al., 2006; Hwang et al., 2007; Kim et al., 2007a; Kim et al., 2007b; Kasagami et al., 2009). Particularly, when optimizing availability and efficacy, optimal molecules cannot just be obtained by joining substituents optimized separately for each side. For example, compounds with an adamantyl group in the R1 position are among the most potent inhibitors and are monitored by their mass spectrum and positive ionization with great sensitivity. However, such compounds commonly have lower blood concentrations when compared to other R1 groups such as 4-trifluoromethoxyphenyl, 4-trifluoromethylphenyl, or cycloheptyl (Fig. 1). Similarly, the inhibitors with piperidyl and cyclohexyl ether linkers (L) are also potent compounds that have better pharmacokinetic profiles than the inhibitors with linear alkyl or aryl linkers (Table 1). This study has shown small differences in order of potency of R1 groups on compounds with altered L, P, and R2 groups (Table 1, S3). Furthermore, the presence of polar groups (or putative pharmacophores; P) such as esters, ether, amides, and sulfonamides, yields good AUCs. The presence of those polar groups increases water solubility (Table 2) and simplifies formulation for administration. A polar group in the correct orientation to form a hydrogen bond may not increase potency; however, a polar group which is unable to form a hydrogen bond in the enzyme will dramatically reduce inhibitor potency. For example, compounds containing an N-substituted piperidyl group, such as 14, 25 and 27, show good water solubility, good exposure following oral dosing and good potency with the human sEH enzyme. Compounds containing a cyclohexyl ether linker and ether group (39, 40, 44 and 45) have the same advantages, but they also display high potency toward sEH of numerous species commonly used as animal models.
To improve the physiochemical properties and improve bioavailability, R2 groups were added after the polar functional group P. For example, compounds with a polyethylene glycol chain such as compound 3 and 52 have good water solubility leading to better absorption (Fig. 2a) and lower melting points simplifying formulation. However, a polyethylene glycol chain can be metabolized rapidly by cytochrome P450 enzymes in vivo resulting in a short half life and a small AUC. It was found that, in addition to the rapid cleavage of the polyethylene glycol chain, compound 3 (AEPU) is also oxidized on the adamantyl group in microsomal incubations (Ulu et al., 2008). To improve water solubility and bioavailability, we tested the effect of a morpholino group at the R2 position (Fig. 2b). The oral exposures were low or not detectable in many cases, suggesting that the presence of a morpholino group was detrimental due to higher metabolism or lower absorption. However, compound 64 gave an AUC/IC50 of 12 resulting in a substantial improvement over compound 1 AUDA. In a general manner, a larger or more non-polar R2 group is better to yield more potent compounds (Table 1 and Table S3). However, in terms of bioavailability, the effect of the size and nature of R2 seems dependent on the linker L used. For compounds with a piperidyl as L, a small R2 such as in 24 to 27 yield higher AUCs. For compounds with a cyclohexyl ether linker, a larger R2 group, such as a para-benzoic acid (39, 40 and 45) gives better availability. This is likely due to a water solubility of up to 12 fold higher than the solubility of compound 1 independent of the nature of R1 (Table 2). Finally, solubility and availability of 39 (t-AUCB) could be further improved by modifying the terminal benzoic acid function, as it was done for 1 (AUDA) (Kim et al., 2007a). For example, to ease the formulation 39 (t-AUCB) in oil, a normal butyl ester can be added as with compound 2. On the other hand, polar ester or salts can be used for water soluble powders. Furthermore, a larger R2 group can be used for fluorescent and biotin labels, solid phase purification and other uses while retaining high affinity of the enzyme in vitro.
The CMNPC based assay is a robust high throughput screen for sEHIs, and it has been use to screen the 300,000 compound NIH drug like library. A caution from this study is that the CMNPC assay overestimated the potency of a group of piperidine containing sEHIs relative to a radiochemical or LC/MS based assay. For example, the IC50 of APAU (14) is over estimated 20 fold. However, the results of the CMNPC based assay are readily confirmed using a surrogate radiolabeled substrate like t-DPPO or an endogenous substrate such as 14, 15-EET. It has been demonstrated that the piperidine containing sEHIs have excellent physical properties and high potency (Jones et al., 2006). This study demonstrates very high inhibitory potency for additional piperidine compounds and demonstrates that some of them have excellent pharmacokinetic properties such as 24-27. However, a second caution is that the piperidines tested have much lower potency on the canine sEH than the human, murine or rat sEH regardless of the substrate used for assay.
Comparing the amino acid sequences of sEH in dogs and human, there is 88% similarity. Even with this high similarity, the purification of canine sEH by the affinity column optimized for human and rodent sEH failed indicating differences of sEH among species. In addition, only compounds with the piperidyl linker are dramatically less active with canine enzymes suggesting possible different interactions between enzyme and inhibitors among species (Gomez et al., 2006). AUC/IC50 values are commonly used to estimate exposure as a function of potency with the caution regarding limitations in extrapolating from one species to another and that plasma levels are sometimes not an indication of efficacy. These ratios for several sEHI are shown in graphical form (Fig. 7). The values are expressed on a log scale due to a large variation among compounds and normalized to 1 (AUDA) which has been widely used in published biological studies of the effects of sEH inhibition. Another bridging compound (2, AEPU) is also included. Even though high exposures are obtained for compounds containing a piperidyl as the L group (14, 24 & 27), these exposures are less efficient in dogs as exhibited by their low in vitro inhibitory activity with the canine sEH. A second caution with the piperidine containing compounds mentioned above is that the CMNPC based fluorescent assay reported here may overestimate the potency by over 20 fold. For compounds containing a cyclohexyl ether as the L group (39 and 45), exposures almost two orders of magnitude greater than 1 (AUDA) were obtained. Thus, while compounds with the piperidyl linker are less attractive as therapeutics for companion animals and may be restricted to human health usage, compounds with the cyclohexyl ether linker (39 & 45) have potential as therapeutics for humans and veterinary usage for dogs.
Fig. 7.
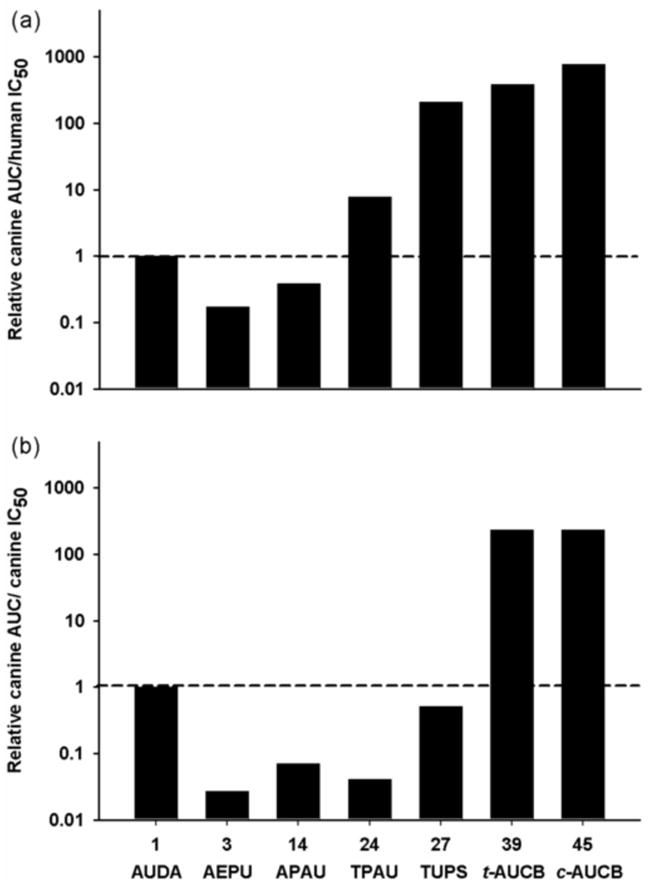
Comparison of exposure (plasma AUC) as a function of potency (IC50) for a series of sEH inhibitors. (a) The log AUC/IC50 ratio for humans using the canine AUC at 0.3 mg/kg body weight and the human IC50 calculated based on the radioactive t-DPPO sEH assay. The y-axis represents the ratio of AUC/IC50 normalized to AUDA (1) in log scale. (b) The log AUC/IC50 ratio for dogs using the canine AUC at 0.3 mg/kg body weight and the canine IC50 calculated based on the radioactive t-DPPO sEH assay.
Because these novel sEHIs are very potent in vitro, a relatively low dose could be used in vivo. Thus, the elimination rate will certainly play an important role to assess the efficacy of inhibitors. Compounds with both good exposure and high potency require very small doses, further simplifying formulation. To evaluate elimination rates, we also determined pharmacokinetic parameters obtained from i.v. injection for a few inhibitors. Interestingly, the compound 39 (t-AUCB) with a cyclohexyl ether (L) linker moiety has a much longer elimination half-life (~ 8 h) than the compound with an alkyl 3 (AEPU) or piperidyl 14 (APAU) (L) linker moiety. Based on these results, it is likely that one could treat patients with 39 or similar compounds with a low daily dose. The hepatic blood flow of dogs was estimated to be 1.8 l/kg/min (Smythe et al., 1953). Both 3 and 14 have higher or similar clearance values, suggesting that liver metabolism of these inhibitors is important for their elimination from the blood. On the other hand, the clearance of 39 is only 8% of hepatic blood flow, indicating that 39 is slowly cleared via hepatic metabolism. The volume of distribution of all three inhibitors is over 0.6 l/kg indicating an extensive tissue distribution. This can be related to the high LogP values which often predict the partition between tissue and plasma as well as membrane penetration. Previous studies also support this observation. 1 (AUDA) has been shown to penetrate the blood-brain barrier to reduce damage from stroke in the rats due partly to its high lipophilicity (Zhang et al., 2007b). 3 (AEPU) has been shown to have biological effects in vivo below its detection limit in plasma (Xu et al., 2006; Ulu et al., 2008). This is explained in part by an active metabolite but also may result from the rapid distribution to the target site. One can expect that many of the new inhibitors described herein are also extensively distributed because of similar LogP values. The oral profile yielded similar trends to the i.v. profiles for these compounds. For example, compound 39 (t-AUCB) maintains high plasma concentrations longer than 3 and 14. Interestingly, the absorption rate of 39 is much slower than 3 and 14 based on the Tmax derived from the oral gavage study. The lower clearance and higher volume of distribution of 39 contribute to the prolonged elimination half-life. Thus, caution should be exercised with multiple administrations of 39, because plasma drug concentrations are expected to accumulate. However, in mice, 39 (t-AUCB) quickly reached steady state level (Liu et al., 2009a). At the range from 0.03 mg/kg to 1 mg/kg, the AUC shows dose-proportionally (Fig. 6) which indicates the metabolism is unsaturated in this range. This relationship will simplify formulation and usage when the efficacy dose is known. As observed for many less water soluble and higher melting point ureas, 39 (t-AUCB), as a free acid, is more orally available when given in a solution than as a solid. This observation is explained in part by data in Table 2. Ureas generally are high melting indicating a stable crystal structure. If a high melting point is coupled with low water solubility, oral availability is very low unless the compound is given in true solution. Exceptions to this observation regarding these urea drugs are illustrated by 3 with a moderate water solubility but a low melting point and 14 with a high melting point but very high water solubility. These two compounds have high oral availability whether in true solution or administered as powders. In contrast 39 (t-AUCB) is more like the other ureas in this series. It gave good bioavailability when given in the standard triglyceride solution and the Cmax doubled and AUC increased slightly when given orally in saline solution. However, when given as a dry powder or when formulated with HMPC and lactose, the AUC was reduced 5 fold (Table S9). Finally, even at the highest dose tested (1 mg/kg), there are no clinical symptoms showing toxicity. Although the toxicity level is unknown, during this study of over two years with animals receiving dosing of different sEHIs once a week, no adverse reactions to drug administration were noted by veterinarians during physical examination of this group of dogs.
5. Conclusion
The pharmacokinetic profiles of sEHIs were successfully evaluated and ranked by cassette dosing in dogs with LC-MS/MS. For three compounds cassette dosing was found to be predictive of the pharmacokinetic profiles obtained when the compounds were doses individually. Based on the results, the inhibitors with cycloheptyl or 4-trifluoromethoxyphenyl groups on the 1 position of the urea and with a piperidyl or cyclohexyl ether linker have shown the best PK profiles. APAU and t-AUCB were found to have bioavailabilities 3 and 5 fold higher than AEPU, an earlier sEHI, and t-AUCB was a more potent inhibitor than either APAU or AEPU. A caution is that the CMNPC based fluorescent assay over estimates the relative potency of piperidine based compounds such as APAU compared to other inhibitor structures when t-DPPO or 14,15-EET are used as substrates. This over estimation can be quite high and is 20 fold when APAU is assayed with the recombinant human enzyme. In addition, the compounds with a piperidyl linker are not highly potent on canine sEHs which is a caution when piperidines are used with disease models other than rodents. Several synthetically attractive structural classes show both good inhibitory potency on the recombinant human enzyme and a reasonable canine PK-ADME. For example the AUCs of t-AUCB were linearly related to oral dose from 0.03 to 1 mg/kg. Because of its high potency and reasonable physiochemical and pharmacokinetic properties, t-AUCB is an excellent tool to evaluate the biology of sEH in various animal models. It may also be a valuable lead for the development of both human and veterinary therapeutics.
Supplementary Material
Acknowledgments
We thank Dr. Robert Gunther, Linda Talken and staff of the UC Davis animal resource center for helping with treating the dogs and their husbandry. We also thank Pharsight for providing the pharmacokinetic software WinNonlin 5.0. Hsing-Ju Tsai was supported in part by the UC Davis-Howard Hughes Medical Institute (UC Davis-HHMI) training program. Jun Yang was supported by the Elizabeth Nash Memorial fellowship from the Cystic Fibrosis Foundation Inc. Bruce D. Hammock is a George and Judy Marcus Senior Fellow of the American Asthma Foundation. This work was supported in part by NIEHS Grant (R01 ES02710), NIEHS Superfund Grant (P42 ES04699), NIH/NHLBI grant (R01 HL59699-06A1), American Asthma Foundation grant (09-0269) and a Translational Technology Grant from the UC Davis Medical Center.
Footnotes
Publisher's Disclaimer: This is a PDF file of an unedited manuscript that has been accepted for publication. As a service to our customers we are providing this early version of the manuscript. The manuscript will undergo copyediting, typesetting, and review of the resulting proof before it is published in its final citable form. Please note that during the production process errors may be discovered which could affect the content, and all legal disclaimers that apply to the journal pertain.
References
- Ai D, Fu Y, Guo D, Tanaka H, Wang N, Tang C, Hammock BD, Shyy JY, Zhu Y. Angiotensin II up-regulates soluble epoxide hydrolase in vascular endothelium in vitro and in vivo. Proc Natl Acad Sci U S A. 2007;104:9018–9023. doi: 10.1073/pnas.0703229104. [DOI] [PMC free article] [PubMed] [Google Scholar]
- Borhan B, Mebrahtu T, Nazarian S, Kurth MJ, Hammock BD. Improved radiolabeled substrates for soluble epoxide hydrolase. Anal Biochem. 1995;231:188–200. doi: 10.1006/abio.1995.1520. [DOI] [PubMed] [Google Scholar]
- Chiamvimonvat N, Ho CM, Tsai HJ, Hammock BD. The soluble epoxide hydrolase as a pharmaceutical target for hypertension. J Cardiovasc Pharmacol. 2007;50:225–237. doi: 10.1097/FJC.0b013e3181506445. [DOI] [PubMed] [Google Scholar]
- Dingemanse J, Appel-Dingemanse S. Integrated pharmacokinetics and pharmacodynamics in drug development. Clin Pharmacokinet. 2007;46:713–737. doi: 10.2165/00003088-200746090-00001. [DOI] [PubMed] [Google Scholar]
- Dorrance AM, Rupp N, Pollock DM, Newman JW, Hammock BD, Imig JD. An epoxide hydrolase inhibitor, 12-(3-adamantan-1-yl-ureido)dodecanoic acid (AUDA), reduces ischemic cerebral infarct size in stroke-prone spontaneously hypertensive rats. J Cardiovasc Pharmacol. 2005;46:842–848. doi: 10.1097/01.fjc.0000189600.74157.6d. [DOI] [PMC free article] [PubMed] [Google Scholar]
- Fleming I. Epoxyeicosatrienoic acids, cell signaling and angiogenesis. Prostaglandins Other Lipid Mediat. 2007;82:60–67. doi: 10.1016/j.prostaglandins.2006.05.003. [DOI] [PubMed] [Google Scholar]
- Frick OL, Teuber SS, Buchanan BB, Morigasaki S, Umetsu DT. Allergen immunotherapy with heat-killed Listeria monocytogenes alleviates peanut and food-induced anaphylaxis in dogs. Allergy. 2005;60:243–250. doi: 10.1111/j.1398-9995.2004.00711.x. [DOI] [PubMed] [Google Scholar]
- Gauthier KM, Yang W, Gross GJ, Campbell WB. Roles of epoxyeicosatrienoic acids in vascular regulation and cardiac preconditioning. J Cardiovasc Pharmacol. 2007;50:601–608. doi: 10.1097/FJC.0b013e318159cbe3. [DOI] [PubMed] [Google Scholar]
- Ghosh S, Chiang PC, Wahlstrom JL, Fujiwara H, Selbo JG, Roberds SL. Oral delivery of 1,3-dicyclohexylurea nanosuspension enhances exposure and lowers blood pressure in hypertensive rats. Basic Clin Pharmacol Toxicol. 2008;102:453–458. doi: 10.1111/j.1742-7843.2008.00213.x. [DOI] [PubMed] [Google Scholar]
- Gomez GA, Morisseau C, Hammock BD, Christianson DW. Human soluble epoxide hydrolase: structural basis of inhibition by 4-(3-cyclohexylureido)-carboxylic acids. Protein Sci. 2006;15:58–64. doi: 10.1110/ps.051720206. [DOI] [PMC free article] [PubMed] [Google Scholar]
- Granero GE, Amidon GL. Possibility of enterohepatic recycling of ketoprofen in dogs. Int J Pharm. 2008;349:166–171. doi: 10.1016/j.ijpharm.2007.08.005. [DOI] [PubMed] [Google Scholar]
- Harris TR, Li N, Chiamvimonvat N, Hammock BD. The potential of soluble epoxide hydrolase inhibition in the treatment of cardiac hypertrophy. Congest Heart Fail. 2008;14:219–224. doi: 10.1111/j.1751-7133.2008.08430.x. [DOI] [PMC free article] [PubMed] [Google Scholar]
- Huang H, Morisseau C, Wang J, Yang T, Falck JR, Hammock BD, Wang MH. Increasing or stabilizing renal epoxyeicosatrienoic acid production attenuates abnormal renal function and hypertension in obese rats. Am J Physiol Renal Physiol. 2007;293:F342–349. doi: 10.1152/ajprenal.00004.2007. [DOI] [PubMed] [Google Scholar]
- Hwang SH, Morisseau C, Do Z, Hammock BD. Solid-phase combinatorial approach for the optimization of soluble epoxide hydrolase inhibitors. Bioorg Med Chem Lett. 2006;16:5773–5777. doi: 10.1016/j.bmcl.2006.08.078. [DOI] [PMC free article] [PubMed] [Google Scholar]
- Hwang SH, Tsai HJ, Liu JY, Morisseau C, Hammock BD. Orally bioavailable potent soluble epoxide hydrolase inhibitors. J Med Chem. 2007;50:3825–3840. doi: 10.1021/jm070270t. [DOI] [PMC free article] [PubMed] [Google Scholar]
- Imig JD, Zhao X, Capdevila JH, Morisseau C, Hammock BD. Soluble epoxide hydrolase inhibition lowers arterial blood pressure in angiotensin II hypertension. Hypertension. 2002;39:690–694. doi: 10.1161/hy0202.103788. [DOI] [PubMed] [Google Scholar]
- Imig JD, Zhao X, Zaharis CZ, Olearczyk JJ, Pollock DM, Newman JW, Kim IH, Watanabe T, Hammock BD. An orally active epoxide hydrolase inhibitor lowers blood pressure and provides renal protection in salt-sensitive hypertension. Hypertension. 2005;46:975–981. doi: 10.1161/01.HYP.0000176237.74820.75. [DOI] [PMC free article] [PubMed] [Google Scholar]
- Inceoglu B, Jinks SL, Schmelzer KR, Waite T, Kim IH, Hammock BD. Inhibition of soluble epoxide hydrolase reduces LPS-induced thermal hyperalgesia and mechanical allodynia in a rat model of inflammatory pain. Life Sci. 2006;79:2311–2319. doi: 10.1016/j.lfs.2006.07.031. [DOI] [PMC free article] [PubMed] [Google Scholar]
- Jones PD, Tsai HJ, Do ZN, Morisseau C, Hammock BD. Synthesis and SAR of conformationally restricted inhibitors of soluble epoxide hydrolase. Bioorg Med Chem Lett. 2006;16:5212–5216. doi: 10.1016/j.bmcl.2006.07.009. [DOI] [PMC free article] [PubMed] [Google Scholar]
- Jones PD, Wolf NM, Morisseau C, Whetstone P, Hock B, Hammock BD. Fluorescent substrates for soluble epoxide hydrolase and application to inhibition studies. Anal Biochem. 2005;343:66–75. doi: 10.1016/j.ab.2005.03.041. [DOI] [PMC free article] [PubMed] [Google Scholar]
- Jung O, Brandes RP, Kim IH, Schweda F, Schmidt R, Hammock BD, Busse R, Fleming I. Soluble epoxide hydrolase is a main effector of angiotensin II-induced hypertension. Hypertension. 2005;45:759–765. doi: 10.1161/01.HYP.0000153792.29478.1d. [DOI] [PubMed] [Google Scholar]
- Kasagami T, Kim IH, Tsai HJ, Nishi K, Hammock BD, Morisseau C. Salicylate-urea-based soluble epoxide hydrolase inhibitors with high metabolic and chemical stabilities. Bioorg Med Chem Lett. 2009;19:1784–1789. doi: 10.1016/j.bmcl.2009.01.069. [DOI] [PMC free article] [PubMed] [Google Scholar]
- Kim IH, Heirtzler FR, Morisseau C, Nishi K, Tsai HJ, Hammock BD. Optimization of amide-based inhibitors of soluble epoxide hydrolase with improved water solubility. J Med Chem. 2005;48:3621–3629. doi: 10.1021/jm0500929. [DOI] [PMC free article] [PubMed] [Google Scholar]
- Kim IH, Morisseau C, Watanabe T, Hammock BD. Design, synthesis, and biological activity of 1,3-disubstituted ureas as potent inhibitors of the soluble epoxide hydrolase of increased water solubility. J Med Chem. 2004;47:2110–2122. doi: 10.1021/jm030514j. [DOI] [PubMed] [Google Scholar]
- Kim IH, Nishi K, Tsai HJ, Bradford T, Koda Y, Watanabe T, Morisseau C, Blanchfield J, Toth I, Hammock BD. Design of bioavailable derivatives of 12-(3-adamantan-1-yl-ureido)dodecanoic acid, a potent inhibitor of the soluble epoxide hydrolase. Bioorg Med Chem. 2007a;15:312–323. doi: 10.1016/j.bmc.2006.09.057. [DOI] [PMC free article] [PubMed] [Google Scholar]
- Kim IH, Tsai HJ, Nishi K, Kasagami T, Morisseau C, Hammock BD. 1,3-disubstituted ureas functionalized with ether groups are potent inhibitors of the soluble epoxide hydrolase with improved pharmacokinetic properties. J Med Chem. 2007b;50:5217–5226. doi: 10.1021/jm070705c. [DOI] [PMC free article] [PubMed] [Google Scholar]
- Lascelles BD, McFarland JM, Swann H. Guidelines for safe and effective use of NSAIDs in dogs. Vet Ther. 2005;6:237–251. [PubMed] [Google Scholar]
- Li HY, Jin Y, Morisseau C, Hammock BD, Long YQ. The 5-substituted piperazine as a novel secondary pharmacophore greatly improving the physical properties of urea-based inhibitors of soluble epoxide hydrolase. Bioorg Med Chem. 2006;14:6586–6592. doi: 10.1016/j.bmc.2006.06.005. [DOI] [PMC free article] [PubMed] [Google Scholar]
- Li J, Carroll MA, Chander PN, Falck JR, Sangras B, Stier CT. Soluble epoxide hydrolase inhibitor, AUDA, prevents early salt-sensitive hypertension. Front Biosci. 2008;13:3480–3487. doi: 10.2741/2942. [DOI] [PubMed] [Google Scholar]
- Lipinski CA, Lombardo F, Dominy BW, Feeney PJ. Experimental and computational approaches to estimate solubility and permeability in drug discovery and development settings. Adv Drug Deliv Rev. 2001;46:3–26. doi: 10.1016/s0169-409x(00)00129-0. [DOI] [PubMed] [Google Scholar]
- Liu JY, Tsai HJ, Hwang SH, Jones PD, Morisseau C, Hammock BD. Pharmacokinetic optimization of four soluble epoxide hydrolase inhibitors for use in a murine model of inflammation. Br J Pharmacol. 2009;156:284–296. doi: 10.1111/j.1476-5381.2008.00009.x. [DOI] [PMC free article] [PubMed] [Google Scholar]
- Liu Y, Zhang Y, Schmelzer K, Lee TS, Fang X, Zhu Y, Spector AA, Gill S, Morisseau C, Hammock BD, Shyy JY. The antiinflammatory effect of laminar flow: the role of PPARgamma, epoxyeicosatrienoic acids, and soluble epoxide hydrolase. Proc Natl Acad Sci U S A. 2005;102:16747–16752. doi: 10.1073/pnas.0508081102. [DOI] [PMC free article] [PubMed] [Google Scholar]
- Loch D, Hoey A, Morisseau C, Hammock BO, Brown L. Prevention of Hypertension in DOCA-Salt Rats by an Inhibitor of Soluble Epoxide Hydrolase. Cell Biochem Biophys. 2007;47:87–98. doi: 10.1385/cbb:47:1:87. [DOI] [PMC free article] [PubMed] [Google Scholar]
- Luria A, Weldon SM, Kabcenell AK, Ingraham RH, Matera D, Jiang H, Gill R, Morisseau C, Newman JW, Hammock BD. Compensatory mechanism for homeostatic blood pressure regulation in Ephx2 gene-disrupted mice. J Biol Chem. 2007;282:2891–2898. doi: 10.1074/jbc.M608057200. [DOI] [PMC free article] [PubMed] [Google Scholar]
- Manitpisitkul P, White RE. Whatever happened to cassette-dosing pharmacokinetics? Drug Discov Today. 2004;9:652–658. doi: 10.1016/S1359-6446(04)03137-X. [DOI] [PubMed] [Google Scholar]
- Monti J, Fischer J, Paskas S, Heinig M, Schulz H, Gosele C, Heuser A, Fischer R, Schmidt C, Schirdewan A, Gross V, Hummel O, Maatz H, Patone G, Saar K, Vingron M, Weldon SM, Lindpaintner K, Hammock BD, Rohde K, Dietz R, Cook SA, Schunck WH, Luft FC, Hubner N. Soluble epoxide hydrolase is a susceptibility factor for heart failure in a rat model of human disease. Nat Genet. 2008;40:529–537. doi: 10.1038/ng.129. [DOI] [PMC free article] [PubMed] [Google Scholar]
- Morisseau C, Derbel M, Lane TR, Stoutamire D, Hammock BD. Differential induction of hepatic drug-metabolizing enzymes by fenvaleric acid in male rats. Toxicol Sci. 1999a;52:148–153. doi: 10.1093/toxsci/52.2.148. [DOI] [PubMed] [Google Scholar]
- Morisseau C, Goodrow MH, Dowdy D, Zheng J, Greene JF, Sanborn JR, Hammock BD. Potent urea and carbamate inhibitors of soluble epoxide hydrolases. Proc Natl Acad Sci U S A. 1999b;96:8849–8854. doi: 10.1073/pnas.96.16.8849. [DOI] [PMC free article] [PubMed] [Google Scholar]
- Morisseau C, Hammock BD. Measurements of soluble epoxide hydrolase (sEH) activity. John Wiley & Sons; New Jersey: 2007. [DOI] [PubMed] [Google Scholar]
- Morisseau C, Newman JW, Tsai HJ, Baecker PA, Hammock BD. Peptidyl-urea based inhibitors of soluble epoxide hydrolases. Bioorg Med Chem Lett. 2006;16:5439–5444. doi: 10.1016/j.bmcl.2006.07.073. [DOI] [PMC free article] [PubMed] [Google Scholar]
- Newman JW, Morisseau C, Hammock BD. Epoxide hydrolases: their roles and interactions with lipid metabolism. Prog Lipid Res. 2005;44:1–51. doi: 10.1016/j.plipres.2004.10.001. [DOI] [PubMed] [Google Scholar]
- Node K, Huo Y, Ruan X, Yang B, Spiecker M, Ley K, Zeldin DC, Liao JK. Anti-inflammatory properties of cytochrome P450 epoxygenase-derived eicosanoids. Science. 1999;285:1276–1279. doi: 10.1126/science.285.5431.1276. [DOI] [PMC free article] [PubMed] [Google Scholar]
- Olearczyk JJ, Quigley JE, Mitchell BC, Yamamoto T, Kim IH, Newman JW, Luria A, Hammock BD, Imig JD. Administration of a substituted adamantly-urea inhibitor of soluble epoxide hydrolase protects the kidney from damage in hypertensive Goto-Kakizaki rats. Clin Sci. 2009;116:61–70. doi: 10.1042/CS20080039. [DOI] [PMC free article] [PubMed] [Google Scholar]
- Parrish AR, Chen G, Burghardt RC, Watanabe T, Morisseau C, Hammock BD. Attenuation of cisplatin nephrotoxicity by inhibition of soluble epoxide hydrolase. Cell Biol Toxicol. 2009;25:217–225. doi: 10.1007/s10565-008-9071-0. [DOI] [PMC free article] [PubMed] [Google Scholar]
- Schmelzer KR, Inceoglu B, Kubala L, Kim IH, Jinks SL, Eiserich JP, Hammock BD. Enhancement of antinociception by coadministration of nonsteroidal anti-inflammatory drugs and soluble epoxide hydrolase inhibitors. Proc Natl Acad Sci U S A. 2006;103:13646–13651. doi: 10.1073/pnas.0605908103. [DOI] [PMC free article] [PubMed] [Google Scholar]
- Schmelzer KR, Kubala L, Newman JW, Kim IH, Eiserich JP, Hammock BD. Soluble epoxide hydrolase is a therapeutic target for acute inflammation. Proc Natl Acad Sci U S A. 2005;102:9772–9777. doi: 10.1073/pnas.0503279102. [DOI] [PMC free article] [PubMed] [Google Scholar]
- Sellers KW, Sun C, Diez-Freire C, Waki H, Morisseau C, Falck JR, Hammock BD, Paton JF, Raizada MK. Novel mechanism of brain soluble epoxide hydrolase-mediated blood pressure regulation in the spontaneously hypertensive rat. Faseb J. 2005;19:626–628. doi: 10.1096/fj.04-3128fje. [DOI] [PubMed] [Google Scholar]
- Shen HC, Ding FX, Wang S, Deng Q, Zhang X, Chen Y, Zhou G, Xu S, Chen HS, Tong X, Tong V, Mitra K, Kumar S, Tsai C, Stevenson AS, Pai LY, Alonso-Galicia M, Chen X, Soisson SM, Roy S, Zhang B, Tata JR, Berger JP, Colletti SL. Discovery of a Highly Potent, Selective, and Bioavailable Soluble Epoxide Hydrolase Inhibitor with Excellent Ex Vivo Target Engagement. J Med Chem. 2009 doi: 10.1021/jm900725r. [DOI] [PubMed] [Google Scholar]
- Smith KR, Pinkerton KE, Watanabe T, Pedersen TL, Ma SJ, Hammock BD. Attenuation of tobacco smoke-induced lung inflammation by treatment with a soluble epoxide hydrolase inhibitor. Proc Natl Acad Sci U S A. 2005;102:2186–2191. doi: 10.1073/pnas.0409591102. [DOI] [PMC free article] [PubMed] [Google Scholar]
- Smythe CM, Heinemann HO, Bradley SE. Estimated hepatic blood flow in the dog; effect of ethyl alcohol on it, renal blood flow, cardiac output and arterial pressure. Am J Physiol. 1953;172:737–742. doi: 10.1152/ajplegacy.1953.172.3.737. [DOI] [PubMed] [Google Scholar]
- Spector AA. Arachidonic acid cytochrome P450 epoxygenase pathway. J Lipid Res. 2008 doi: 10.1194/jlr.R800038-JLR200. [DOI] [PMC free article] [PubMed] [Google Scholar]
- Taketani M, Shii M, Ohura K, Ninomiya S, Imai T. Carboxylesterase in the liver and small intestine of experimental animals and human. Life Sci. 2007;81:924–932. doi: 10.1016/j.lfs.2007.07.026. [DOI] [PubMed] [Google Scholar]
- Tibbitts J. Issues related to the use of canines in toxicologic pathology--issues with pharmacokinetics and metabolism. Toxicol Pathol. 2003;31(Suppl):17–24. doi: 10.1080/01926230390174896. [DOI] [PubMed] [Google Scholar]
- Ulu A, Davis BB, Tsai HJ, Kim IH, Morisseau C, Inceoglu B, Fiehn O, Hammock BD, Weiss RH. Soluble epoxide hydrolase inhibitors reduce the development of atherosclerosis in apolipoprotein e-knockout mouse model. J Cardiovasc Pharmacol. 2008;52:314–323. doi: 10.1097/FJC.0b013e318185fa3c. [DOI] [PMC free article] [PubMed] [Google Scholar]
- Watanabe T, Schulz D, Morisseau C, Hammock BD. High-throughput pharmacokinetic method: Cassette dosing in mice associated with minuscule serial bleedings and LC/MS/MS analysis. Anal Chim Acta. 2006;559:37–44. doi: 10.1016/j.aca.2005.11.049. [DOI] [PMC free article] [PubMed] [Google Scholar]
- White RE, Manitpisitkul P. Pharmacokinetic theory of cassette dosing in drug discovery screening. Drug Metab Dispos. 2001;29:957–966. [PubMed] [Google Scholar]
- Wixtrom RN, Silva MH, Hammock BD. Affinity purification of cytosolic epoxide hydrolase using derivatized epoxy-activated Sepharose gels. Anal Biochem. 1988;169:71–80. doi: 10.1016/0003-2697(88)90256-4. [DOI] [PubMed] [Google Scholar]
- Wolf NM, Morisseau C, Jones PD, Hock B, Hammock BD. Development of a high-throughput screen for soluble epoxide hydrolase inhibition. Anal Biochem. 2006;355:71–80. doi: 10.1016/j.ab.2006.04.045. [DOI] [PMC free article] [PubMed] [Google Scholar]
- Xu D, Li N, He Y, Timofeyev V, Lu L, Tsai HJ, Kim IH, Tuteja D, Mateo RK, Singapuri A, Davis BB, Low R, Hammock BD, Chiamvimonvat N. Prevention and reversal of cardiac hypertrophy by soluble epoxide hydrolase inhibitors. Proc Natl Acad Sci U S A. 2006;103:18733–18738. doi: 10.1073/pnas.0609158103. [DOI] [PMC free article] [PubMed] [Google Scholar]
- Zhang W, Koerner IP, Noppens R, Grafe M, Tsai HJ, Morisseau C, Luria A, Hammock BD, Falck JR, Alkayed NJ. Soluble epoxide hydrolase: a novel therapeutic target in stroke. J Cereb Blood Flow Metab. 2007a;27:1931–1940. doi: 10.1038/sj.jcbfm.9600494. [DOI] [PMC free article] [PubMed] [Google Scholar]
- Zhang W, Koerner IP, Noppens R, Grafe M, Tsai HJ, Morisseau C, Luria A, Hammock BD, Falck JR, Alkayed NJ. Soluble epoxide hydrolase: a novel therapeutic target in stroke. J Cereb Blood Flow Metab. 2007b doi: 10.1038/sj.jcbfm.9600494. [DOI] [PMC free article] [PubMed] [Google Scholar]
- Zhao X, Yamamoto T, Newman JW, Kim IH, Watanabe T, Hammock BD, Stewart J, Pollock JS, Pollock DM, Imig JD. Soluble epoxide hydrolase inhibition protects the kidney from hypertension-induced damage. J Am Soc Nephrol. 2004;15:1244–1253. [PubMed] [Google Scholar]
Associated Data
This section collects any data citations, data availability statements, or supplementary materials included in this article.