

Abstract
The human brain is organized in functional modules. Such an organization presents a basic conundrum: Modules ought to be sufficiently independent to guarantee functional specialization and sufficiently connected to bind multiple processors for efficient information transfer. It is commonly accepted that small-world architecture of short paths and large local clustering may solve this problem. However, there is intrinsic tension between shortcuts generating small worlds and the persistence of modularity, a global property unrelated to local clustering. Here, we present a possible solution to this puzzle. We first show that a modified percolation theory can define a set of hierarchically organized modules made of strong links in functional brain networks. These modules are “large-world” self-similar structures and, therefore, are far from being small-world. However, incorporating weaker ties to the network converts it into a small world preserving an underlying backbone of well-defined modules. Remarkably, weak ties are precisely organized as predicted by theory maximizing information transfer with minimal wiring cost. This trade-off architecture is reminiscent of the “strength of weak ties” crucial concept of social networks. Such a design suggests a natural solution to the paradox of efficient information flow in the highly modular structure of the brain.
Keywords: fractals, critical phenomena, scaling critical exponents, neuroscience, statistical physics
One of the main findings in neuroscience is the modular organization of the brain, which in turn implies the parallel nature of brain computations (1–3). For example, in the visual modality, more than 30 visual areas analyze simultaneously distinct features of the visual scene: motion, color, orientation, space, form, luminance, and contrast, among others (4). These features, as well as information from different sensory modalities, have to be integrated, as one of the main aspects of perception is its unitary nature (1, 5).
This leads to a basic conundrum of brain networks: Modular processors have to be sufficiently isolated to achieve independent computations, but also globally connected to be integrated in coherent functions (1, 2, 6). A current view is that small-world networks provide a solution to this puzzle because they combine high local clustering and short path length (7–9). This view has been fueled by the systematic finding of small-world topology in a wide range of human brain networks derived from structural (10), functional (11–13), and diffusion tensor MRI (14). Small-world topology has also been identified at the cellular-network scale in functional cortical neuronal circuits in mammals (15, 16) and even in the nervous system of the nematode Caenorhabditis elegans (8). Moreover, small-world property seems to be relevant for brain function because it is affected by disease (17), normal aging, and by pharmacological blockade of dopamine neurotransmission (13).
Although brain networks show small-world properties, several experimental studies have also shown that they are hierarchical, fractal and highly modular (2, 3, 18). As there is an intrinsic tension between modular and small-world organization, the main aim of this study is to reconcile these ubiquitous and seemingly contradictory topological properties. Indeed, traditional models of small-world networks cannot fully capture the coexistence of highly modular structure with broad global integration. First, clustering is a purely local quantity that can be assessed inspecting the immediate neighborhood of a node (8). On the contrary, modularity is a global property of the network, determined by the existence of strongly connected groups of nodes that are only loosely connected to the rest of the network (2, 3, 19, 20). In fact, it is easy to construct modular and unclustered networks or, reciprocally, clustered networks without modules.
Second, the short distances of a small world may be incompatible with strong modularity, which typically presents the properties of a “large world” (21–27) characterized by long distances that effectively suppress diffusion and free flow in the system (26). Although a clustered network preserves its clustering coefficient when a small fraction of shortcuts are added (converting it into a small world) (8), the persistence of modules is not equally robust. As we show below, shrinking the network diameter may quickly destroy the modules.
Hence, the concept of small world may not be entirely sufficient to explain the modular and integration features of functional brain networks on its own. We propose that a solution to modularity and broad integration can be achieved by a network in which strong links form large-world fractal modules, which are shortcut by weaker links establishing a small-world network. A modified percolation theory (28, 29) can identify a sequence of critical values of connectivity thresholds forming a hierarchy of modules that progressively merge together. This proposal is inspired by a fundamental notion of sociology termed by Granovetter as “the strength of weak ties” (30, 31). According to this theory, strong ties (close friends) clump together forming modules. An acquaintance (weak tie) becomes a crucial bridge (a shortcut) between the two densely knit clumps (modules) of close friends (30).
Interestingly, this theme also emerges in theoretical models of large-scale cognitive architecture. Several theories suggest integration mechanisms based on dynamic binding (6, 32) or on a workspace system (1, 33). For instance, the workspace model (1, 33) proposes that a flexible routing system with dynamic and comparably weaker connections transiently connects modules with very strong connections carved by long-term learning mechanisms.
Results
Experimental Design and Network Construction.
We capitalize on a well-known dual-task paradigm, the psychological refractory period (34). A total of 16 subjects responded with the right hand to a visual stimulus and with the left hand to an auditory stimulus (see SI Text). The temporal gap between the auditory and visual stimuli varied in four stimulus onset asynchrony, SOA = 0, 300, 900, and 1,200 ms. The sequence of activated regions that unfolds during the execution of the task has been reported in a previous study (35).
The network analysis relies on the time-resolved blood oxygen level-dependent functional magnetic resonance imaging (BOLD-fMRI) response based on the phase signal obtained for each voxel of data (36). We first compute the phase of the BOLD signal for each voxel with methods developed previously (36). For each subject and each SOA task, we obtain the phase signal of the ith voxel of activity, ϕi(t){t=1,..,T}, over T = 40 trials performed for a particular SOA value and subject. We use these signals to construct the network topology of brain voxels based on the equal-time cross-correlation matrix, Cij, of the phase activity of the two voxels (see SI Text). The accuracy of the calculated Cij values was estimated through a bootstrapping analysis (see SI Text and Fig. S1).
To construct the network, we link two voxels if their cross-correlation Cij is larger than a predefined threshold value p (11, 12, 37). The resulting network for a given p is a representation of functional relations among voxels for a specific subject and SOA. We obtain 64 cross-correlation networks resulting from the four SOA values presented to the 16 subjects.
Percolation Analysis.
Graph analyses of brain correlations relies on a threshold (11), which is problematic because small-world-like properties are sensitive to even a small proportion of variation in the connections. The following analysis may be seen as an attempt to solve this problem.
The thresholding procedure explained above can be naturally mapped to a percolation process (defined in the N × N space of interactions Cij). Percolation is a model to describe geometrical phase transitions of connected clusters in random graphs; see ref. 28, chapters 2 and 3, and refs. 29 and 38.
In general, the size of the largest component of connected nodes in a percolation process remains very small for large p. The crucial concept is that the largest connected component increases rapidly through a critical phase transition at pc, in which a single incipient cluster dominates and spans the system (28, 29, 38). A unique connected component is expected to appear if the links in the network are occupied at random without correlations. However, when we apply the percolation analysis to the functional brain network, a more complex picture emerges revealing a hierarchy of clusters arising from the nontrivial correlations in brain activity.
For each participant, we calculate the size of the largest connected component as a function of p. We find that the largest cluster size increases progressively with a series of sharp jumps (Fig. 1A, SOA = 900 ms, all participants, other SOA stimuli are similar). This suggests a multiplicity of percolation transitions where percolating modules subsequently merge as p decreases rather than following the typical uncorrelated percolation process with a single spanning cluster. Each of these jumps defines a percolation transition focused on groups of nodes that are highly correlated, constituting well-defined modules.
Fig. 1.

Percolation analysis. (A) Size of the largest connected component of voxels (as measured by the fraction to the total system size) versus p for the 16 subjects (SOA = 900 ms). The other three SOA values give similar results. The Inset presents a detail around p ≈ 0.95. (B) Detail for a representative individual. As we lower p, the size of the largest component increases in jumps when new modules emerge, grow, and finally get absorbed by the largest component. We show the evolution of the modules by plotting connected components with more than 1,000 voxels. The hierarchical tree at the top of the plot shows how clusters evolve by merging with each other. (C) A typical module in network representation. (D) The same module as in C embedded in real space—this specific module projects to the medial occipital cortex, see SI Text for the spatial projection of all modules.
Fig. 1B shows the detailed behavior of the jumps in a typical individual (subject labeled #1 in our dataset available at http://lev.ccny.cuny.edu/~hmakse/brain.html, SOA = 900 ms). At high values of p, three large clusters are formed localized to the medial occipital cortex (red), the lateral occipital cortex (orange), and the anterior cingulate (green). At a lower p = 0.979, the orange and red clusters merge as revealed by the first jump in the percolation picture. As p continues to decrease this mechanism of cluster formation and absorption repeats, defining a hierarchical process as depicted in Fig. 1B Upper. This analysis further reveals the existence of “stubborn” clusters. For instance, the anterior cingulate cluster (green), known to be involved in cognitive control (39, 40) and which hence cannot commit to a specific functional module, remains detached from the other clusters down to low p values. Even at the lower values of p, when a massive region of the cortex—including motor, visual and auditory regions—has formed a single incipient cluster (red, p ≈ 0.94), two new clusters emerge; one involving subcortical structures including the thalamus and striatum (cyan) and the other involving the left frontal cortex (purple). This mechanism reveals the iteration of a process by which modules form at a given p value and merged by comparably weaker links. This process is recursive. The weak links of a given transition become the strong links of the next transition, in a hierarchical fashion.
Below, we focus our analysis on the first jump in the size of the largest connected component, for instance, pc = 0.979 in Fig. 1B. We consider the three largest modules at pc with at least 1,000 voxels each. This analysis results in a total of 192 modules among all participants and stimuli, which are pooled together for the next study. An example of an identified module in the medial occipital cortex of subject #1 and SOA = 900 ms is shown in Fig. 1C in the network representation and in Fig. 1D in real space. The topography of the modules reflects coherent patterns across the subjects and stimuli as analyzed in SI Text (see Fig. S2).
Scaling Analysis and Renormalization Group.
To determine the structure of the modules we investigate the scaling of the “mass” of each module (the total number of voxels in the module, Nc) as a function of three length scales defined for each module: (I) the maximum path length, ℓmax; (ii) the average path length between two nodes,  ; and (iii) the maximum Euclidean distance among any two nodes in the cluster, rmax. The path length, ℓ, is the distance in network space defined as the number of links along the shortest path between two nodes. The maximum ℓmax is the largest shortest path in the network.
Fig. 2A indicates power-law scaling for these quantities (21, 28). For instance,
| [1] |
defines the Euclidean Hausdorff fractal dimension, df = 2.1 ± 0.1. The scaling with ℓmax and  is consistent with Eq. 1, as seen in Fig. 2A. The exponent df quantifies how densely the volume of the brain is covered by a specific module.
Fig. 2.

Strong ties define fractal modules. (A) Number of voxels or mass of each module, Nc, versus ℓmax (red circles),  (green squares), and rmax (blue diamonds). Each point represents a bin average over the modules for all subjects and stimuli. We use all the modules appearing at pc. The straight lines are fittings according to Eq. 1. The variance is the statistical error over the different modules. The variance is similar in the other data. (B) Detection of submodules and fractal dimension inside the percolation modules. We demonstrate the box-covering algorithm for a schematic network, following the MEMB algorithm in refs. 21 and 41 (SI Text). We cover a network with boxes of size ℓB, which are identified as submodules. We define ℓB as the shortest path plus one. (C) Scaling of the number of boxes NB needed to cover the network of a module versus ℓB yielding dB. We average over all the identified modules for all subjects. (D) Quantification of the modularity of the brain modules. The identified percolation modules at pc are composed of submodules with a high level of modularity, as can be seen by the scaling of
  with ℓB that yields a large modularity exponent dM = 1.9 ± 0.1. Deviations from linear scaling are found at large ℓB due to boundary effects because the network is reduced to just a few submodules.
Next, we investigate the network properties of each module, applying renormalization group (RG) analysis for complex networks (21–25). This technique allows one to observe the network at different scales transforming it into successively simpler copies of itself, which can be used to detect characteristics that are difficult to identify at a specific scale of observation. We use this technique to characterize submodular structure within each brain module (2).
We consider each module identified at pc separately. We then tile it with the minimum number of boxes or submodules, NB, of a given box diameter ℓB (21); i.e., every pair of nodes in a box has shortest path length smaller than ℓB. Covering the network with minimal NB submodules represents an optimization problem that is solved using standard box-covering algorithms, such as the Maximum Excluded Mass Burning algorithm, MEMB, which was introduced in refs. 21, 22, and 41 to describe the self-similarity of complex networks ranging from the World Wide Web, biological, and technical networks (see SI Text and Fig. 2B describing MEMB; the entire experimental dataset and modularization and fractal codes are available at http://lev.ccny.cuny.edu/~hmakse/brain.html). The requirement to minimize the number of boxes is important because the resulting boxes are characterized by the proximity between all their nodes and minimization of the links connecting the boxes (26). Thus, the box-covering algorithm detects boxes/submodules that also tend to maximize modularity.
The repetitive application of box-covering at different values of ℓB is an RG transformation (21) that yields a different partition of the brain modules in submodules of varying sizes (Fig. 2B). Fig. 2C shows the scaling of NB versus ℓB averaged over all the modules for all individuals and stimuli. This property is quantified in the power-law relation (21):
| [2] |
where dB is the box fractal dimension (21–25), which characterizes the self-similarity between different scales of the module where smaller-scale boxes behave in a similar way as the original network. The resulting dB averaged over all the modules is dB = 1.9 ± 0.1.
Morphology of the Brain Modules.
The RG analysis reveals that the module topology does not have many redundant links, and it represents the quantitative statement that the brain modules are large worlds. However, this analysis is not sufficient to precisely characterize the topology of the modules. For example, both, a two-dimensional complex network architecture and a simple two-dimensional lattice are compatible with the scaling analysis and the value of the exponents described in the previous section.
To identify the network architecture of the modules we follow established analysis (18, 42) based on the study of the degree distribution of the modules, P(k), and the degree-degree correlation P(k1,k2) (22, 43). The form of P(k) distinguishes between a Euclidean lattice (delta function), an Erdos–Renyi network (Poisson) (29), or a scale-free network (power law) (42). We find that the degree distribution of the brain modules is a power law (11, 42) P(k) ∼ k-γ over an interval of k values. In the SI Text and Fig. S3 we describe a statistical analysis based on maximum likelihood methods and KS analysis, which yield the value of the degree exponent γ = 2.1 ± 0.1 and the interval and error probability of the hypothesis that the data follow a power law (Fig. S4). The analysis rules out an exponential distribution (see SI Text).
How can fractal modularity emerge in light of the scale-free property, which is usually associated with small worlds (18)? In a previous study (22), we introduced a model to account for the simultaneous emergence of scale-free, fractality, and modularity in real networks by a multiplicative process in the growth of the number of links, nodes, and distances in the network. The dynamic follows the inverse of the RG transformation (22) where the hubs acquire new connections by linking preferentially with less connected nodes rather than other hubs. This kind of “repulsion between hubs” (23) creates a dissasortative structure— with hubs spreading uniformly in the network and not crumpling in the core as in scale-free models (42). Hubs are buried deep into the modules, while low degree nodes are the intermodule connectors (23).
A signature of such mechanism can be found by following hubs’ degree during the renormalization procedure. At scale ℓB, the degree of a hub k changes to the degree of its box k′, through the relation k′ = s(ℓB)k. The dependence of the scaling factor s(ℓB) on ℓB defines the renormalized degree exponent dk by 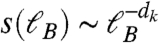 (21). Scaling theory defines precise relations between the exponents for fractal networks (21), through γ = 1 + dB/dk. For the case of brain modules analyzed here (Fig. S4A), we find dk = 1.5 ± 0.1. Using the values of dB and dk for the brain clusters, the prediction is γ = 2.26 ± 0.11, which is within error bars of the calculated value γ = 2.1 ± 0.1 from Fig. S4B.
The previous analysis reveals the mechanism of formation of a scale-free network, but it does not assure a fractal topology, yet. Fractality can be determined from the study of the degree-degree correlation through the distribution, P(k1,k2) to find a link between nodes with (k1,k2) degree (22, 43). This correlation characterizes the hub-hub repulsion through scaling exponents de and ϵ (see SI Text and Fig. S6) (22, 43). In a fractal, they satisfy ϵ = 2 + de/dk. A direct measurement of these exponents yields de = 0.51 ± 0.08 and ϵ = 2.1 ± 0.1 (Fig. S6). Using the measured values of de and dk, we predict ϵ = 2.3 ± 0.1, which is close to the observed exponent. Taken together, these results indicate a scale-free fractal morphology of brain modules. Such structure is in agreement with previous results of the anatomical connectivity of the brain (2, 3) and functional brain networks (11).
Quantifying Submodular Structure of Brain Modules.
Standard modularity decomposition methods (19, 20) based on maximization of the modularity factor Q as defined in refs. 2, 19, 20, 26, and 27 can uncover the submodular structure. For example, the Girvan–Newman method (19) yields a value of Q ∼ 0.82 for the brain clusters, indicating a strong modular substructure. Additionaly, the box-covering algorithm benefits from detecting submodules (the boxes) at different scales. Then, we can study the hierarchical character of modularity (2, 26, 27) and detect whether modularity is a feature of the network that remains scale-invariant (see SI Text and Fig. S7 for a comparison of the submodular structure obtained using Girvan–Newman and box-covering).
The minimization of NB guarantees a network partition with the largest number of intramodule links and the fewest intermodule links. Therefore, the box-covering algorithm maximizes the following modularity factor (26, 27):
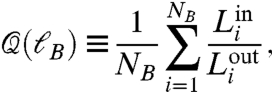 |
[3] |
which is a variation of the modularity factor, Q, defined in refs. 19 and 20. Here,  and
and  represent the intra- and intermodular links in a submodule i, respectively. Large values of
  (i.e.,
  ) correspond to high modularity (26). We make the whole modularization method available at http://lev.ccny.cuny.edu/~hmakse/brain.html.
Fig. 2D shows the scaling of  averaged over all modules at percolation revealing a monotonic increase with a lack of a characteristic value of ℓB. Indeed, the data can be fitted with a power-law form (26):
| [4] |
which is detected through the modularity exponent, dM. We study the networks for all the subjects and stimuli and find dM = 1.9 ± 0.1 (Fig. 2D). The lack of a characteristic length scale expressed in Eq. 4 implies that submodules are organized within larger modules such that the interconnections between those submodules repeat the basic modular character of the entire brain network.
The value of dM reveals a considerable modularity in the system as it is visually apparent in the sample of Fig. 3A
Left, where different colors identify the submodules of size ℓB = 15 in a typical fractal module. For comparison, a randomly rewired network (Fig. 3A
Right and Center) shows no modularity and has dM ≈ 0. Scaling analysis indicates that dM is related to 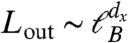 , which defines the outbound exponent dx characterizing the number of intermodular links for a submodule (26) [dx is related to the Rent exponent in integrated circuits (3)]. From Eq. 4, we find: dM = dB - dx, which indicates that the strongest possible modular structure has dM = dB (dx = 0) (26). Such a high modularity induces very slow diffusive processes (subdiffusion) for a random walk in the network (26). Comparing Eq. 4 with Eq. 2, we find dx = 0, which quantifies the large modularity in the brain modules.
Fig. 3.

Transition from fractal to small-world networks. (A) (Left) A typical percolation module in network space. The colors identify submodules obtained by the box-covering algorithm with ℓB = 15. This fractal module contains 4,097 nodes with 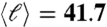 , ℓmax = 139, and rmax = 136 mm. When a small fraction prew of the links are randomly rewired (8), the modular structure disappears together with the shrinking path length. The rewiring method starts by selecting a random link and cutting one of its edges. This edge is then rewired to another randomly selected node, and another random link starting from this node is selected. This is again cut and rewired to a new random node, and we repeat the process until we have rewired a fraction prew of links. The final link is then attached to the initially cut node, so that the degree of each node remains unchanged. (B) Small-world cannot coexist with modularity. The large diameter and modularity factor, Eq. 4 for ℓB = 15, of the fractal module in A (Left) diminish rapidly upon rewiring a tiny fraction prew ≈ 0.01 of links, while the clustering coefficient still remains quite large. (C) The transition from fractal to small-world to random structure is shown when we plot the mass versus the average distance for all modules for different prew values as indicated. The crossover from power-law fractal to exponential small-world/random is shown.
The Conundrum of Brain Networks: Small-World Efficiency or Large-World Fractal Modularity.
An important consequence of Eqs. 1 and 2 is that the network determined by the strong links above the first pc jump lacks the logarithmic scaling characteristic of small worlds and random networks (8):
| [5] |
A fractal network poses much larger distances than those appearing in small worlds (21): A distance ℓmax ∼ 100 observed in Fig. 2A (red curve) would require an enormous small-world network Nc ∼ 10100, rather than Nc ∼ 104, as observed for fractal networks in Fig. 2A. The structural differences between a modular fractal network and a small-world (and a random network) are starkly revealed in Fig. 3A. We rewire the fractal module in Fig. 3A Left by randomly reconnecting a fraction prew of the links while keeping the degree of each node intact (8).
Fig. 3B quantifies the transition from fractal (prev = 0) to small world (prev ≈ 0.01–0.1) and eventually to random networks (prev = 1), illustrated in Fig. 3A: We plot ℓmax(prew)/ℓmax(0), the clustering coefficient C(prew)/C(0), and 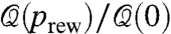 for a typical ℓB = 15 as we rewire prew links in the network. As we create a tiny fraction prew = 0.01 of shortcuts, the topology turns into a collapsed network with no trace of modularity left, while the clustering coefficient at prew = 0.01still remains quite high (Fig. 3B). The rewired networks present the exponential behavior of small worlds (8) and also random networks as prev increases, obtained from Eq. 5:
| [6] |
where Nc is averaged over all the modules (Fig. 3C). The characteristic size is very small and progressively shrinks to ℓ0 = 1/7 when prew = 1. The hallmark of small worlds and random networks, exponential scaling (Eq. 6), is incompatible with the hallmark of fractal large-worlds, power-law scaling (Eq. 2). More importantly, although we find a broad domain where short network distances coexist with high clustering forming a small-world behavior, modularity does not show such a robust behavior to the addition of shortcuts (Fig. 3B).
Shortcut Wiring Is Optimal for Efficient Flow.
Fig. 3B suggests that modularity and small world cannot coexist at the same level of connectivity strength. Next, we set out to investigate how the small world emerges.
When we extend the percolation analysis lowering further the threshold p below pc, weaker ties are incorporated to the network connecting the self-similar modules through shortcuts. A typical scenario is depicted in Fig. 4A, showing the three largest percolation modules identified just before the first percolation jump in the subject #1 shown in Fig. 1B at p = 0.98. For this connectivity strength, the modules are separated and show submodular fractal structure indicated in the colored boxes obtained with box-covering. When we lower the threshold to p = 0.975 (Fig. 4B) the modules are now connected and a global incipient component starts to appears. A second global percolation-like transition appears in the system when the mass of the largest component occupies half of the activated area (see, e.g., Fig. 1). For different individuals, global percolation occurs in the interval p = [0.945,0.96] as indicated in Fig. 1A Inset.
Fig. 4.

Weak ties are optimally distributed. (A) Three modules identified at pc = 0.98 for the subject in Fig. 1B. The colors correspond to different submodules as identified by the box-covering algorithm at ℓB = 21. (B) When we lower the threshold to p = 0.975, weak ties connect the modules. The three original modules as they appear in A are plotted in red; orange, purple, and the light blue nodes are the nodes added from A as we lower p. Blue lines represent the added weak links with distance longer than 10 mm. The weak links collapse the three modules into one. (C) Sketch of the different critical values of the shortcut exponent α in comparison with df. (D) Cumulative probability distribution P(rij > r). The straight line fitting yields an exponent α - 1 = 2.1 ± 0.1 indicating optimal information transfer with wiring cost minimization (45). Certain clusters occupy two diametric parts of the brain. In practice, these are two modules that are connected through long-range links. These links increase significantly the percentage of links at large distances rij, because they are superimposed on top of the regular distribution of links within unfragmented clusters. This behavior is manifested as a bump in the curve.
Our goal is to investigate whether the weak links shortcut the network in an optimal manner. When the cumulative probability distribution to find a Euclidean distance between two connected nodes, rij, larger than r follows a power law,
| [7] |
statistical physics makes precise predictions about optimization schemes for global function as a function of the shortcut exponent α and df (25, 44, 45). Specifically, there are three critical values for α, as shown schematically in Fig. 4C. If α is too large then shortcuts will not be sufficiently long and the network will behave as fractal, equal to the underlying structure. Below a critical value determined by α < 2df (25), shortcuts are sufficient to convert the network in a small world. Within this regime there are two significant optimization values:
Wiring cost minimization with full routing information. This considers a network of dimension df, over which shortcuts are added to optimize communication, with a wiring cost constraint proportional to the total shortcut length. It is also assumed that coordinates of the network are known (i.e., it is the shortest path that it is being minimized). Under these circumstances, the optimal distribution of shortcuts is α = df + 1 (45). This precise scaling is found in the US airport network (46), where a cost limitation applies to maximize profits.
Decentralized greedy searches with only local information. This corresponds to the classic Milgram’s “small-world experiment” of decentralized search in social networks (44), where a person has knowledge of local links and of the final destination but not of the intermediate routes. Under these circumstances, which also apply to routing packets in the Internet, the problem corresponds to a greedy search, rather than to optimization of the minimal path. The optimal relation for greedy routing is α = df (25, 44).
Hence, the analysis of P(rij > r) provides information both on the topology of the resulting network and on which transport procedure is optimized. This distribution reveals power-law behavior Eq. 7 with α = 3.1 ± 0.1 when averaged over the modules below pc (Fig. 4D). Given the value obtained in Eq. 1, df = 2.1, this implies that the network composed of strong and weak links is small-world (α < 2df) (25) and optimizes wiring cost with full knowledge of routing information (α = df + 1) (45).
Discussion
The existence of modular organization that becomes small world when shortcut by weaker ties is reminiscent of the structure found to bind dissimilar communities in social networks. Granovetter’s work in social sciences (30, 31) proposes the existence of weak ties to bind well-defined social groups into a large-scale social structure. The observation of such an organization in brain networks suggests that it may be a ubiquitous natural solution to the puzzle of information flow in highly modular structures.
Over the last decades, wire length minimization arguments have been used successfully to explain the architectural organization of brain circuitry (47–51). Our results are in agreement with this observation, suggesting that simultaneous optimization of network properties and wiring cost might be a relevant principle of brain architecture (see SI Text). In simple words, this topology does not minimize the total wire per se, simply to connect all the nodes; instead, it minimizes the amount of wire required to achieve the goal of shrinking the network to a small world. A second intriguing aspect of our results, which is not usually highlighted, is that this minimization assumes that broadcasting and routing information are known to each node. How this may be achieved—what aspects of the neural code convey its own routing information—remains an open question in neuroscience.
The present results provide a unique view by placing modularity under the three pillars of critical phenomena: scaling theory, universality, and renormalization groups (52). In this framework, brain modules are characterized by a set of unique scaling exponents, the septuplet (df,dB,dk,de,dM,γ,α) = (2.1,1.9,1.5,0.5,1.9,2.1,3.1), and the scaling relations dM = dB - dx, relating fractality with modularity; α = df + 1, relating global integration with modularity; γ = 1 + dB/dk, relating scale-free with fractality; and ϵ = 2 + de/dk, relating degree correlations with fractality.
One advantage of this formalism is that the different brain topologies can be classified into universality classes under RG (52) according to the septuplet (df,dB,dk,de,dM,γ,α). Universality applies to the critical exponents but not to quantities like (pc,C,ℓ0), which are sensitive to the microscopic details of the different experimental situations. In this framework, noncritical small worlds are obtained in the limit (df,dB,dk,de,dM,dx) → (∞,∞,∞,0,0,∞). A path for future research will be to test the universality of the septuplet of exponents under different activities covering other areas of the brain [e.g., the resting-state correlation structure (53)].
In conclusion, we propose a formal solution to the problem of information transfer in the highly modular structure of the brain. The answer is inspired by a classic finding in sociology: the strength of weak ties (30). The present work provides a general insight into the physical mechanisms of network information processing at large. It builds up on an example of considerable relevance to natural science, the organization of the brain, to establish a concrete solution to a broad problem in network science. The results can be readily applied to other systems—where the coexistence of modular specialization and global integration is crucial—ranging from metabolic, protein, and genetic networks to social networks and the Internet.
Supplementary Material
Acknowledgments.
We thank D. Bansal, S. Dehaene, S. Havlin, and H.D. Rozenfeld for valuable discussions. L.K.G. and H.A.M. thank the NSF-0827508 Emerging Frontiers Program for financial support. M.S. is supported by a Human Frontiers Science Program Fellowship.
Footnotes
The authors declare no conflict of interest.
This article is a PNAS Direct Submission. A.-L.B. is a guest editor invited by the Editorial Board.
This article contains supporting information online at www.pnas.org/lookup/suppl/doi:10.1073/pnas.1106612109/-/DCSupplemental.
References
- 1.Dehaene S, Naccache L. Towards a cognitive neuroscience of consciousness: Basic evidence and a workspace framework. Cognition. 2001;79:1–37. doi: 10.1016/s0010-0277(00)00123-2. [DOI] [PubMed] [Google Scholar]
- 2.Meunier D, Lambiotte R, Bullmore ET. Modular and hierarchically modular organization of brain networks. Front Neurosci. 2010;4:200. doi: 10.3389/fnins.2010.00200. [DOI] [PMC free article] [PubMed] [Google Scholar]
- 3.Bassett DS, et al. Efficient physical embedding of topologically complex information processing networks in brains and computer circuits. PLoS Comput Biol. 2010;6:e1000748. doi: 10.1371/journal.pcbi.1000748. [DOI] [PMC free article] [PubMed] [Google Scholar]
- 4.Felleman DJ, van Essen DC. Distributed hierarchical processing in the primate cerebral cortex. Cereb Cortex. 1991;1:1–47. doi: 10.1093/cercor/1.1.1-a. [DOI] [PubMed] [Google Scholar]
- 5.Treisman A. The binding problem. Curr Opin Neurobiol. 1996;6:171–178. doi: 10.1016/s0959-4388(96)80070-5. [DOI] [PubMed] [Google Scholar]
- 6.Tononi G, Sporns O, Edelman GM. A measure for brain complexity: Relating functional segregation and integration in the nervous system. Proc Natl Acad Sci USA. 1994;91:5033–5037. doi: 10.1073/pnas.91.11.5033. [DOI] [PMC free article] [PubMed] [Google Scholar]
- 7.Sporns O, Chialvo DR, Kaiser M, Hilgetag CC. Organization, development and function of complex brain networks. Trends Cogn Sci. 2004;8:418–425. doi: 10.1016/j.tics.2004.07.008. [DOI] [PubMed] [Google Scholar]
- 8.Watts D, Strogatz S. Collective dynamics of ‘small-world’ networks. Nature. 1998;393:440–442. doi: 10.1038/30918. [DOI] [PubMed] [Google Scholar]
- 9.Bassett DS, Bullmore ET. Small-world brain networks. Neuroscientist. 2006;12:512–523. doi: 10.1177/1073858406293182. [DOI] [PubMed] [Google Scholar]
- 10.He Y, Chen ZJ, Evans AC. Small-world anatomical networks in the human brain revealed by cortical thickness from MRI. Cereb Cortex. 2007;17:2407–2419. doi: 10.1093/cercor/bhl149. [DOI] [PubMed] [Google Scholar]
- 11.Eguiluz VM, Chialvo DR, Cecchi GA, Baliki M, Apkarian AV. Scale-free brain functional networks. Phys Rev Lett. 2005;94:018102. doi: 10.1103/PhysRevLett.94.018102. [DOI] [PubMed] [Google Scholar]
- 12.Achard S, Salvador R, Whitcher B, Suckling J, Bullmore ET. A resilient, low-frequency, small-world human brain functional network with highly connected association cortical hubs. J Neurosci. 2006;26:63–72. doi: 10.1523/JNEUROSCI.3874-05.2006. [DOI] [PMC free article] [PubMed] [Google Scholar]
- 13.Achard S, Bullmore ET. Efficiency and cost of economical brain functional networks. PLoS Comput Biol. 2007;3:e17. doi: 10.1371/journal.pcbi.0030017. [DOI] [PMC free article] [PubMed] [Google Scholar]
- 14.Hagmann P, et al. Mapping human whole-brain structural networks with diffusion MRI. PLoS One. 2007;2:e597. doi: 10.1371/journal.pone.0000597. [DOI] [PMC free article] [PubMed] [Google Scholar]
- 15.Song S, Sjostrom PJ, Reigl M, Nelson S, Chklovskii DB. Highly nonrandom features of synaptic connectivity in local cortical circuits. PLoS Biol. 2005;3:e68. doi: 10.1371/journal.pbio.0030068. [DOI] [PMC free article] [PubMed] [Google Scholar]
- 16.Yu S, Huang D, Singer W, Nikolic D. A small world of neuronal synchrony. Cereb Cortex. 2008;18:2891–2901. doi: 10.1093/cercor/bhn047. [DOI] [PMC free article] [PubMed] [Google Scholar]
- 17.Stam CJ, Jones BF, Nolte G, Breakspear M, Scheltens P. Small-world networks and functional connectivity in Alzheimer’s disease. Cereb Cortex. 2007;17:92–99. doi: 10.1093/cercor/bhj127. [DOI] [PubMed] [Google Scholar]
- 18.Ravasz E, Somera AL, Mongru DA, Oltvai ZN, Barabási A-L. Hierarchical organization of modularity in metabolic networks. Science. 2002;297:1551–1555. doi: 10.1126/science.1073374. [DOI] [PubMed] [Google Scholar]
- 19.Girvan M, Newman MEJ. Community structure in social and biological networks. Proc Natl Acad Sci USA. 2002;99:7821–7826. doi: 10.1073/pnas.122653799. [DOI] [PMC free article] [PubMed] [Google Scholar]
- 20.Fortunato S. Community detection in graphs. Phys Rep. 2010;486:75–174. [Google Scholar]
- 21.Song C, Havlin S, Makse HA. Self-similarity of complex networks. Nature. 2005;433:392–395. doi: 10.1038/nature03248. [DOI] [PubMed] [Google Scholar]
- 22.Song C, Havlin S, Makse HA. Origins of fractality in the growth of complex networks. Nat Phys. 2006;2:275–281. [Google Scholar]
- 23.Goh KI, Salvi G, Kahng B, Kim D. Skeleton and fractal scaling in complex networks. Phys Rev Lett. 2006;96:018701. doi: 10.1103/PhysRevLett.96.018701. [DOI] [PubMed] [Google Scholar]
- 24.Radicchi F, Ramasco JJ, Barrat A, Fortunato S. Complex networks renormalization: Flows and fixed points. Phys Rev Lett. 2008;101:148701. doi: 10.1103/PhysRevLett.101.148701. [DOI] [PubMed] [Google Scholar]
- 25.Rozenfeld HD, Song C, Makse HA. The small world-fractal transition in complex networks: A renormalization group approach. Phys Rev Lett. 2010;104:025701. doi: 10.1103/PhysRevLett.104.025701. [DOI] [PubMed] [Google Scholar]
- 26.Gallos LK, Song C, Havlin S, Makse HA. Scaling theory of transport in complex biological networks. Proc Natl Acad Sci USA. 2007;104:7746–7751. doi: 10.1073/pnas.0700250104. [DOI] [PMC free article] [PubMed] [Google Scholar]
- 27.Galvao V, et al. Modularity map of the human cell differentiation network. Proc Natl Acad Sci USA. 2010;107:5750–5755. doi: 10.1073/pnas.0914748107. [DOI] [PMC free article] [PubMed] [Google Scholar]
- 28.Bunde A, Havlin S, editors. Fractals and Disordered Systems. 2nd Ed. Heidelberg: Springer-Verlag; 1996. [Google Scholar]
- 29.Bollobás B. Random Graphs. London: Academic; 1985. [Google Scholar]
- 30.Granovetter MS. The strength of weak ties. Am J Sociol. 1973;78:1360–1380. [Google Scholar]
- 31.Onnela J-P, et al. Structure and tie strengths in mobile communication networks. Proc Natl Acad Sci USA. 2007;104:7332–7336. doi: 10.1073/pnas.0610245104. [DOI] [PMC free article] [PubMed] [Google Scholar]
- 32.Tononi G, Edelman GM. Consciousness and complexity. Science. 1998;282:1846–1851. doi: 10.1126/science.282.5395.1846. [DOI] [PubMed] [Google Scholar]
- 33.Baars BJ. In the Theater of Consciousness: The Workspace of the Mind. New York: Oxford Univ Press; 1997. [Google Scholar]
- 34.Pashler H. Dual-task interference in simple tasks: Data and theory. Psychol Bull. 1994;116:220–220. doi: 10.1037/0033-2909.116.2.220. [DOI] [PubMed] [Google Scholar]
- 35.Sigman M, Dehaene S. Brain mechanisms of serial and parallel processing during dual-task performance. J Neurosci. 2008;28:7585–7598. doi: 10.1523/JNEUROSCI.0948-08.2008. [DOI] [PMC free article] [PubMed] [Google Scholar]
- 36.Sigman M, Jobert A, Dehaene S. Parsing a sequence of brain activations of psychological times using fMRI. Neuroimage. 2007;35:655–668. doi: 10.1016/j.neuroimage.2006.05.064. [DOI] [PubMed] [Google Scholar]
- 37.Salvador R, et al. Neurophysiological architecture of functional magnetic resonance images of human brain. Cereb Cortex. 2005;15:1332–1342. doi: 10.1093/cercor/bhi016. [DOI] [PubMed] [Google Scholar]
- 38.Stanley HE. Introduction to Phase Transitions and Critical Phenomena. Oxford: Oxford Univ Press; 1971. [Google Scholar]
- 39.Zylberberg A, Dehaene S, Roelfsema PR, Sigman M. The human Turing machine: A neural framework for mental programs. Trends Cogn Sci. 2011;15:293–300. doi: 10.1016/j.tics.2011.05.007. [DOI] [PubMed] [Google Scholar]
- 40.Duncan J. The multiple-demand (MD) system of the primate brain: Mental programs for intelligent behaviour. Trends Cogn Sci. 2010;14:172–179. doi: 10.1016/j.tics.2010.01.004. [DOI] [PubMed] [Google Scholar]
- 41.Song C, Gallos LK, Havlin S, Makse HA. How to calculate the fractal dimension of a complex network: The box covering algorithm. J Stat Mech. 2007 P03006. [Google Scholar]
- 42.Barabási A-L, Albert R. Emergence of scaling in random networks. Science. 1999;286:509–512. doi: 10.1126/science.286.5439.509. [DOI] [PubMed] [Google Scholar]
- 43.Gallos LK, Song C, Makse HA. Scaling of degree correlations and its Influence on diffusion in scale-free networks. Phys Rev Lett. 2008;100:248701. doi: 10.1103/PhysRevLett.100.248701. [DOI] [PubMed] [Google Scholar]
- 44.Kleinberg J. Navigation in a small world. Nature. 2000;406:845. doi: 10.1038/35022643. [DOI] [PubMed] [Google Scholar]
- 45.Li G, et al. Towards design principles for optimal transport networks. Phys Rev Lett. 2010;104:018701. doi: 10.1103/PhysRevLett.104.018701. [DOI] [PubMed] [Google Scholar]
- 46.Bianconi G, Pin P, Marsili M. Assessing the relevance of node features for network structure. Proc Natl Acad Sci USA. 2009;106:11433–11438. doi: 10.1073/pnas.0811511106. [DOI] [PMC free article] [PubMed] [Google Scholar]
- 47.Cowey A. Cortical maps and visual perception: The Grindley Memorial Lecture. Q J Exp Psychol. 1979;31:1–17. doi: 10.1080/14640747908400703. [DOI] [PubMed] [Google Scholar]
- 48.Linsker R. From basic network principles to neural architecture: Emergence of spatial-opponent cells. Proc Natl Acad Sci USA. 1986;83:7508–7512. doi: 10.1073/pnas.83.19.7508. [DOI] [PMC free article] [PubMed] [Google Scholar]
- 49.Mitchison G. Neuronal branching patterns and the economy of cortical wiring; Proc Biol Sci; 1991. pp. 151–158. [DOI] [PubMed] [Google Scholar]
- 50.Cherniak C. Neural component placement. Trends Neurosci. 1995;18:522–527. doi: 10.1016/0166-2236(95)98373-7. [DOI] [PubMed] [Google Scholar]
- 51.Chklovskii DB. Optimal sizes of dendritic and axonal arbors in a topographic projection. J Neurophysiol. 2000;83:2113–2119. doi: 10.1152/jn.2000.83.4.2113. [DOI] [PubMed] [Google Scholar]
- 52.Stanley HE. Scaling, universality, and renormalization: Three pillars of modern critical phenomena. Rev Mod Phys. 1999;71:S358–S366. [Google Scholar]
- 53.Raichle ME, et al. A default mode of brain function. Proc Natl Acad Sci USA. 2001;98:676–682. doi: 10.1073/pnas.98.2.676. [DOI] [PMC free article] [PubMed] [Google Scholar]
Associated Data
This section collects any data citations, data availability statements, or supplementary materials included in this article.