

Abstract
Highly multiplexed assays using antibody coated, fluorescent (xMap) beads are widely used to measure quantities of soluble analytes, such as cytokines and antibodies in clinical and other studies. Current analyses of these assays use methods based on standard curves that have limitations in detecting low or high abundance analytes. Here we describe SAxCyB (Significance Analysis of xMap Cytokine Beads), a method that uses fluorescence measurements of individual beads to find significant differences between experimental conditions. We show that SAxCyB outperforms conventional analysis schemes in both sensitivity (low fluorescence) and robustness (high variability) and has enabled us to find many new differentially expressed cytokines in published studies.
Keywords: ELISA, Luminex, algorithm, sandwich immunoassay, ANOVA
In recent years the xMap bead technology (1) has made possible high throughput analysis of various analytes, especially cytokines. These assays allow simultaneous analysis of more than 50 different cytokines in small sample volumes. The focus of the present work is on analysis of these cytokine assays. The xMap bead is the solid phase of a sandwich immunoassay. The analyte is classified through a two-color barcode embedded in the bead and the abundance of the analyte on the bead is determined by the fluorescence of the dye phycoerythrin coupled to the detection antibodies. Measured levels of fluorescence from the known cytokine dilutions are used to create standard curves. These four or five parameter logistic curves are used to estimate the concentrations of analytes given their median fluorescence intensity (MFI) values.
Currently statistical analysis of xMap cytokine assays relies on repeat wells done in the assay and point estimators, usually the concentrations transformed from the MFIs, for each analyte within each well. This approach works well when a large difference exists and where coefficients of variation are fairly small. However, it is the nature of screening assays that many analytes have low fluorescence values and are therefore often reported as undetected. These undetected values lead to gaps in the assay results and frequent inaccuracies in estimates of analyte concentration.
We present here a unique statistical approach for the analysis of xMap cytokine data. Given the fluorescence of individual beads, we chose not to map the observed fluorescence to the unknown concentration level, as it adds uncertainty. Instead, we focused on a direct statistical analysis of fluorescence intensities (FIs). The use of individual bead fluorescence, as opposed to any summary number, enables analysis of low signal or poor quality data and allows more power to testing differences in analytes. The methodology, which we refer to as Statistical Analysis of xMap Cytokine Beads (SAxCyB), is a linear regression model designed to find significant differences between multiple conditions (see schematic in Fig. 1A). In the model, repeat wells of a common condition are combined after adjusting differences. Conditions of interest (henceforth referred to as cases) simultaneously compared to the reference conditions (henceforth controls) after taking a variance-stabilizing transform. Fig. 1B visualizes the method’s application to experimental data over different variances of case and control. Comparisons are made through a type of hypothesis testing that allows for some tolerance for the precision of the measurement, which is determined in a data-driven manner. We show that SAxCyB outperforms alternative analysis methods with a specificity/sensitivity analysis. We also show specific applications of SAxCyB to data in mice infection and autoimmunity and a clinical trial and show that in all cases the algorithm is able to find additional cytokines that change in a given disease situation.
Fig. 1.

Illustration of the SAxCyB method and its application. (A) A schematic flow chart showing data processing, repeat adjustment, transformation, D selection, and hypothesis testing. (B) Application of SAxCyB for experiments with different variances. Colored arrows point to extreme outliers.
Results
Construction of the SAxCyB Model.
Multiplex flow cytometers measure multiple beads per analyte, however they typically only report mean or median values. In order to achieve better statistical power, it should be advantageous to use all of the fluorescence measurements. However, upon examining individual bead fluorescence data of xMap cytokine assays (as obtained with Luminex machines, Luminex Inc.) we observed that they usually have a highly nonnormal distribution (Fig. S1) and their variances differ with different conditions (Fig. S2). At lower fluorescence levels these phenomena are due in part to a background subtraction feature that allows multiplexed no-wash assays but as a byproduct, introduce abnormally high variances (2). For these reasons, analyses based on t-statistics applied to MFIs are inappropriate for finding significant differences between samples (SI Text). Therefore we decided to create a methodology which incorporates the heavy-tailed distribution, the high variability of the data, and also background (blank) measurements.
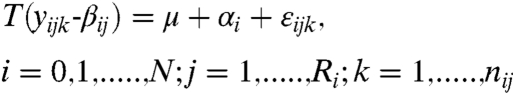
This method is based on a linear model applied for each analyte. In this model we use the measured fluorescence (y), adjusted for differences in repeats (β). We then wish to learn about the differences between conditions (α) given the overall mean (μ) and some error (ε).
Let i index treatment; j indexes repeat for treatment i; and k indexes bead for treatment i within repeat j. With measured fluorescence intensity (FI) yijk, we write
 |
[1] |
where N is the number of conditions; Ri is the number of repeats for condition i; and nij is the number of beads for condition i within replicate j·μ is the overall mean. {αi} are the differences between condition i and the control (which is our main interest). Inference on {αi} seek to answer the experimental question. {βij} represent the differences among the repeats for condition I. {εijk} are the errors in the model that are independent and such that E(εijk) = 0 and 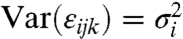 . We assume that the FI measurements adjusted for the repeat effect follow an Analysis of Variance (ANOVA) model and in order to stabilize the variability of FI we use a monotone log transform T(·) (See SI Text) that is similar to the transform used in microarray probe-level analysis (3). We empirically found this transform to yield good performance across the scale of possible measurements. We then estimate the model parameters in an iterative fashion, using a variant of the least squares method (See SI Text).
Hypothesis Testing Using SAxCyB.
Our goal is to determine significance of differences found between conditions. In order to do that, we use a data adaptive bioequivalence-type test. In testing multiple cases against one control, our null hypothesis is that the cases are equivalent to the control:
| [2] |
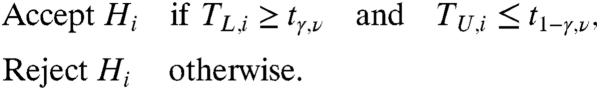
where Δ is the equivalence margin of the test. A higher Δ corresponds to more tolerance to a difference between αi and α0. Setting the margin Δ = 0 reduces Eq. 2 to a conventional t-test. The value of Δ is selected in a data-adaptive fashion (SI Text and Fig. S7). Each hypothesis Hi Eq. 2 can be tested using two one-sided t-tests (4), resulting in a decision rule
 |
[3] |
Where the t statistics  and
and 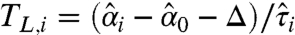 are the lower and the upper boundaries of the equivalence margin, obtained from the data. The critical values tγ,ν and t1-γ,ν are 100 × γ% and 100 × (1-γ)% quantiles of the t-distribution with ν degrees of freedom. Here,
  and
and  are the estimated effects of the case and the control, and si is the estimated normal theory standard deviation of their difference
  . These values are obtained from fitting the linear model Eq. 1 to data. Because this decision rule reports two p-values, we use the following composite p-value-like score
where Fν(t) is the probability that a random variable following the t-distribution with ν degrees of freedom is less than t.
We also want to know which of the differences found are significant. We note that, when testing all the hypotheses simultaneously, the rate of false positives (type I error) inflates. We used the above testing procedures followed by a post hoc adjustment for controlling family-wise error rate (5). We also allow the false discovery rate control (6) at the user’s discretion for cases in which the number of comparisons is large (e.g., N greater than 20). When there are multiple controls each of which has multiple cases, we simply repeat testing Eq. 2 independently for each case-control group.
Assessment of SAxCyB Performance.
The principal use of the SAxCyB algorithm is as a decision rule. The performance of decision rules for comparing samples can be evaluated by measuring the true positive rate (TPR, or sensitivity) and the false positive rate (FPR, or 1-specificity). In order to determine the performance of SAxCyB, we conducted an experiment in which we measured assay standards (used to generate the standard curve) because they are the most accurate sources of known amounts of cytokines for Luminex assays. We then performed seven fourfold serial dilutions of assay standards (for human cytokines) in seven repeats each. The resulting cytokine concentrations (or instances) range from saturation (5,000 pg/mL) to the lower detection limit (1.22 pg/mL). We also included blank wells with sample buffer only.
For our analysis we created a set of in-silico experiments. Each in-silico experiment consists of two components (Fig. 2A). First, to estimate FPR, we randomly designated a pair of repeats from one instance as control and two randomly chosen other pairs as cases (Fig. 2A, top). Because both control and cases came from the same instance, we expect not to reject the null hypothesis (that they are not significantly different). Second, to estimate TPR, we designated three random pairs of repeats from another instance as cases (Fig. 2A, bottom). We did this for all six instances other than the control. Because the control and cases came from different instances, we expect to reject the null hypothesis.
Fig. 2.

SAxCyB performs better than conventional analysis methods. (A) Evaluation of SAxCyB using diluted standard analytes. When comparing within the same concentration (e.g., 100 pg/mL), significant differences are false positive. When comparing between concentrations (e.g., 100 pg/mL and 50 pg/mL), significant differences are true positives. (B) False Positive Rates and True Positive Rates were estimated per analyte for SAxCyB (red circles) and alternative methods t_fullFI (blue crosses) and t_MFI (green triangles). All data were adjusted for multiple comparisons. Solid vertical line—nominal significance level; 0.05. Dashed vertical line -0.10. The inset shows an example of differences in transformed fluorescence (α from Eq. 1) between various concentrations of IL-12p40. For each pane, the reference is labeled in the center of each pane and all fluorescence differences of the cases (which compare to it) including the reference itself are plotted in different colors. For example, in the top pane the control is 1.2 pg/mL and distributions of differences in transformed fluorescence for all other concentrations are plotted. Magnified view of the range around 0 is in Fig. S6.
We generated 315 analyses for each instance, yielding 630 true negatives and six groups of 945 true positives. We applied SAxCyB to test significant differences at nominal significance levels of 0.01 and 0.05, and counted false positives and true positives to estimate FPR and TPR respectively. We conducted this analysis for each of the 51 analytes (Table S1). As reference decision rules we used a two-sample t-test (“t_MFI”) that employs only MFIs (therefore two measurements for each instance) and a two-sample t-test (“t_fullFI”) that employs all bead measurements and pools repeats. The first reference is a common analysis method of xMap data and the second is a naïve use of all the individual bead measurements.
Pooled across the full scale of data, SAxCyB achieved higher TPR with lower FPR (Fig. 2B; data points clustered on the upper-left corner) than the other two reference decision rules. At the nominal level of 0.05, 50 out of 51 analytes had FPRs less than the nominal level; the remaining analyte had FPRs less than 0.1. At the 0.01 level, 48 analytes had FPRs less than the nominal level; the other three had FPRs less than 0.05 (Fig. S3). TPRs were very high for both levels: all of them were greater than 0.85, most of them were very close to 1. Naively using individual bead fluorescence (t_fullFI) also yielded high TPRs, but had much higher FPRs. At the level 0.05, all analytes had FPRs greater than 0.1; at 0.01, all FPRs were greater than 0.05. This effect can be a consequence of the heavy tails and/or the discrepant scales of FIs that usually degrades the performance of the two-sample t-test. SAxCyB overcomes this problem by adjusting the repeat effects and by variance-stabilizing transformation. As can be expected by the small number of data points, t_MFI had unacceptably low TPRs. Note that the demonstrated TPRs and FPRs may be optimistic. In real experiments with unknown analyte quantities the unobservable TPRs can be lower and FPRs higher.
SAxCyB Allows Detection of Low Level Analytes and Multiple Hypotheses Testing.
Measuring levels of analytes (cytokines in this case) more precisely and sensitively will allow researchers to find subtle differences that would otherwise remain undetected. Additionally, having good estimates on significance of all the data will allow pattern detection. In either case, this is a significant improvement over having no usable data at all, which is the case when concentrations cannot be estimated (on both sides of the standard curve).
In order to investigate the performance of SAxCyB in a variety of experimental settings, we analyzed data that has been published and validated in follow-up experiments. First, we analyzed Luminex data from sera of mice deficient for type I interferon receptor (IFNAR1-/-) that were infected with Francisella tularensis (7). In this experiment, using a Mann-Whitney U analysis, the authors identified four cytokines that were significantly different between IFNAR1-/- and WT mice 48 h after infection (IL-1α, IL-12p40, IL-12p70, and IL-17). This analysis pooled two repeats of the experiment for statistical power. Using SAxCyB we had enough power to analyze each experiment individually. Fig. 3A shows that we found 11 significantly different cytokines in each repeat of the experiment (p < 0.05). Of the 22 total differences, 16 were found with SAxCyB but not with t-tests on MFIs. In all, seven cytokines were common to both repeats (IL-12p70, IL-17, IL-3, IL-6, RANTES, MCP-1, and KC). The distribution of individual bead fluorescence values and transformed fluorescence values for IL-3 is shown in Fig. 3B. We note that the high samples with high MFIs (in IFNAR1-/- mice) actually have very high individual bead fluorescence values, up to four times the median for this group. In addition, we found seven cytokines that changed as a result of PBS injection, albeit to a smaller extent. Changes in these cytokines in the IFNAR1-/- settings may thus be a result of the strain differences rather than infection. Notably, we did not find IL-1α to be significantly different between the infected strains, owing to high background measurements (42% in MFI terms). We also found IL-12p40 to be significantly increased in one of two repeat experiments, but also slightly decreased in the PBS control.
Fig. 3.

SAxCyB used for mouse and human serum cytokines reveals new cytokine effects. (A) The effect of Francisella tularensis infection on serum cytokine expression was studied in IFNAR-/- and WT mice (11). Serum cytokines (23) were measured with Luminex in two repeat experiments and once for PBS-injection control. Data were analyzed by comparing the two strains with SAxCyB and t-tests on MFIs. SAxCyB returned 30 significantly different cytokines (sorted by significance). Of these, 24 were not detected by MFI t-tests (red bars). Asterisks denote findings that were also detected in PBS injection. (B) Fluorescence (top) and transformed fluorescence (bottom) measurements of individual beads for IL-3 (significantly overexpressed upon infection). Dots are MFI values. Green—WT mice, red—IFNAR-/- mice. (C) Sera from SJIA patients were taken on day zero (before) or month six after anakinra (IL-Ra) treatment. Serum cytokines (51 in two plexes of 24 and 27) were measured with Luminex. Data were analyzed by comparing 18 patients on day zero and 13 patients at month six to a cohort of 10 healthy donors’ sera. SAxCyB returned 17 and 20 significant differences for day zero and month six respectively (sorted by significance). Of those 13 were not detected by MFI t-tests (green and red bars for day zero and month six respectively). Asterisks denote findings that are found both at day zero and month six. (D) Fluorescence (top) and transformed fluorescence (bottom) measurements of individual beads for IL-1Ra (likely detecting the drug). Dots are MFI values. Blue—healthy controls, red—month six patients. (E) Fluorescence (top) and transformed fluorescence (bottom) measurements of individual beads for a representative selection of cytokines detected by SAxCyB, but not t-tests on MFIs. Blue—healthy controls, green—day zero patients, red—month six patients.
In (A) and (C) only statistically significant (p < 0.05) differences are plotted.
Where fluorescence or transformed fluorescence values are plotted (B, D, and E), the data were overlaid for each well separately such that denser colors represent more measurements for that range.
In conclusion we find that IL-3 is up-regulated in response to F. tularensis infection in IFNAR1-/- mice at 48 h and that this is not a result of the specific mouse strain used. In fact, when comparing infected vs. PBS injected mice for each strain, IL-3 is up-regulated only in IFNAR1-/- mice in both repeats (not shown). IL-3 is a mitogen, differentiation factor, and apoptosis inducer in a variety of hematopoietic cells. IL-3 perform these many functions by signaling through three pathways: JAK/STAT, MAPK, and PI3K (8). IL-3 is expressed by many cell types, including thymus, bone marrow, brain, muscle, kidney, liver, and others. However, there is conflicting evidence for its expression upon F. tularensis infection. Several reports have indicated that it is not detected in liver (9) and unchanged in sera of infected mice (10, 11) and in purified pulmonary T and NK cells following aerosol challenge (12). However Luminex analysis of pulmonary cytokines upon aerosol challenge of live vaccine strain of F. tularensis has shown that IL-3 is up-regulated as early as day four and peaks on day seven (13). In this study additional cytokines found to be up-regulated in the lung, but not in sera or spleen on day two. Those cytokines are IL-6 (40–55-fold), IL-17 (9–14-fold), KC (8–11-fold), MCP-1 (10–14-fold), and RANTES (2–4-fold). On day four many more cytokines were up-regulated in the lungs, spleens, and sera of infected mice. It is therefore possible that the 48 h time point chosen for this experiment represents the beginning of the IL-3 response. Finally, although the importance of IL-3 in immunity to the parasite Stronglyoides venezuelensis via its function in basophil development has been described (14), its role in immunity to intracellular pathogens such as F. tularensis is not known.
Making precise and sensitive measurements of blood analytes (such as cytokines) has clinical value. Although this assertion holds true for many clinical indications, it is especially important in immunological disorders. For example in the autoimmune condition systemic lupus erythematosus it is of diagnostic value to measure IL-1, IL-Ra, IL-2, soluble IL-2R (sCD25), IL-4, IL-6, IL-12, IL-18, TNFα, soluble TNF receptor (sTNFR), IFNγ and IFNα (15). In order to test SAxCyB in a clinical setting (where sample collection is more variable and more bead types are multiplexed together) we analyzed data from a clinical trial with the interleukin-1 receptor antagonist anakinra in patients with systemic-onset juvenile idiopathic arthritis (SJIA) (16). Pascual, et al. showed that sera from SJIA patients caused increase in IL-1 expression in healthy patients’ PBMCs in vitro (17). To test whether anakinra treatment changed the cytokine profile of patients, 51 serum cytokines were measured on day zero (before treatment), on month six during anakinra treatment and in healthy volunteers. We tested two hypotheses simultaneously, one comparing patients on day zero to healthy donors and another comparing patients after 6 mo of anakinra therapy to the same healthy donors. We find 17 significant differences (p < 0.05) in SJIA patients on day zero and 20 significant differences in SJIA patients after 6 mo of anakinra therapy (Fig. 3C). Of those, six cytokines (IL-16, IL-18, IL-6, IL-8, IL-9, and MIP-1β) are up-regulated at both time points, suggesting that their expression is a result of the disease rather than the therapy. Importantly we see very high levels of IL-1Ra in patients undergoing therapy; likely the assay is detecting the drug. This observation serves as an internal positive control for our analysis. SAxCyB finds 13 significant differences that are not detected using t-tests on MFIs, even without performing the required multiple comparison procedure on MFIs (MCP; to minimize type I error). These new findings demonstrate the much greater sensitivity of this algorithm. In order to have better insight into the individual bead data that yield these results, we plotted these individual bead fluorescence measurements for each sample as well as the transformed fluorescence data. Fig. 3D shows the extreme case of very large scale of the data and the effect of the transformation to stabilize variance in this situation. In Fig. 3E we explore more subtle differences unique to SAxCyB. It is important to note that the algorithm considers all the data as taken from one group, therefore a post hoc examination of the source of significance may be of value.
As the number of samples increases so does the power of t-tests with MFIs and those become more relevant. In this situation SAxCyB provides specificity by considering all the bead measurements to estimate the true variance in the data. For this reason 12 cytokines were reported as significantly different by MFI t-tests but not by SAxCyB (Fig. S4).
It is interesting to note some findings that are made using SAxCyB and not with MFIs. Because the function of the drug is to block IL-1α/β binding to the IL-1RI receptor, we would expect to find more available IL-1α and IL-1β in the serum. With SAxCyB, IL-1α and IL-1β are both found to be overexpressed in patients undergoing anakinra treatment (compared to healthy donors, Fig. 3 B and E). We thus find a secondary effect of the drug that supports its bioactivity. However in this study SJIA patients do not overexpress IL-1α on day zero. IL-18 is also overexpressed in SJIA patients both at day zero and month six. IL-18 is a proinflammatory cytokine that is released as a result of inflammasome activation and caspase 1 cleavage. This process inevitably also cleaves pro-IL-1β and results in secretion of mature IL-1β. Therefore, the presence of IL-18 in the sera of SJIA patients on day zero supports the theory that the inflammasome plays a role in the disease (18–20). However the continued presence of IL-18 on month six shows that it is not affected by the drug, as expected. The presence of IL-1β as detected with SAxCyB further supports a role for the inflammasome in SJIA. The antigen that causes inflammasome activation in SJIA is unknown, however it is known that self adjuvants can induce the NLRP3 inflammasome (21, 22), for example uric acid in gout (23). A pathogenic role for the inflammasome has also been described in osteoarthritis and correlated with serum levels of IL-1β and IL-18 (24). In this work we show, via a direct measurement, that IL-1b is elevated in sera from SJIA patients.
Finally we used SAxCyB in an experiment where multiple (thirty eight) hypotheses were tested in a cytokine stimulation assay and show that it achieves much greater sensitivity than MFI-based t tests (Fig. S5).
Discussion
In conclusion, here we describe SAxCyB, a statistical algorithm that uses the individual fluorescence measurements of xMap beads and significantly improves the sensitivity and accuracy of this type of analysis. Improving multiplex cytokine analysis in this way is particularly important because this type of assay is becoming increasingly common as a way to understand immune responses to infectious diseases or the pathologies associated with autoimmunity (or drug treatments for those diseases). SAxCyB is a fixed effects model, where the effect of a treatment is considered nonrandom. One might argue that we should think of this quantity as a random variable (which follows a certain distribution). However, this approach is more appropriate in making inference on all possible future assays, whereas our interest is in explaining an observed, particular assay. Also, one may argue that the intrinsic problem of comparison here is that of comparing concentrations. Given the estimated standard curve, comparisons are formulated as what in statistics is known as “calibration,” which has generated much heat and only a little light even in the simplest case of linear standard curves (23, 24). Given that the proper scale is uncertain and there is replication, we recommend avoiding calibration as much as possible. Third, we advocate the use of a multiple comparison procedure (MCP) when comparing a control to many cases. Use of MCP not only reduces inflation in the type I error (FPR), but also makes a decision rule for significant differences more or less immune to the nominal significance level. For example, in the sensitivity analysis from the previous section, we observed that as the nominal level is decreased from 0.05 to 0.01, the t_MFI, unadjusted for MCP, showed a dramatic reduction in TPR (Fig. S3). This phenomenon indicates that t_MFI yields many marginal unadjusted p-values around 0.05, severely affected by the change of nominal level or multiple comparison adjustment.
Finally, in performing many Luminex xMap assays, we find that there is greater variation in biological repeats than in technical repeats. Because repeats are crucial in order to estimate variability and thus achieve greater sensitivity, we highly recommend performing repeats of experiments rather than technical repeats, thereby optimizing the cost effectiveness of the assay. In addition, we find that plate-to-plate variations can be substantial even if the experimental protocol is strictly adhered to and the same batches of reagents are used. These variations may represent stochastic effects or small, yet significant, deviations that are common in lab work. We therefore highly recommend assaying the control samples in the same plate as the experimental samples. This design should be implemented even at the cost of repeatedly assaying the control on every plate.
We hope that this method will be useful for those making these kinds of measurements. While this approach was developed using Luminex cytokine assays, it can be easily extended to all xMap assays because the common denominators of conjugated beads and fluorescence readouts are the same.
Methods
Mice.
All mice were obtained from Jackson laboratories and were maintained in the Stanford research animal facility according to IACUC (Institutional Animal Care and Use Committee) guidelines.
Luminex Assays.
For the mouse cytokine experiment, CD4 T cells from two strains of mice, Fas-/- (MRL.MpJ.lpr) and WT (MRL.MpJ) were stimulated for 16 h with subsequent blocking of golgi-mediated secretion. The cells were lysed and intracellular cytokines were measured by Luminex using mouse 21 plex beads. The SAxCyB performance experiment was done using a human 51 plex setup.
All Luminex experiments were performed by the Stanford Human Immune Monitory Center using Panomics beads and Luminex 100 IS or Luminex 200 machines.
Exclusion of Outliers.
Extreme outlying measurements can occur due to contributions of carryover beads from previous wells (27). We excluded outliers in the measured FIs from the analysis. FI measurements greater than 5% trimmed mean plus four times standard deviation (also 5% trimmed) were considered outliers. This procedure was done for all methods compared in this text.
Computational Resources.
Statistical analyses were performed with the R statistics package and MATLAB 2007a/2009 ran on 8-core x86-64 GNU/Linux server and on a Windows XP workstation, respectively.
Supplementary Material
Acknowledgments.
We thank Y. Rosenberg-Hasson, I. Herschmann, H. T. Maecker, and members of the Institute for Immunity, Transplantation and Infection and the Stanford Human Immune Monitoring Center for support with the Luminex experiments; M. Coram, L. Tian, C. Sabatti, and B.A. Kidd for enlightening discussions; and B. Narasimhan for computer support. We thank V. Pascual, D. Monack and H. Thomas for providing their published data and for helpful discussions. J.-H.W. and R.A.O. are supported by the US National Institutes of Health (NIH) (MERIT Award R37EB02784). J.-H.W. was also supported by Dean’s Postdoctoral Fellowship of Stanford Medical School. M.M.D. was supported by grants from the NIH (AI057229 and AI09040) and the Howard Hughes Medical Institute. O.G. was supported by NIH Grant AI057229.
Footnotes
The authors declare no conflict of interest.
*This Direct Submission article had a prearranged editor.
This article contains supporting information online at www.pnas.org/lookup/suppl/doi:10.1073/pnas.1112599109/-/DCSupplemental.
References
- 1.Kellar KL, et al. Multiplexed fluorescent bead-based immunoassays for quantitation of human cytokines in serum and culture supernatants. Cytometry. 2001;45:27–36. doi: 10.1002/1097-0320(20010901)45:1<27::aid-cyto1141>3.0.co;2-i. [DOI] [PubMed] [Google Scholar]
- 2.Jacobson JW, Oliver KG, Weiss C, Kettman J. Analysis of individual data from bead-based assays (“bead arrays”) Cytometry Part A. 2006;69A:384–390. doi: 10.1002/cyto.a.20293. [DOI] [PubMed] [Google Scholar]
- 3.Bolstad BM, Irizarry RA, Astrand M, Speed TP. A comparison of normalization methods for high density oligonucleotide array data based on variance and bias. Bioinformatics. 2003;19:185–193. doi: 10.1093/bioinformatics/19.2.185. [DOI] [PubMed] [Google Scholar]
- 4.Schuirmann DJ. A comparison of the two one-sided tests procedure and the power approach for assessing the equivalence of average bioavailability. J Pharmacokinet Phar. 1987;15:657–680. doi: 10.1007/BF01068419. [DOI] [PubMed] [Google Scholar]
- 5.Holm S. A simple sequentially rejective multiple test procedure. Scand J Stat. 1979;6:65–70. [Google Scholar]
- 6.Benjamini Y, Hochberg Y. Controlling the false discovery rate: a practical and powerful approach to multiple testing. J R Stat Soc B. 1995;57:289–300. [Google Scholar]
- 7.Henry T, et al. Type I IFN signaling constrains IL-17A/F secretion by gammadelta T cells during bacterial infections. J Immunol. 2010;184:3755–3767. doi: 10.4049/jimmunol.0902065. [DOI] [PMC free article] [PubMed] [Google Scholar]
- 8.Martinez-Moczygemba M, Huston DP. Biology of common beta receptor-signaling cytokines: IL-3, IL-5, and GM-CSF. J Allergy Clin Immun. 2003;112:653–665. doi: 10.1016/S0091. [DOI] [PubMed] [Google Scholar]
- 9.Golovliov I, Sandström G, Ericsson M, Sjöstedt A, Tärnvik A. Cytokine expression in the liver during the early phase of murine Tularemia. Infect Immun. 1995;63:534–538. doi: 10.1128/iai.63.2.534-538.1995. [DOI] [PMC free article] [PubMed] [Google Scholar]
- 10.Conlan JW, et al. Molecular immunology of experimental primary Tularemia in mice infected by respiratory or intradermal routes with type A Francisella tularensis. Mol Immunol. 2008;45:2962–2969. doi: 10.1016/j.molimm.2008.01.022. [DOI] [PMC free article] [PubMed] [Google Scholar]
- 11.Huntley JF, et al. Native outer membrane proteins protect mice against pulmonary challenge with virulent type A Francisella tularensis. Infect Immun. 2008;76:3664–3671. doi: 10.1128/IAI.00374-08. [DOI] [PMC free article] [PubMed] [Google Scholar]
- 12.Markel G, et al. The involvement of IL-17A in the murine response to sub-lethal inhalational infection with Francisella tularensis. PloS one. 2010;5:e11176. doi: 10.1371/journal.pone.0011176. [DOI] [PMC free article] [PubMed] [Google Scholar]
- 13.Shen H, et al. Molecular immune responses to aerosol challenge with Francisella tularensis in mice inoculated with live vaccine candidates of varying efficacy. PloS one. 2010;5:e13349. doi: 10.1371/journal.pone.0013349. [DOI] [PMC free article] [PubMed] [Google Scholar]
- 14.Lantz CS, et al. Role for interleukin-3 in mast-cell and basophil development and in immunity to parasites. Nature. 1998;392:90–93. doi: 10.1038/32190. [DOI] [PubMed] [Google Scholar]
- 15.Suh C-H, Kim H-A. Cytokines and their receptors as biomarkers of systemic lupus erythematosus. Expert Rev Mol Diagn. 2008;8:189–198. doi: 10.1586/14737159.8.2.189. [DOI] [PubMed] [Google Scholar]
- 16.Quartier P, et al. A multicentre, randomised, double-blind, placebo-controlled trial with the interleukin-1 receptor antagonist anakinra in patients with systemic-onset juvenile idiopathic arthritis (ANAJIS trial) Ann Rheum Dis. 2011;70:747–754. doi: 10.1136/ard.2010.134254. [DOI] [PMC free article] [PubMed] [Google Scholar]
- 17.Pascual V, Allantaz F, Arce E, Punaro M, Banchereau J. Role of interleukin-1 (IL-1) in the pathogenesis of systemic onset juvenile idiopathic arthritis and clinical response to IL-1 blockade. J Exp Med. 2005;201:1479–1486. doi: 10.1084/jem.20050473. [DOI] [PMC free article] [PubMed] [Google Scholar]
- 18.Maeno N, et al. Highly elevated serum levels of interleukin-18 in systemic juvenile idiopathic arthritis but not in other juvenile idiopathic arthritis subtypes or in Kawasaki disease: comment on the article by Kawashima et al. Arthritis Rheum. 2002;46:2539–2541. doi: 10.1002/art.10389. [DOI] [PubMed] [Google Scholar]
- 19.Lotito APN, Campa A, Silva CAA, Kiss MHB, Mello SBV. Interleukin 18 as a marker of disease activity and severity in patients with juvenile idiopathic arthritis. J Rheumatol. 2007;34:823–830. [PubMed] [Google Scholar]
- 20.Lachmann HJ, Quartier P, So A, Hawkins PN. The emerging role of interleukin-1β in autoinflammatory diseases. Arthritis Rheum. 2011;63:314–324. doi: 10.1002/art.30105. [DOI] [PubMed] [Google Scholar]
- 21.Ghaemi-Oskouie F, Shi Y. The role of uric acid as an endogenous danger signal in immunity and inflammation. Current Rheumatology Reports. 2011;13:160–166. doi: 10.1007/s11926-011-0162-1. [DOI] [PMC free article] [PubMed] [Google Scholar]
- 22.Yamasaki K, et al. NLRP3/cryopyrin is necessary for interleukin-1beta (IL-1beta) release in response to hyaluronan, an endogenous trigger of inflammation in response to injury. J Biol Chem. 2009;284:12762–12771. doi: 10.1074/jbc.M806084200. [DOI] [PMC free article] [PubMed] [Google Scholar]
- 23.Ray K. Crystal arthritis: NLRP3 inflammasome mediates crystal-induced joint inflammation and dysfunction. Nat Rev Rheumatology. 2011;7:684. doi: 10.1038/nrrheum.2011.164. [DOI] [PubMed] [Google Scholar]
- 24.Denoble AE, et al. Uric acid is a danger signal of increasing risk for osteoarthritis through inflammasome activation. Proc Nat’l Acad Sci USA. 2011;108:2088–2093. doi: 10.1073/pnas.1012743108. [DOI] [PMC free article] [PubMed] [Google Scholar]
- 25.Fieller EC. Some problems in interval estimation. J R Stat Soc B. 1954;16:175–185. [Google Scholar]
- 26.Creasy MA. Limits for the ratio of means. J R Stat Soc B. 1954;16:186–194. [Google Scholar]
- 27.Hanley B. Variance in multiplex suspension array assays: carryover of microspheres between sample wells. Journal of Negative Results in BioMedicine. 2007;6:6. doi: 10.1186/1477-5751-6-6. [DOI] [PMC free article] [PubMed] [Google Scholar]
Associated Data
This section collects any data citations, data availability statements, or supplementary materials included in this article.