Abstract
The molecular nature of transducin-α subunits (Gαt) may contribute to the distinct physiology of cone and rod photoreceptors. Biochemical properties of mammalian cone Gαt2-subunits and their differences with rod Gαt1 are largely unknown. Here, we examined properties of chimeric Gαt2 in comparison with its rod counterpart. The key biochemical difference between the rod- and cone-like Gαt was ~10-fold higher intrinsic nucleotide exchange on the chimeric Gαt2. Presented mutational analysis suggests that weaker interdomain interactions between the GTPase (Ras-like) domain and the helical domain in Gαt2 are in part responsible for its increased spontaneous nucleotide exchange. However, the rates of R*-dependent nucleotide exchange of chimeric Gαt2 and Gαt1 were equivalent. Furthermore, chimeric Gαt2 and Gαt1 exhibited similar rates of intrinsic GTPase activity as well as similar acceleration of GTP hydrolysis by the RGS domain of RGS9. Our results suggest that the activation and inactivation properties of cone and rod Gαt–subunits in an in vitro reconstituted system are comparable.
The two types of photoreceptors in the vertebrate retina, rods and cones, mediate vision at dim and bright light, respectively. Cones produce small rapidly-decaying responses and are much less sensitive to light than rods. The molecular basis for the differences in physiology of rods and cones are poorly understood. The phototransduction cascades in rods and cones utilize homologous components including visual pigments, heterotrimeric G proteins (transducins), and cGMP-phosphodiesterases (PDE6) (1–3). In rods, a robust amplification in the signaling cascade is achieved due to a high rate of transducin activation by photolyzed rhodopsin (Meta II or R*) and rapid hydrolysis of cGMP by transducin-activated PDE6. Consistent with the low sensitivity of cones, the signal amplification in mouse cone phototransduction was found to be lower (4). The molecular differences between major cone and rod signaling proteins have been examined as a probable origin of the physiological differences (5–9). Current evidence does not implicate the signaling properties of rod and cone visual pigments. Expression of rhodopsin and red cone pigment in Xenopus cones and rods, respectively, yielded responses identical to those of native Xenopus photoreceptors (5). Recent physiological analysis points to an important role of transducin α-subunits in shaping specific photoresponses (7). Rods of GNAT2C transgenic mice with substitution of rod Gαt1 for cone Gαt2 displayed decreased sensitivity, reduced rate of activation, and accelerated recovery characteristic of cone photoreceptors (7). Reduced rate of cascade activation may result from a slower rate of R*-dependent activation of the Gαt2 complex with rod-specific Gβ1γ1 or less efficient activation of PDE6 by Gαt2 (10). Accelerated recovery of GNAT2C rods suggests faster GTP hydrolysis in the transition complex of Gαt2 with PDE6 and the RGS9-1 GTPase accelerating protein (GAP) complex (11). Thus, Gαt2 may have a higher intrinsic rate of GTP hydrolysis and/or a greater GTPase potentiation by the GAP complex than Gαt1.
In contrast to well-characterized rod Gαt1, biochemical properties of Gαt2 have not been investigated. Native Gαt1 is readily available for biochemical analyses, whereas the sparsity of cones in mammalian retina impedes isolation of native Gαt2. In addition, a wealth of information about Gαt1 properties, including its interaction with R*, PDE6 and RGS9, was developed using robust bacterial expression of transducin-like Gαt1/Gαi1 chimeras (12–14). Here, we applied a chimera approach to analyze key signaling properties of Gαt2. A Gαt2/Gαi1 chimera (Gαt2′) was produced and investigated in comparison to analogous Gαt1/Gαi1 chimera Chi8 (13), termed hereafter Gαt1′. Gαt2′ and Gαt1′ are ~94% identical to Gαt2 and Gαt1, respectively, which is significantly greater than the degree of homology between Gαt2 and Gαt1 (~82%). Gαt2′ showed a large ~10-fold increase in spontaneous nucleotide exchange rate in comparison to Gαt1′. A series of chimeric and mutant Gαt subunits delineated Gαt2′ residues responsible for high intrinsic nucleotide exchange rate. In contrast, the rates of R*-dependent nucleotide exchange were comparable for Gαt2′ and Gαt1′ reconstituted with Gβ1γ1. Furthermore, Gαt2′ and Gαt1′ exhibited similar rates of intrinsic GTPase activity as well as similar acceleration of GTP hydrolysis by RGS9.
Experimental procedures
Materials
Guanosine 5′-[γ-35S]thiotriphosphate triethylammonium salt (GTPγS; 1100 Ci/mmol), guanosine 5′-[γ-32P]triphosphate triethylammonium salt (~5000Ci/mmol), and nicotinamide adenine dinucleotide ([32P]NAD; 800 Ci/mmol) were from PerkinElmer. Pertussis toxin was from Sigma. Bovine outer rod segment (ROS) membranes were prepared as described (15). Urea-washed ROS membranes (uROS) were prepared according to a published protocol (16). Recombinant Gβ1γ1 complex was expressed using the baculovirus/sf9 cell system and isolated as described (17). The RGS-domain of RGS9 (RGS9d, aa 284–461) was expressed and purified as previously described (14).
Cloning, experession and purification of chimeric Gαt subunits
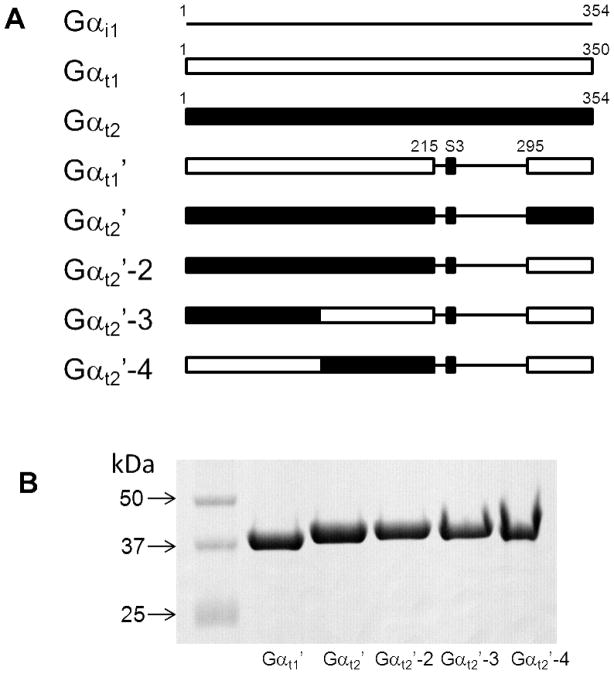
To obtain chimera Gαt2′-2 (Fig. 1), the full-length Gαt1′ (Chi8) sequence was PCR-amplified from the plasmid (13) with a pair of sequence-specific primers (reverse primer contained BamHI site) and cut with BamHI to isolate a 430-bp fragment coding the C-terminal portion of Gαt1′. This fragment was inserted into the large fragment of the pET15b-Gαt2 vector (9) digested with BamHI, thereby replacing the C-terminal portion of Gαt2 with the corresponding fragment of Gαt1′. Correct orientation of the insert was selected by sequencing the construct. Gαt2′ was generated from Gαt2′-2 by replacing three Gαt1-specific residues, Val301, Glu305 and Arg310, with the corresponding Gαt2-specific residues Ser305, Asp309, and Lys314. The triple mutant was produced using the QuikChange mutagenesis protocol (Stratagene). The same mutagenesis procedure was used to generate the A144S mutant of Gαt2′and the following single, double, and triple mutants of Gαt1′: S140A, K117P/S120V, S153N/D154Q, and V159T/T160D/G162E.
Figure 1.
(A). Schematic representation of Gαt chimeras. The switch III region (S3, Gαt1-228-236) (black) is identical in Gαt1 and Gαt2. (B). Coomassie blue-stained SDS-gel showing purified Gαt chimeras. Samples represent equal fractions of the preparations from 0.5 liter bacterial cultures.
Chimeras Gαt2′-3 and Gαt2′-4 were produced by swapping the residues 1–116 and 117–215 of Gαt1′ with residues 1–120 and 121–219 of Gαt2, respectively. The Gαt2′-1-120 sequence was amplified from the Gαt2′-template using a 5′-primer containing an NcoI site and a 3′-primer with a flanking Gαt1′ sequence. The resulting PC product was paired with a 3′ primer containing a HindIII site in PC amplification from the Gαt1′ template to produce the Gαt2′-3 sequence, which was then cloned into the NcoI/HindIII sites of the pHis6 vector (13). To produce Gαt2′-4, the Gαt1′-1-116 sequence was amplified from the Gαt1′ template using a 5′-primer containing an NcoI site and a 3′-primer with a flanking Gαt2′ sequence. The resulting PC product was paired with a 3′ primer containing a XhoI site in PC amplification from the Gαt2′-2 template to produce the Gαt2′-4 sequence, which was then cloned into the NcoI/XhoI sites of the pET15b vector. Upon sequence verification, protein expression of Gαt1′, Gαt2′, their derivatives and mutants, was induced in BL21(DE3) codonPlus competent cells with 30 μM IPTG at 16°C overnight. His6-tagged proteins were purified on His-bind Ni-NTA resin (Novagen) followed by an ion-exchange chromatography on Uno-Q1 column (Bio-Rad). Fractions containing functional Gα-subunits were dialyzed against buffer containing 40% glycerol overnight and stored at −20°C.
GTPγS binding assay
Chimeric Gαt subunits (1 μM) alone, or mixed with 1 μM Gβ1γ1 and uROS membranes (0.25, 1 or 2 μM rhodopsin), were incubated for 2 min at 25ºC in the presence of light. Binding reactions were started with the addition of 5 μM or 100 nM [35S]GTPγS. Aliquots of 15 μl were withdrawn at the indicated times, mixed with 1 ml ice-cold 20 mM Tris-HCl (pH 8.0) buffer containing 130 mM NaCl, 2 mM MgSO4, and 1 mM GTP, passed through Whatman cellulose nitrate filters (0.45 μm), and washed three times with 3 ml of the same buffer without GTP. The filters were dissolved in 5 ml of a xylene-based 3a70B counting cocktail (RPI Corp.) and [35S]GTPγS was measured in a liquid scintillation counter (18). The kapp values for the binding reactions were calculated by fitting data with equation %GTPγS bound=100(1-e−kt). Groups of measurements were compared with two-tailed unpaired t test.
GTPase activity assays
Single-turnover GTPase activity measurements were carried out in suspensions of uROS membranes (10 μM rhodopsin) reconstituted with chimeric Gαt subunits (1 μM) and Gβ1γ1 (1 μM) in 10 mM Tris-HCl (pH 7.5) buffer containing 100 mM NaCl and 4 mM MgSO4 (18, 19). Where indicated, RGS9d (3 or 6 μM) was added. After incubation for 5 min at 25ºC, 100 nM [γ-32P]GTP was added to the mixtures to initiate the reaction. GTPase hydrolysis was quenched at the indicated times by mixing 10 μl aliquots with 100 μl of 6 % (v/v) perchloric acid. Nucleotides were precipitated with 700 μl of 10% (w/v) charcoal suspension in phosphate-buffered saline, and free [32Pi] was measured by liquid scintillation counting. GTPase rate constants were calculated by fitting the data equation %GTP hydrolyzed = 100(1-e−kt), where kcat is the rate constant for GTP hydrolysis.
Pertussis toxin-catalyzed ADP-ribosylation
Chimeric Gαt subunits (0.5 μM each) were mixed with Gβ1γ1 (0.5–2 μM) in 50 μl of 20 mM Tris-HCl (pH 8.0) buffer containing 2 mM MgSO4, 2 mM dithiothreitol, 1 mM EDTA, 10 μM GDP and 5 μg/ml pertussis toxin (preactivated with 100 mM dithiothreitol and 0.25%SDS for 10 min at 30°C). The reaction was started by addition of 5 μM [32P]NAD and allowed to proceed for 1 hr at 25°C. Reaction mixtures were diluted with 1 ml of ice-cold 20 mM Tris-HCl (pH 8.0) buffer containing 100 mM NaCl and filtered through Whatman cellulose-nitrate filters. The filters were washed four times with the same buffer and counted in a liquid scintillation counter. Aliquots (10 μl) were withdrawn from reaction mixtures, mixed with sample buffer for SDS-PAGE and analyzed by SDS-PAGE and autoradiography.
Results
Increased spontaneous nucleotide exchange in chimeric Gαt2 subunits
To examine the biochemical properties of cone transducin-α, we generated a chimeric Gαt2′-subunit, which is a counterpart of previously characterized Gαt1/Gαi1 chimera Chi8 or Gαt1′ (13) (Fig. 1A). This choice of a chimeric template is based on the efficient bacterial expression of Gαt1′ and the fact that it is 94% identical to Gαt1 and appears to recapitulate its essential signaling characteristics. Indeed, expression of functional Gαt2′ in E. coli was similarly robust, and the protein is readily purified (Fig. 1B).
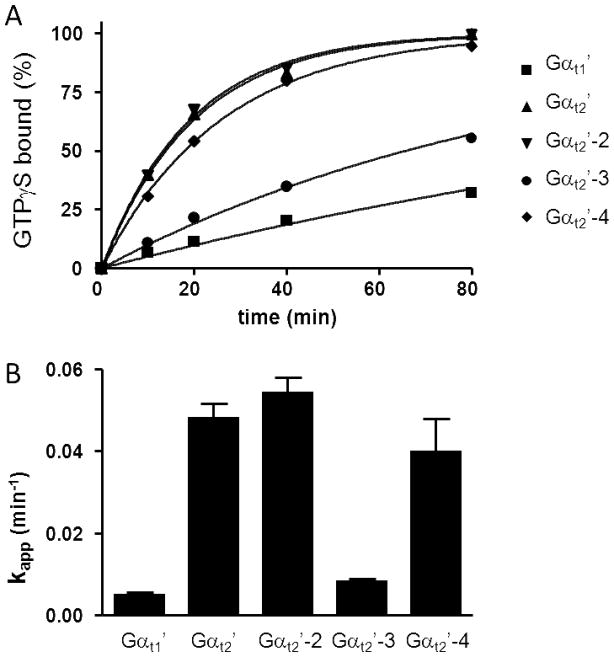
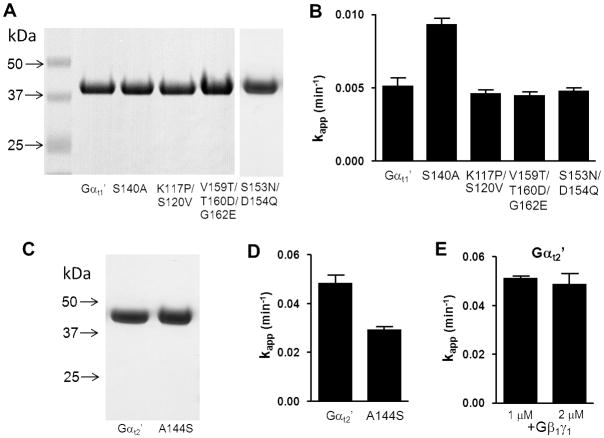
In comparison to Gαi1, native Gαt1 and Gαt1/Gαi1 chimeras containing 215 N-terminal residues of Gαt1 have been shown to have very slow rates of spontaneous guanine nucleotide exchange rate (13). In agreement, the basal rate of GTPγS-binding to Gαt1′ under our experimental conditions was 0.0050±0.0006 min−1. In contrast to Gαt1′, Gαt2′ showed markedly higher intrinsic GTPγS-binding rate (0.048±0.003 min−1) (Fig. 2). Next, we tested chimeric Gαt2′-2, containing 219 N-terminal residues of Gαt2 (Fig. 1A). The basal GTPγS-binding rate for Gαt2′-2 was similar to that of Gαt2′ (Fig. 2), suggesting that the N-terminal part of Gαt2′ is responsible for the increased nucleotide exchange. Chimeras Gαt2′-3 and Gαt2′-4 were produced by swapping the residues 1–116 and 117–215 of Gαt1′ with the corresponding residues of Gαt2 (Fig. 1A). The rate of GTPγS binding to Gαt2′-4 was nearly as high as that for Gαt2′, whereas Gαt2′-3 demonstrated relatively small ~1.7-fold increase in the binding rate over Gαt1′ (p=0.016) (Fig. 2). The Gαt determinants of the spontaneous nucleotide exchange within the Gαt1(117–215) region were further probed by mutational analysis of Gαt1′. This region contains only a few residues that are different between rod and cone Gαt, but strongly conserved within each transducin family (Suppl. Fig 1). The following single, double, and triple mutations replacing rod-specific residues with their cone-specific counterparts were introduced into Gαt1′: S140A, K117P/S120V, S153N/D154Q, and V159T/T160D/G162E (Fig. 3A). The double and triple mutations did not significantly alter the GTPγS-binding rate of Gαt1′, while the S140A substitution led to a moderate 1.8-fold increase in the kapp value for GTPγS binding (p=0.001) (Fig. 3B). We then examined if the reverse mutation A144S in Gαt2′ would alter its nucleotide exchange kinetics (Fig 3C,D). Indeed, the GTPγS-binding rate of the A144S mutant was 1.7-fold lower than that of Gαt2′(p=0.004) (Fig. 3D).
Figure 2.
(A). Spontaneous GTPγS binding to Gαt1′ and Gαt2′-chimeras. The binding of GTPγS to Gαt1′ and Gαt2′-chimeras (1 μM each) was initiated with the addition of 5 μM [35S]GTPγS. Gα-bound GTPγS was counted by withdrawing aliquots at the indicated times and passing them through Whatman cellulose nitrate filters. Results from one of four similar experiments are shown. (B) kapp values (min−1) (mean±SE) of intrinsic GTPγS binding to chimeric Gαt-proteins were calculated from four experiments such as shown in A.
Figure 3.
(A, C)Coomassie blue-stained SDS-gel showing purified mutant Gαt1′- and Gαt2′-subunits. Samples represent equal fractions of the preparations from 0.5 liter bacterial cultures. (B, D) kapp values (min−1) (mean±SE) of intrinsic GTPγS binding to mutant Gαt1′ and Gαt2′ calculated from four binding experiments for each mutant. (E). kapp values (min−1) (mean±SE) of intrinsic GTPγS binding to mutant Gαt2′ (1 μM) in the presence of 1 and 2 μM Gβ1γ1.
Binding of GTPγS to Gα subunits with high spontaneous nucleotide exchange such as Gαi′ or Gαs′ can often be inhibited by Gβγ-subunits (20, 21). Gβ1γ1 had no effect on the basal rate of GTPγS binding to Gαt2′ (Fig. 3E).
Pertussis toxin-catalyzed ADP-ribosylation
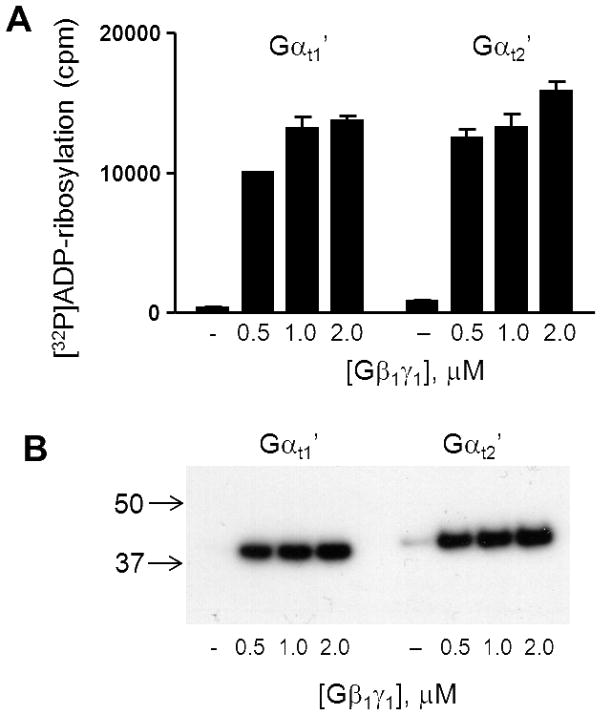
Binding of Gβ1γ1-subunits to Gαt1 facilitates pertussis toxin-catalyzed ADP-ribosylation at Cys347 of Gαt1 (22–24). We utilized this reaction to assess the interactions of Gαt1′ and Gαt2′with Gβ1γ1. Pertussis toxin-catalyzed ADP-ribosylation of Gαt1′ and Gαt2′ were carried out in the absence or presence of increasing concentrations of Gβ1γ1. The basal level of ADP-ribosylation in the absence of Gβ1γ1 was somewhat higher for Gαt2′ compared to Gαt1′ (Fig. 4). The dose-dependencies of Gβ1γ1-supported ADP-ribosylation were comparable for Gαt1′ and Gαt2′ suggesting similar submicromolar Kd values for Gβ1γ1 binding (Fig. 4).
Figure 4. The Gβ1γ1-dependent ADP-ribosylation of Gαt1′ and Gαt2′.
Pertussis toxin-catalyzed ADP-ribosylation of Gαt1′ and Gαt2′ (0.5 μM each) was carried out in the presence of increasing concentrations of Gβ1γ1. (A) [32P]ADP-ribosylation of Gαt1′ and Gαt2′ is analyzed by liquid scintillation counting (mean±SE, n=3). (B) Aliquots from the ADP-ribosylation reaction mixtures were analyzed by SDS-PAGE followed by autoradiography.
Rhodopsin-catalyzed activation of chimeric Gαt2 and Gαt1 reconstituted with Gβ1γ1
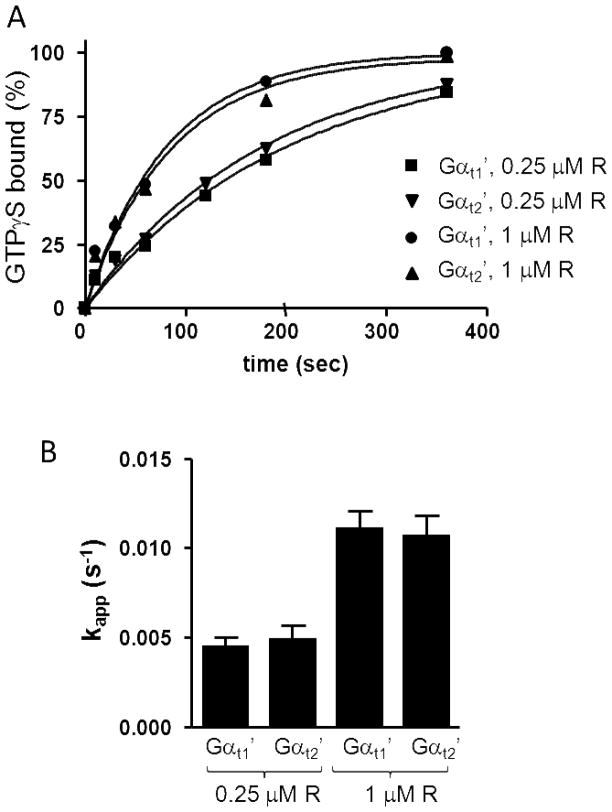
The efficiencies of activation of Gαt2′ and Gαt1′ by R* were measured using a GTPγS-binding assay and reconstitution of the Gα-subunits with Gβ1γ1 and uROS. Suspensions of uROS containing 0.25 μM and 1 μM R* were used to ensure that the GTPγS-binding rates are submaximal. In the presence of uROS containing 0.25 μM R*, the rates of R*-dependent GTPγS binding to Gαt2′ (kapp 0.0045±0.0005 s−1 or 0.27 min−1) and Gαt1′(kapp 0.0048±0.0008 s−1 or 0.29 min−1) were similar and much greater than the unstimulated rates (Fig. 5). In the presence of uROS containing 1 μM R*, the GTPγS-binding rates to Gαt2′ and Gαt1′ were higher still (~0.011 s−1 or 0.7 min−1) (Fig. 5). No significant differences were seen in the activation kinetics of the two Gαt proteins.
Figure 5.
(A) Rhodopsin-catalyzed GTPγS binding to Gαt1′ and Gαt2′. The binding of GTPγS to Gαt1′ and Gαt2′ (1 μM each) in the presence of 1 μM Gβ1γ1 and uROS membranes (0.25 or 1 μM rhodopsin) was initiated with the addition of 5 μM [35S]GTPγS. Gα-bound GTPγS was counted by withdrawing aliquots at the indicated times and passing them through Whatman cellulose nitrate filters. Results from one of four similar experiments are shown. (B) kapp values (s−1) (mean±SE) of intrinsic GTPγS binding to chimeric Gαt-proteins were calculated from four experiments such as shown in A.
GTPase activity of chimeric Gαt2 and Gαt1 and the effects of RGS9d
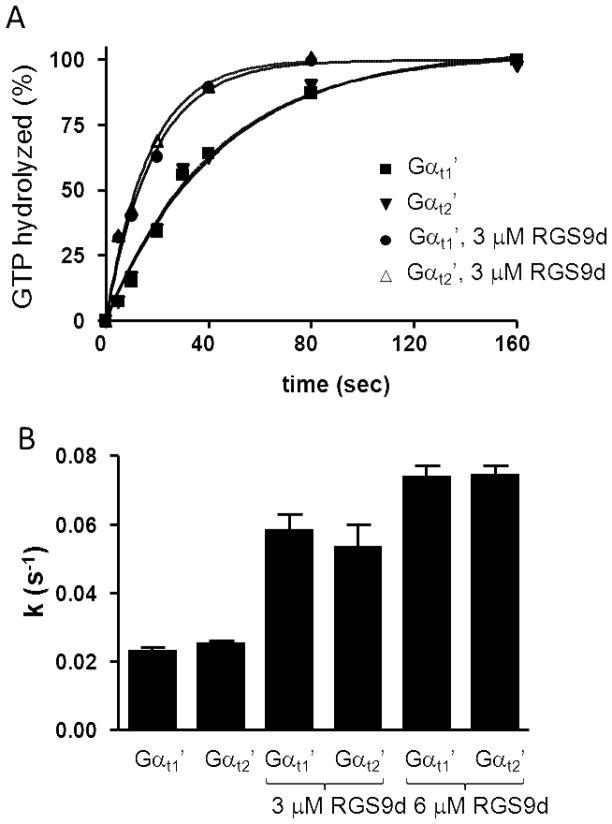
The catalytic rates of GTP hydrolysis for Gαt2′ and Gαt2′-2 were determined in comparison to Gαt1′ using a single turnover assay (GTP=100 nM ≪ Gαtβ1γ1=1 μM) and a high concentration of uROS (10 μM R*). Using uROS containing 2 μM R* and 100 nM GTPγS, the rates of GTPγS-binding to Gαt1′ and Gαt2′ were significantly faster than the measured rates of GTP hydrolysis (Suppl. Fig. 2). Thus, the guanine nucleotide binding rates did not limit GTPase reactions under our experimental conditions. The intrinsic GTPase activity of Gαt2′ (k=0.024±0.001 s−1) was not significantly different from that of Gαt1′ (k=0.023±0.001 s−1) (Fig. 6). The rate of GTP hydrolysis by Gαt2′-2 was also similar to that of Gαt1′ (Suppl. Fig. 3).
Figure 6. Single turnover GTPase assays of Gαt1′ and Gαt2′. Effects of RGS9d.
(A) Single-turnover GTPase activity measurements were carried out in suspensions of uROS membranes (10 μM rhodopsin) reconstituted with chimeric Gαt subunits (1 μM) and Gβ1γ1 (1 μM). Where indicated, RGS9d was added. Reactions were started with the addition of 100 nM [γ-32P]GTP and free 32Pi was measured by liquid scintillation. Results from one of three similar experiments are shown. (B) The kcat values (s−1) (mean±SE) for GTP hydrolysis by chimeric Gαt-proteins were calculated from three experiments such as shown in A.
The ability of the RGS9-284-461 domain to stimulate GTPase activity of Gαt2′ and Gαt1′ was measured at two RGS-protein concentrations, 3 and 6 μM. RGS9-284-461 comparably stimulated GTPase activities of the cone and rod chimeric Gα-subunits. The levels of GTPase activity of Gαt2′ and Gαt1′ were ~ 2.2–2.5 and ~3-fold higher in the presence of 3 μM and 6 μM RGS9-284–461, respectively (Fig. 6B).
Discussion
The role of transducin-α subunit in setting the sensitivity and kinetics of light responses of rods and cones has been actively debated (6, 7, 25). Electrophysiological recordings from mouse cones indicate that in mouse S- and M-cones the amplification of phototransduction is 2–3 fold lower and the inactivation is considerably faster than in rods (4). In view of the similar catalytic efficiencies of rod and cone PDE6 (9) and the smaller size of cone outer segment, the lower amplification implies at least 5-fold lower rate of PDE6 activation per activated pigment molecule in mouse cones compared to rods (4). Replacing the rod Gαt1 with the cone Gαt2 reduced the amplification in mouse rods by ~2-fold, and speeded up the recovery phase by ~2 – fold, suggesting that the differences in the rod and cone responses might be attributed to a significant extent to the nature of Gαt (7). We sought to determine the biochemical basis underlying the physiological changes induced by Gαt2 in GNAT2C rods. Although, the functional GTPγS-bound form of Gαt2 can be isolated following transducin expression in E. coli (9), this preparation cannot be used to study the activation of Gt by R* or Gαt2 GTPase activity. Therefore, we produced and examined chimeric Gαt2–like proteins.
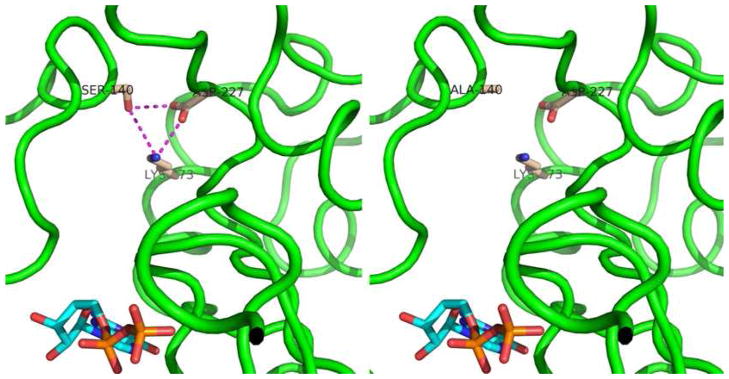
The key biochemical difference between rod-like Gαt1′ and its cone counterpart Gαt2′ was found to be markedly higher intrinsic nucleotide exchange of Gαt2′. The region primarily responsible for the increased nucleotide exchange was mapped to residues Gαt2 (121–219). Gα-subunits of heterotrimeric G proteins are composed of two domains, a GTPase (Ras-like) domain and a helical domain. GDP (or GTP) is buried between the two domains (26, 27). A network of interactions between the two domains is involved in control of basal nucleotide exchange. Mutations disrupting the interdomain interactions increased the basal nucleotide exchange in Gαi (28). Within Gαt2 (121–219), a conserved cone-specific residue Ala144 corresponds to the conserved rod-specific Ser140. Ser140 from the helical domain interacts with Asp227 and Lys273 from the Ras-like domain (26, 27). The model of the Ser→Ala substitution using the structure of GαtGDP (27) demonstrates that the interdomain interactions involving Ser140 are disrupted (Fig. 7). Previous study found no evidence for the role of Ser140 in controlling Gαt1 nucleotide exchange (29). However, a trypsin-protection assay as readout of Gαt1 activation is severely limited in terms of the kinetic resolution. Our results suggest that the Ser→Ala substitution in Gαt2 contributes to its high intrinsic nucleotide rate. The Gαt1′Ser140Ala mutation increased, whereas the Gαt2′Ala144Ser mutation decreased the nucleotide exchange rates of the respective Gα subunits. The effects of these mutations on the basal GTPγS binding rates were moderate, suggesting the involvement of other residues. Gβ1γ1 did not inhibit the high nucleotide exchange rate of Gαt2. This agrees with the impairment of the interdomain contacts in Gαt2 as the cause of its high nucleotide exchange rate. Gβ binds only to the N-terminus and the Ras-like domain of Gα, and, thus may not influence the interdomain interface (12). The finding that the GTPγS-bound Gαt2 can be isolated through the spontaneous nucleotide exchange supports the notion that native Gαt2 also has high intrinsic nucleotide exchange rate (9). The functional significance of this phenomenon, if any, remains to be determined. Spontaneous activation of Gt2 in cones may elevate basal activity of PDE6, potentially altering the sensitivity and kinetics of cone light responses (30).
Figure 7. Interdomain interactions of Ser140 in rod Gαt1 are lost in the S140A mutant.
In the structure of Gαt1GDP (24), Gαt1Ser140 from the helical domain interacts with Asp227 and Lys273 from the Ras-like domain (left). The S140A mutation was introduced into the structure of Gαt1GDP using the Swiss-PdbViewer (v.4) (44). The mutation disrupts the interdomain interactions in Gαt1GDP (right). The images were produced using PyMOL 1.4.1 (45).
Our experiments revealed no significant differences in the binding of Gβ1γ1 to Gαt1′ and Gαt2′ (Fig. 4), nor in the efficiency of Gαt1′ and Gαt2′ activation by R* in the presence of Gβ1γ1 (Fig. 5). However, the rates of activation of non-N-acylated recombinant Gα in the R*, Gβ1γ1-reconstituted system observed previously and in this study are well below the rates of activation of native Gt under similar conditions (13, 31, 32). Thus, our activation paradigm may not be capable of detecting small differences in the R*-Gt coupling for native Gαt2 and Gαt1. Moreover, the potential role of cone-specific Gβ3γ8 to transducin/R* coupling has not been investigated in this study. The interdomain interactions in Gα-subunits appear to be essential to receptor-mediated activation of G proteins. Mutant Gαs-subunits with disrupted interdomain interactions showed decreased ability for activation by the β-adrenergic receptor (33). The relatively weak interdomain interface in Gαt2 may potentially reduce the Gαt2 coupling to R*. Our results seem to favor the idea that the lower amplification in GNAT2C rods is linked to the lower efficiency of Gαt2 coupling to rod PDE6 rather than to R*. Yet, the potency of rod PDE6 activation by Gαt2GTPγS in solution is not significantly lower than the activation by Gαt1GTPγS (9). Nonetheless, rod PDE6 activation by Gαt1 on the membrane is markedly more potent than in solution (34). Alternatively, small reductions in both couplings, R*/Gαt2 and Gαt2/PDE6, may result in the combined 2-fold lower amplification in GNAT2C rods. In cones, however, a short lifetime of photoactivated cone pigments due to rapid spontaneous decay and pigment phosphorylation, and a lower rate of Gt2 activation, may dictate the activation phase of photoresponses (8, 35, 36).
The intrinsic GTPase activities of Gαt2′ and Gαt1′ were found to be similar. The kcat for the unstimulated GTP hydrolysis by Gαt1′ is equivalent to the previously reported kcat values of native Gαt1 (14, 37). Furthermore, the intrinsic GTPase activities of Gαt1 and Gαi1 are comparable (14). Thus, the chimeric Gαt-subunits appear to faithfully reflect intrinsic GTPase activities of Gαt2 and Gαt1, which, in all probability, are similar. The GTPase activity of transducins in vivo is far greater than its intrinsic activity owing to the GAP activity of the membrane-bound RGS9 protein complex with the cooperative input from the effector PDE6 (38, 39). The faster rate of transducin inactivation in cones compared to rods may result from the greater potency or the higher expression levels of the RGS9 complex (14, 40). The former possibility is suggested by the finding that RGS9 is a much more potent GAP for Gαt1 compared to Gαi1, and the selectivity determinants reside in the Gαt1 helical domain (14). Nonetheless, the lack of the difference in the effects of the RGS9d on the GTPase activities of Gαt2 and Gαt1 indicates that the efficacies of RGS9 towards cone and rod transducins are not grossly different. This result is consistent with the strong conservation of RGS9-contact residues of transducin (41) and supportive of RGS9 protein levels as a determining factor in transducin inactivation. The rate of transducin inactivation is regulated by the membrane attachment of the RGS9 GAP complex (42, 43). Therefore, further studies with the use of the N-acylated Gαt subunits are needed to probe the selectivity of the RGS9 GAP complex.
Supplementary Material
Abbreviations
- Gαt1
rod transducin α-subunit
- Gαt2
cone transducin α-subunit
- Gαt2′
Gαt2/Gαi1 chimera
- PDE6
photoreceptor phosphodiesterase-6
- R*
photoexcited rhodopsin
- RGS9
regulator of G-protein signaling 9
- GTPγS
guanosine 5′-O-(3-thiotriphosphate)
Footnotes
This work was supported by National Institutes of Health Grant EY-12682.
Supporting Information available
Figure S1 shows sequence alignment of Gαt1, Gαt2, Gαi1, and chimeric Gαt1′and Gαt2′. Figure S2 shows the kinetics of GTPγS binding to Gαt1′ and Gαt2′ under the conditions of the single-turnover GTPase assay. Figure S3 shows GTPase activity of Gαt2′-2 in the single-turnover assay. Supplemental materials may be accessed free of charge online at http://pubs.acs.org.
References
- 1.Burns ME, Arshavsky VY. Beyond counting photons: trials and trends in vertebrate visual transduction. Neuron. 2005;48:387–401. doi: 10.1016/j.neuron.2005.10.014. [DOI] [PubMed] [Google Scholar]
- 2.Lamb TD, Pugh EN., Jr Phototransduction, dark adaptation, and rhodopsin regeneration the proctor lecture. Invest Ophthalmol Vis Sci. 2006;47:5137–5152. doi: 10.1167/iovs.06-0849. [DOI] [PubMed] [Google Scholar]
- 3.Fu Y, Yau KW. Phototransduction in mouse rods and cones. Pflugers Archiv. 2007;454:805–819. doi: 10.1007/s00424-006-0194-y. [DOI] [PMC free article] [PubMed] [Google Scholar]
- 4.Nikonov SS, Kholodenko R, Lem J, Pugh EN., Jr Physiological features of the S- and M-cone photoreceptors of wild-type mice from single-cell recordings. J Gen Physiol. 2006;127:359–374. doi: 10.1085/jgp.200609490. [DOI] [PMC free article] [PubMed] [Google Scholar]
- 5.Kefalov V, Fu Y, Marsh-Armstrong N, Yau K. Role of visual pigment properties in rod and cone phototransduction. Nature. 2003;425:526–531. doi: 10.1038/nature01992. [DOI] [PMC free article] [PubMed] [Google Scholar]
- 6.Deng WT, Sakurai K, Liu J, Dinculescu A, Li J, Pang J, Min SH, Chiodo VA, Boye SL, Chang B, Kefalov VJ, Hauswirth WW. Functional interchangeability of rod and cone transducin α-subunits. Proc Natl Acad Sci U S A. 2009;106:17681–17686. doi: 10.1073/pnas.0901382106. [DOI] [PMC free article] [PubMed] [Google Scholar]
- 7.Chen CK, Woodruff ML, Chen FS, Shim H, Cilluffo MC, Fain GL. Replacing the rod with the cone transducin subunit decreases sensitivity and accelerates response decay. J Physiol. 2010;588:3231–3241. doi: 10.1113/jphysiol.2010.191221. [DOI] [PMC free article] [PubMed] [Google Scholar]
- 8.Tachibanaki S, Shimauchi-Matsukawa Y, Arinobu D, Kawamura S. Molecular mechanisms characterizing cone photoresponses. Photochem Photobiol. 2007;83:19–26. doi: 10.1562/2006-02-28-IR-823. [DOI] [PubMed] [Google Scholar]
- 9.Muradov H, Boyd KK, Artemyev NO. Rod phosphodiesterase-6 PDE6A and PDE6B subunits are enzymatically equivalent. J Biol Chem. 2010;285:39828–39834. doi: 10.1074/jbc.M110.170068. [DOI] [PMC free article] [PubMed] [Google Scholar]
- 10.Pugh EN, Jr, Lamb TD. Amplification and kinetics of the activation steps in phototransduction. Biochim Biophys Acta. 1993;1141:111–1149. doi: 10.1016/0005-2728(93)90038-h. [DOI] [PubMed] [Google Scholar]
- 11.Krispel CM, Chen D, Melling N, Chen Y, Martemyanov KA, Quillinan N, Arshavsky VY, Wensel TG, Chen C, Burns ME. RGS expression rate-limits recovery of rod photoresponses. Neuron. 2006;51:409–416. doi: 10.1016/j.neuron.2006.07.010. [DOI] [PubMed] [Google Scholar]
- 12.Lambright DG, Sondek J, Bohm A, Skiba NP, Hamm HE, Sigler PB. The 2.0 Å crystal structure of a heterotrimeric G protein. Nature. 1996;379:311–319. doi: 10.1038/379311a0. [DOI] [PubMed] [Google Scholar]
- 13.Skiba NP, Bae H, Hamm HE. Mapping the effector binding sites of transducin α-subunit using Gαt/Gαi1 chimeras. J Biol Chem. 1996;271:413–424. doi: 10.1074/jbc.271.1.413. [DOI] [PubMed] [Google Scholar]
- 14.Skiba NP, Yang CS, Huang T, Bae H, Hamm HE. The α-helical domain of Gαt determines specific interaction with regulator of G protein signaling 9. J Biol Chem. 1999;274:8770–8778. doi: 10.1074/jbc.274.13.8770. [DOI] [PubMed] [Google Scholar]
- 15.Papermaster DS, Dreyer WJ. Rhodopsin content in the outer segment membranes of bovine and frog retinal rods. Biochemistry. 1974;13:2438–2444. doi: 10.1021/bi00708a031. [DOI] [PubMed] [Google Scholar]
- 16.Yamanaka G, Eckstein F, Stryer L. Stereochemistry of the guanyl nucleotide binding site of transducin probed by phosphorothionate analogues of GTP and GDP. Biochemistry. 1985;24:8094–8101. doi: 10.1021/bi00348a039. [DOI] [PubMed] [Google Scholar]
- 17.Ford CE, Skiba NP, Bae H, Daaka Y, Reuveny E, Shekter LR, Rosal R, Weng G, Yang CS, Iyengar R, Miller RJ, Jan LY, Lefkowitz RJ, Hamm HE. Molecular basis forinteractions of G protein βγ subunits with effectors. Science. 1998;280:1271–1274. doi: 10.1126/science.280.5367.1271. [DOI] [PubMed] [Google Scholar]
- 18.Natochin M, Artemyev NO. A point mutation uncouples transducin-α from the photoreceptor RGS and effector proteins. J Neurochem. 2003;87:1262–1271. doi: 10.1046/j.1471-4159.2003.02103.x. [DOI] [PubMed] [Google Scholar]
- 19.Arshavsky VY, Gray-Keller MP, Bownds MD. cGMP suppresses GTPase activity of a portion of transducin equimolar to phosphodiesterase in frog rod outer segments. J Biol Chem. 1991;266:18530–18537. [PubMed] [Google Scholar]
- 20.Linder ME, Pang IH, Duronio RJ, Gordon JI, Sternweis PC, Gilman AG. Lipid modifications of G protein subunits. Myristoylation of Goα increases its affinity for βγ. J Biol Chem. 1991;266:4654–4659. [PubMed] [Google Scholar]
- 21.Natochin M, Muradov KG, McEntaffer RL, Artemyev NO. Rhodopsin recognition by mutant Gsα containing C-terminal residues of transducin. J Biol Chem. 2000;275:2669–2675. doi: 10.1074/jbc.275.4.2669. [DOI] [PubMed] [Google Scholar]
- 22.van Dop C, Yamanaka G, Steinberg F, Sekura RD, Manclark CR, Stryer L, Bourne HR. ADP-ribosylation of transducin by pertussis toxin blocks the light-stimulated hydrolysis of GTP and cGMP in retinal photoreceptors. J Biol Chem. 1984;259:23–26. [PubMed] [Google Scholar]
- 23.Watkins PA, Burns DL, Kanaho Y, Liu TY, Hewlett EL, Moss J. ADP-ribosylation of transducin by pertussis toxin. J Biol Chem. 1985;260:13478–13482. [PubMed] [Google Scholar]
- 24.West RE, Jr, Moss J, Vaughan M, Liu T, Liu TY. Pertussis toxin-catalyzed ADP-ribosylation of transducin. Cysteine 347 is the ADP-ribose acceptor site. J Biol Chem. 1985;260:14428–14430. [PubMed] [Google Scholar]
- 25.Zhang X, Wensel TG, Yuan C. Tokay gecko photoreceptors achieve rod-like physiology with cone-like proteins. Photochem Photobiol. 2006;82:1452–1460. doi: 10.1562/2006-01-05-RA-767. [DOI] [PubMed] [Google Scholar]
- 26.Noel JP, Hamm HE, Sigler PB. The 2.2A crystal structure of transducin-α complexed with GTPγS. Nature. 1993;366:654–663. doi: 10.1038/366654a0. [DOI] [PubMed] [Google Scholar]
- 27.Lambright DG, Noel JP, Hamm HE, Sigler PB. Structural determinants for activation of the α-subunit of a heterotrimeric G protein. Nature. 1994;369:621–628. doi: 10.1038/369621a0. [DOI] [PubMed] [Google Scholar]
- 28.Remmers AE, Engel C, Liu M, Neubig RR. Interdomain interactions regulate GDP release from heterotrimeric G proteins. Biochemistry. 1999;38:13795–13800. doi: 10.1021/bi990887f. [DOI] [PubMed] [Google Scholar]
- 29.Marin EP, Krishna AG, Archambault V, Simuni E, Fu WY, Sakmar TP. The function of interdomain interactions in controlling nucleotide exchange rates in transducin. J Biol Chem. 2001;276:23873–23880. doi: 10.1074/jbc.M101197200. [DOI] [PubMed] [Google Scholar]
- 30.Nikonov S, Lamb TD, Pugh EN., Jr The role of steady phosphodiesterase activity in the kinetics and sensitivity of the light-adapted salamander rod photoresponse. J Gen Physiol. 2001;116:795–824. doi: 10.1085/jgp.116.6.795. [DOI] [PMC free article] [PubMed] [Google Scholar]
- 31.Barren B, Natochin M, Artemyev NO. Mutation R238/E in transducin-α yields a GTPase and effector-deficient, but not dominant-negative G-protein α-subunit. Mol Vis. 2006;12:492–498. [PubMed] [Google Scholar]
- 32.Gopalakrishna KN, Doddapuneni K, Boyd KK, Masuho I, Martemyanov KA, Artemyev NO. Interaction of transducin with uncoordinated 119 protein (UNC119): implications for the model of transducin trafficking in rod photoreceptors. J Biol Chem. 2011;286:28954–28962. doi: 10.1074/jbc.M111.268821. [DOI] [PMC free article] [PubMed] [Google Scholar]
- 33.Grishina G, Berlot CH. Mutations at the domain interface of Gsα impair receptor-mediated activation by altering receptor and guanine nucleotide binding. J Biol Chem. 1998;273:15053–15060. doi: 10.1074/jbc.273.24.15053. [DOI] [PubMed] [Google Scholar]
- 34.Malinski JA, Wensel TG. Membrane stimulation of cGMP phosphodiesterase activation by transducin: comparison of phospholipid bilayers to rod outer segment membranes. Biochemistry. 1992;31:9502–9512. doi: 10.1021/bi00154a024. [DOI] [PubMed] [Google Scholar]
- 35.Imai H, Kojima D, Oura T, Tachibanaki S, Terakita A, Shichida Y. Single amino acid residue as a functional determinant of rod and cone visual pigments. Proc Natl Acad Sci USA. 1997;94:2322–2326. doi: 10.1073/pnas.94.6.2322. [DOI] [PMC free article] [PubMed] [Google Scholar]
- 36.Kennedy MJ, Dunn FA, Hurley JB. Visual pigment phosphorylation but not transducin translocation can contribute to light adaptation in zebrafish cones. Neuron. 2004;41:915–928. doi: 10.1016/s0896-6273(04)00086-8. [DOI] [PubMed] [Google Scholar]
- 37.Natochin M, Granovsky AE, Artemyev NO. Regulation of transducin GTPase activity by human retinal RGS. J Biol Chem. 1997;272:17444–17449. doi: 10.1074/jbc.272.28.17444. [DOI] [PubMed] [Google Scholar]
- 38.He W, Cowan CW, Wensel TG. RGS9, a GTPase accelerator for phototransduction. Neuron. 1998;20:95–102. doi: 10.1016/s0896-6273(00)80437-7. [DOI] [PubMed] [Google Scholar]
- 39.Skiba NP, Hopp JA, Arshavsky VY. The effector enzyme regulates the duration of G protein signaling in vertebrate photoreceptors by increasing the affinity between transducin and RGS protein. J Biol Chem. 2000;275:32716–32720. doi: 10.1074/jbc.C000413200. [DOI] [PubMed] [Google Scholar]
- 40.Zhang X, Wensel TG, Kraft TW. GTPase regulators and photoresponses in cones of the eastern chipmunk. J Neurosci. 2003;23:1287–1297. doi: 10.1523/JNEUROSCI.23-04-01287.2003. [DOI] [PMC free article] [PubMed] [Google Scholar]
- 41.Slep KC, Kercher MA, He W, Cowan CW, Wensel TG, Sigler PB. Structural determinants for regulation of phosphodiesterase by a G protein at 2.0 A. Nature. 2001;409:1071–1077. doi: 10.1038/35059138. [DOI] [PubMed] [Google Scholar]
- 42.Hu G, Wensel TG. R9AP, a membrane anchor for the photoreceptor GTPase accelerating protein, RGS9-1. Proc Natl Acad Sci USA. 2002;99:9755–9760. doi: 10.1073/pnas.152094799. [DOI] [PMC free article] [PubMed] [Google Scholar]
- 43.Lishko PV, Martemyanov KA, Hopp JA, Arshavsky VY. Specific binding of RGS9-Gβ5L to protein anchor in photoreceptor membranes greatly enhances its catalytic activity. J Biol Chem. 2002;277:24376–24381. doi: 10.1074/jbc.M203237200. [DOI] [PubMed] [Google Scholar]
- 44.Guex N, Peitsch MC. SWISS-MODEL and the Swiss-PdbViewer: an environment for comparative protein modeling. Electrophoresis. 1997;18:2714–2723. doi: 10.1002/elps.1150181505. [DOI] [PubMed] [Google Scholar]
- 45.DeLano WL. The PyMOL molecular graphics system. 2004 http://www.pymol.org.
Associated Data
This section collects any data citations, data availability statements, or supplementary materials included in this article.


