

Abstract
Objective To determine the costs and health effects of interventions to combat breast, cervical, and colorectal cancers in order to guide resource allocation decisions in developing countries.
Setting Two World Health Organization sub-regions of the world: countries in sub-Saharan Africa with very high adult and high child mortality (AfrE); and countries in South East Asia with high adult and high child mortality (SearD).
Design Cost effectiveness analysis of prevention and treatment strategies for breast, cervical, and colorectal cancer, using mathematical modelling based on a lifetime population model.
Data sources Demographic and epidemiological data were taken from the WHO mortality and global burden of disease databases. Estimates of intervention coverage, effectiveness, and resource needs were based on clinical trials, treatment guidelines, and expert opinion. Unit costs were taken from the WHO-CHOICE price database.
Main outcome measures Cost per disability adjusted life year (DALY) averted, expressed in international dollars ($Int) for the year 2005.
Results In both regions certain interventions in cervical cancer control (screening through cervical smear tests or visual inspection with acetic acid in combination with treatment) and colorectal cancer control (increasing the coverage of treatment interventions) cost <$Int2000 per DALY averted and can be considered highly cost effective. In the sub-Saharan African region screening for colorectal cancer (by colonoscopy at age 50 in combination with treatment) costs $Int2000–6000 per DALY averted and can be considered cost effective. In both regions certain interventions in breast cancer control (treatment of all cancer stages in combination with mammography screening) cost $Int2000–6000 per DALY averted and can also be considered cost effective. Other interventions, such as campaigns to eat more fruit and vegetable or subsidies in colorectal cancer control, are not cost effective according to the criteria defined.
Conclusion Highly cost effective interventions to combat cervical and colorectal cancer are available in the African and Asian sub-regions. In cervical cancer control, these include screening through smear tests or visual inspection in combination with treatment. In colorectal cancer, increasing treatment coverage is highly cost effective (screening through colonoscopy is cost effective in the African sub-region). In breast cancer control, mammography screening in combination with treatment of all stages is cost effective.
Introduction
Malignant neoplasms are responsible for nearly 7.5 million deaths, representing some 13% of all mortality and 5% of the global burden of disease in terms of disability adjusted life years (DALYs) lost.1 Leading contributors to global cancer mortality include tracheal, bronchial, and lung cancer (18%); stomach cancer (11%); colorectal cancer (9%); liver cancer (8%); breast cancer (7%); oesophageal cancer (7%); lymphomas (5%); oral cancers (5%); prostate cancer (4%); leukaemia (4%); pancreatic cancer (4%); and cervical cancer (4%).1
This study evaluates a set of 81 interventions (and intervention combinations) for prevention, screening, and treatment of breast, cervical, and colorectal cancer at different geographic coverage levels. The cost effectiveness of interventions against tracheal, bronchial, and lung cancer in the context of tobacco use is presented in a companion article in this series.2 The study does not evaluate interventions for stomach cancer because of the absence of known efficacious interventions. Likewise, it does not evaluate interventions against liver cancer: although preventive interventions exist, only part of their impact is captured by reductions in liver cancer (hepatitis B vaccination has a more direct impact on hepatitis B and cirrhosis, and interventions to reduce alcohol use are considered within the context of neuropsychiatric conditions in this series3).
Breast cancer incidence varies considerably between world regions, with incidence up to eight times higher in high income regions than in low income regions such as South Asia.1 Similarly, colorectal cancer incidence is five to 10 times higher in high income regions. Conversely, the burden of cervical cancer is inversely related to economic development, with 300–400 DALYs per million people in high income regions, rising to 800–1250 in low income regions.1
This paper provides indications of the cost effectiveness of prevention, screening, and treatment strategies for reducing the burden associated with leading causes of cancer in developing countries. It draws on previous analyses of each of the cancers,4 5 6 here updated to the year 2005 and brought together in order to elicit insights into the comparative costs and effects of different intervention strategies across and beyond individual cancer entities. In common with other studies in this series, we evaluated interventions for two major global regions using a standardised analytical approach. The two regions are referred to as sub-Saharan Africa, including those African countries with very high adult and high child mortality (referred to as AfrE in the WHO classification) and South East Asia including those countries in Asia with high adult and high child mortality (SearD in the WHO classification). The use of the standardised WHO-CHOICE framework allows the comparison of the cost effectiveness of interventions within cancer control but also the comparison of interventions for non-communicable diseases in general, as presented in this series, and for infant and infectious diseases as reported earlier.7
Methods
This section outlines the main principles of WHO-CHOICE analysis, and its application to the cost effectiveness analysis of breast, cervical, and colorectal control. Further details on WHO-CHOICE are presented in detail in the general appendix on bmj.com and other documents.8 9 Details on the disease-specific analysis are reported in appendices 1–3 on bmj.com.
Intervention effects
WHO-CHOICE employs an epidemiological, population based approach to the assessment of health outcomes. Along with background demographic rates, observed rates of cancer incidence, prevalence, remission, and case fatality (table 1)—primarily drawn from the Global Burden of Disease database1—are represented as parameters in a state transition model in order to establish the total number of years of healthy life experienced over the lifetime of a defined population (see general appendix on bmj.com and other documents8 9). The model is successively run for each intervention scenario and compared with the baseline of no interventions for the disease in question. Thus, the health effects of a range of preventive, screening, and treatment strategies for cancer are considered, with effectiveness expressed as a reduction in epidemiological rates such as incidence or case fatality.
Table 1.
Epidemiology of breast, cervical, and colorectal cancer in WHO sub-Saharan African sub-region AfrE and South East Asian sub-region SearD*
| Age group (years) | African region Afr-E | South-East Asian region Sear-D | |||||||
|---|---|---|---|---|---|---|---|---|---|
| Breast cancer (women) | Cervical cancer (women) | Colorectal cancer | Breast cancer (women) | Cervical cancer (women) | Colorectal cancer | ||||
| Men | Women | Men | Women | ||||||
| Incidence (per 1000 population) | |||||||||
| 15–29 | 0.02 | 0.23 | 0.02 | 0.00 | 0.01 | 0.18 | 0.01 | 0.00 | |
| 30–44 | 0.38 | 0.27 | 0.05 | 0.04 | 0.21 | 0.12 | 0.02 | 0.02 | |
| 45–59 | 0.82 | 1.58 | 0.31 | 0.20 | 0.45 | 0.75 | 0.12 | 0.09 | |
| 60–69 | 1.79 | 3.46 | 0.91 | 0.49 | 0.79 | 1.21 | 0.35 | 0.23 | |
| 70–79 | 2.44 | 3.95 | 1.59 | 0.83 | 0.95 | 0.99 | 0.42 | 0.30 | |
| ≥80 | 3.01 | 3.56 | 3.36 | 1.61 | 2.18 | 1.61 | 0.83 | 0.89 | |
| Prevalence (per 1000 population) | |||||||||
| 15–29 | 0.07 | 0.08 | 0.07 | 0.02 | 0.18 | 8.44 | 0.11 | 0.11 | |
| 30–44 | 1.44 | 0.76 | 0.20 | 0.12 | 2.40 | 3.29 | 0.24 | 0.43 | |
| 45–59 | 3.03 | 3.83 | 0.89 | 0.45 | 3.43 | 11.00 | 0.81 | 0.87 | |
| 60–69 | 6.43 | 7.45 | 3.50 | 1.55 | 3.48 | 9.32 | 2.14 | 1.46 | |
| 70–79 | 7.60 | 5.72 | 5.16 | 2.08 | 2.28 | 2.85 | 1.40 | 1.15 | |
| ≥80 | 8.60 | 4.26 | 9.48 | 3.48 | 3.58 | 2.63 | 1.50 | 1.68 | |
| Mortality (per 1000 population) | |||||||||
| 15–29 | 0.01 | 0.05 | 0.01 | 0.00 | 0.00 | 0.03 | 0.00 | 0.00 | |
| 30–44 | 0.13 | 0.09 | 0.05 | 0.02 | 0.07 | 0.04 | 0.02 | 0.01 | |
| 45–59 | 0.47 | 0.69 | 0.13 | 0.07 | 0.28 | 0.33 | 0.04 | 0.03 | |
| 60–69 | 1.26 | 2.27 | 0.41 | 0.26 | 0.65 | 0.84 | 0.20 | 0.12 | |
| 70–79 | 2.04 | 3.61 | 1.23 | 0.58 | 0.85 | 1.93 | 0.32 | 0.21 | |
| ≥80 | 3.01 | 3.55 | 3.20 | 1.44 | 2.18 | 1.61 | 0.78 | 0.80 | |
*Data source: WHO Global Burden of Disease.1
We followed standard WHO-CHOICE methods for identification of the best available evidence on the (clinical or population) effectiveness of interventions. In the ideal case, this evidence is retrieved from systematic reviews, but it is also based on individual studies and, when no evidence is available, on expert opinion. We used evidence on intervention effectiveness pertaining to the regions under study, or extrapolated this from Western settings where meaningful. Evaluated interventions are listed in table 2, and their data sources for intervention effectiveness are listed in tables 3–5 . DALYs averted were discounted at 3% per annum and weighted for age. Interventions were analysed at WHO-CHOICE standard geographic coverage levels of 50%, 80%, and 95%, referring to the percentage of eligible cases receiving treatment.
Table 2.
Evaluated interventions for breast, cervical, and colorectal cancer control in WHO sub-Saharan African sub-region AfrE and South East Asian sub-region SearD. All interventions were evaluated at 50%, 80%, and 95% coverage
| Intervention | Abbreviation |
|---|---|
| Breast cancer | |
| 1: Stage I treatment (Lumpectomy with auxiliary dissection supplemented with external radiotherapy to breast. Eligible patients also receive endocrine therapy) | Stage I treatment |
| 2: Stage II treatment (Lumpectomy with auxiliary dissection supplemented with external radiotherapy to breast. Eligible patients also receive endocrine therapy) | Stage II treatment |
| 3: Stage III treatment (neo-adjuvant chemotherapy followed by mastectomy with auxiliary dissection supplemented with adjuvant chemotherapy. External radiotherapy to the breast. Eligible patients receive endocrine therapy) | Stage III treatment |
| 4: Stage IV treatment (systemic chemotherapy supplemented with endocrine therapy for eligible patients) | Stage IV treatment |
| 5: Combination treatment (treatment of all stages) | Combination treatment |
| 6: Optimal programme (treatment of all stages plus biannual mammographic screening in women aged 50–70 years) | Optimal programme |
| Colorectal cancer | |
| 1: Annual faecal occult blood tests | FOB1 |
| 2: Biennial faecal occult blood tests | FOB2 |
| 3: Sigmoidoscopy every 5 years | SIG5 |
| 4: Colonoscopy every 10 years | COL10 |
| 5: Annual faecal occult blood test + sigmoidoscopy every 5 years | FOB1SIG5 |
| 6: Faecal occult blood test at age 50 years | FOB50 |
| 7: Sigmoidoscopy at age 50 | SIG50 |
| 8: Colonoscopy at age 50 | COL50 |
| 9: Faecal occult blood test + sigmoidoscopy at age 50 | FOBSIG50 |
| 10: Medical treatment of cancers | RX |
| 11: Annual faecal occult blood tests + medical treatment | FOB1RX |
| 12: Biennial faecal occult blood tests + medical treatment | FOB2RX |
| 13: Sigmoidoscopy every 5 years + medical treatment | SIG5RX |
| 14: Colonoscopy every 10 years + medical treatment | COL10RX |
| 15: Annual faecal occult blood test + sigmoidoscopy every 5 years + medical treatment | FOB1SIG5RX |
| 16: Faecal occult blood test at age 50 + medical treatment | FOB50RX |
| 17: Sigmoidoscopy at age 50 + medical treatment | SIG50RX |
| 18: Colonoscopy at age 50 + medical treatment | COL50RX |
| 19: Faecal occult blood test + sigmoidoscopy at age 50 + medical treatment | FOBSIG50RX |
| 20: Fruit and vegetables campaign | FVCAMP |
| 21: Fruit and vegetables campaign + medical treatment | FVCAMPRX |
| 22: Annual digital rectal examination | DRE1 |
| 23: Annual digital rectal examination + medical treatment | DRE1RX |
| Cervical cancer | |
| 1: Annual screening by cervical smear test for ages 20–65 years (with removal of lesions) | Pap (1,20,65)* |
| 2: Triennial screening by cervical smear test for ages 20–65 (with removal of lesions) | Pap (3,20,65)* |
| 3: Screening by visual inspection with acetic acid at age 40 years (with removal of lesions) | VIA (40)* |
| 4: Treatment of invasive cancer (including chemotherapy, radiotherapy, and/or surgery) | Rx |
| 5: Annual smear test for ages 20–65 years + cancer treatment | Pap (1,20,65)* + Rx |
| 6: Triennial smear test for ages 20–65 years + cancer treatment | Pap (3,20,65)* + Rx |
| 7: Visual inspection with acetic acid at age 40 + cancer treatment | VIA (40)* + Rx |
| 8: Screening by smear test every five years for ages 20–65 (with removal of lesions) | Pap (5,20,65)* |
| 9: Smear test every five years for ages 20–65 + cancer treatment | Pap (5,20,65)* + Rx |
| 10: Annual screening by smear test for ages 20–30 years, then annual smear test with HPV vaccination for ages 30–65 years | Pap (1,20,30) then Pap & HPV (1,30,65) |
| 11: Annual smear test for ages 20–30 then annual smear test with HPV vaccination for ages 30–65 + cancer treatment | Pap (1,20,30) then Pap & HPV (1,30,65) + Rx |
| 12: Triennial smear test for ages 20–30 then triennial smear test with HPV vaccination for ages 30–65 | Pap (3,20,30) then Pap & HPV (3,30,65) |
| 13: Triennial smear test for ages 20–30 then triennial smear test with HPV vaccination for ages 30–65 + cancer treatment | Pap (3,20,30) then Pap & HPV (3,30,65) + Rx |
| 14: Smear test every five years for ages 20–30 then smear test with HPV vaccination every five years for ages 30–65 | Pap (5,20,30) then Pap & HPV (5,30,65) |
| 15: Smear test every five years for ages 20–30 then smear test with HPV vaccination every five years for ages 30–65 + cancer treatment | Pap (5,20,30) then Pap & HPV (5,30,65) + Rx |
| 16: Screening by smear test at ages 35, 40, and 45 years (with removal of lesions) | Pap (35,40,45)*. |
| 17: Smear test at ages 35, 40, and 45 + cancer treatment | Pap (35,40,45)* + Rx. |
| 18: HPV vaccination at ages 35, 40, and 45 years (with removal of lesions) | HPV (35,40,45) *. |
| 19: HPV vaccination at ages 35, 40, and 45 + cancer treatment | HPV (35,40,45) * + Rx |
| 20: Screening by visual inspection with acetic acid at ages 35, 40, and 45 years | VIA (35,40,45) |
| 21: Visual inspection with acetic acid at ages 35, 40, and 45 + cancer treatment | VIA (35,40,45) * + Rx |
| 22: Screening by smear test at age 40 years (with removal of lesions) | Pap (40) * |
| 23: Smear test at age 40 + cancer treatment | Pap (40) * + Rx |
| 24: HPV vaccination at age 40 (with removal of lesions) | HPV (40) * |
| 25: HPV vaccination at age 40 + cancer treatment | HPV (40) * + Rx |
| 26: HPV vaccinations starting at age 12 at cost of US$0.60 per vaccine | HPVAC(12), $0.60/dose |
| 27: HPV vaccinations starting at age 12 at US$0.60 + cancer treatment | HPVAC (12), $0.60/dose + Rx |
| 28: HPV vaccinations starting at age 12 at cost of US$2.00 per vaccine | HPVAC (12), $2.00/dose |
| 29: HPV vaccinations starting at age 12 at US$2.00 + cancer treatment | HPVAC (12), $2.00/dose + Rx |
| 30: Annual smear test for ages 20–65 years + HPV vaccinations starting at age 12 at cost US$0.60 | Pap(1,20,65)*+HPVAC (12,$.60) |
| 31: Triennial smear test for ages 20–65 years + HPV vaccinations starting at age 12 at cost US$0.60 | Pap(3,20,65)*+HPVAC (12,$.60) |
| 32: Visual inspection with acetic acid at age 40 + HPV vaccinations starting at age 12 at cost US$0.60 | VIA(40)*+HPVAC (12), $.60) |
| 33: Annual smear test for ages 20–65 years + HPV vaccinations starting at age 12 at cost US$0.60 + cancer treatment | Pap(1,20,65)*+HPVAC (12, $.60) + Rx |
| 34: Visual inspection with acetic acid at age 40 + HPV vaccinations starting at age 12 at cost US$0.60 + cancer treatment | VIA(40)*+HPVAC (12, $.60) + Rx |
| 35: Smear test every five years for ages 20–65 + HPV vaccinations starting at age 12 at cost US$0.60 | Pap(5,20,65)*+HPVAC (12, $.60) |
| 36: Smear test every five years for ages 20–65 + HPV vaccinations starting at age 12 at cost US$0.60 + cancer treatment | Pap(5,20,65)*+HPVAC (12, $.60) + Rx |
| 37: Annual smear test for ages 20–30 then annual smear test with HPV vaccination for ages 30–65 + HPV vaccinations starting at age 12 at cost US$0.60 | Pap (1,20,30) & Pap/HPV(1,30,65)*+HPVAC (12,$.60) |
| 38: Annual smear test for ages 20–30 then annual smear test with HPV vaccination for ages 30–65 + HPV vaccinations starting at age 12 at cost US$0.60 + cancer treatment | Pap (1,20,30) & Pap/HPV(1,30,65)*+HPVAC (12,$.60)+Rx |
| 39: Triennial smear test for ages 20–30 then triennial smear test with HPV vaccination for ages 30–65 + HPV vaccinations starting at age 12 at cost US$0.60 | Pap (3,20,30) & Pap/HPV(3,30,65)*+HPVAC (12,$.60) |
| 40: Triennial smear test for ages 20–30 then triennial smear test with HPV vaccination for ages 30–65 + HPV vaccinations starting at age 12 at cost US$0.60 + cancer treatment | Pap (3,20,30) & Pap/HPV(3,30,65)*+HPVAC (12,$.60)+Rx |
| 41: Smear test every five years for ages 20–30 then smear test with HPV vaccination every five years for ages 30–65 + HPV vaccinations starting at age 12 at cost US$0.60 | Pap (5,20,30) & Pap/HPV(5,30,65)*+HPVAC (12,$.60) |
| 42: Smear test every five years for ages 20–30 then smear test with HPV vaccination every five years for ages 30–65 + HPV vaccinations starting at age 12 at cost US$0.60 + cancer treatment | Pap (5,20,30) & Pap/HPV(5,30,65)*+HPVAC (12,$.60)+Rx |
| 43: Smear test at ages 35, 40, and 45 + HPV vaccinations starting at age 12 at cost US$0.60 | Pap (35,40,45)* +HPVAC (12,$.60) |
| 44: Smear test at ages 35, 40, and 45 + HPV vaccinations starting at age 12 at cost US$0.60 + cancer treatment | Pap (35,40,45)* +HPVAC (12,$.60)+Rx |
| 45: HPV vaccination at ages 35, 40, and 45 + HPV vaccinations starting at age 12 at cost US$0.60 | HPV (35,40,45)* +HPVAC (12,$.60) |
| 46: HPV vaccination at ages 35, 40, and 45 + HPV vaccinations starting at age 12 at cost US$0.60 + cancer treatment | HPV (35,40,45)* +HPVAC (12,$.60)+Rx |
| 47: Visual inspection with acetic acid at ages 35, 40, and 45 + HPV vaccinations starting at age 12 at cost US$0.60 | VIA (35,40,45)* +HPVAC (12,$.60) |
| 48: Visual inspection with acetic acid at ages 35, 40, and 45 + HPV vaccinations starting at age 12 at cost US$0.60 + cancer treatment | VIA (35,40,45)* +HPVAC (12,$.60)+Rx |
| 49: Smear test at age 40 + HPV vaccinations starting at age 12 at cost US$0.60 | Pap (40)* +HPVAC (12,$.60) |
| 50: Smear test at age 40 + HPV vaccinations starting at age 12 at cost US$0.60 + cancer treatment | Pap (40)* +HPVAC (12,$.60)+Rx |
| 51: HPV vaccination at age 40 + HPV vaccinations starting at age 12 at cost US$0.60 | HPV (40)* +HPVAC (12,$.60) |
| 52: HPV vaccination at age 40 + HPV vaccinations starting at age 12 at cost US$0.60 + cancer treatment | HPV (40)* +HPVAC (12,$.60)+Rx |
HPV= human papillomavirus.
Table 3.
Model inputs for cost effectiveness analysis of breast cancer control in WHO sub-Saharan African sub-region AfrE and South East Asian sub-region SearD
| Variable | Assumption | Data source |
|---|---|---|
| Distribution of prevalent cases (2005) and incident cases (2005–14) without breast cancer control programme: | Sankaranarayanan et al10* | |
| Stage I | 9.4% | |
| Stage II | 14.2% | |
| Stage III | 58.0% | |
| Stage IV | 18.4% | |
| Distribution of incident cases (2005–14) in presence of optimal breast cancer programme: | Bland et al11† | |
| Stage I | 49.0% | |
| Stage II | 37.4% | |
| Stage III | 8.6% | |
| Stage IV | 5.0% | |
| Case fatality rate of untreated patients (2005–14): | Sankaranarayanan et al10* | |
| Stage I | 0.020 | |
| Stage II | 0.063 | |
| Stage III | 0.150 | |
| Stage IV | 0.300 | |
| Case fatality rate of treated patients (2005–14): | Bland et al11† | |
| Stage I | 0.006 | |
| Stage II | 0.042 | |
| Stage III | 0.093 | |
| Stage IV | 0.275 | |
| Disability weight: | Murray and Lopez12; Norum et al13; Launois et al14; de Koning et al15‡ | |
| Stage I | 0.068 | |
| Stage II | 0.070 | |
| Stage III | 0.072 | |
| Stage IV treated | 0.073 |
*Combined data on breast cancer survival and disease staging from studies in Bombay, Bangalore, Barshi, Madras, Rizal, Chiang Mai, and Khon Kaen. These data, collected at International Agency for Research on Cancer (IARC), give the best available overview of survival and cancer stage distributions in Asian countries. Because of lack of similar data in sub-Saharan Africa, we assumed the IARC data to represent this region as well. These data represent the absence of breast cancer control strategies.
†Data on breast cancer survival and disease staging based on a large sample size and specific per treatment. These data represent the presence of an optimal breast cancer control programme.
‡Health state valuation were based on the Burden of Disease study following standard WHO-CHOICE methods. Since only a single health state valuation is available for breast cancer, other studies were used to develop health state valuations for each cancer stage. The referred studies are the only studies that differentiate health state valuations for breast cancer by stage.
Table 4.
Model inputs for cost effectiveness analysis cervical colorectal cancer control in WHO sub-Saharan African sub-region AfrE and South East Asian sub-region SearD
| Variable | Assumption | Data source |
|---|---|---|
| Efficacy of HPV vaccination against HPV genotypes 16 and 18 | 100% | Kim et al17 |
| Cervical smear test: | Goldie et al21 | |
| Sensitivity of detecting low grade lesions | 0.60 | |
| Specificity of detecting low grade lesions | 0.95 | |
| HPV DNA testing: | Goldie et al21 | |
| Sensitivity of detecting low grade lesions | 0.84 | |
| Specificity of detecting low grade lesions | 0.88 | |
| Visual inspection with acid (VIA): | Goldie et al21 | |
| Sensitivity of detecting low grade lesions | 0.68 | |
| Specificity of detecting low grade lesions | 0.85 | |
| Cervical smear + HPV DNA tests combined: | Kim et al22 | |
| Sensitivity of detecting low grade lesions | 0.94 | |
| Specificity of detecting low grade lesions | 0.93 | |
| Disability weight for cervical cancer | 0.075 | Murray and Lopez12 |
HPV= human papillomavirus
Estimates of incidence and case fatality reductions derived from modelling the above data are listed in table A3.1 in appendix 3 on bmj.com.
Table 5.
Model inputs for cost effectiveness analysis of colorectal cancer control in WHO sub-Saharan African sub-region AfrE and South East Asian sub-region SearD
| Variable | Assumption | Data source |
|---|---|---|
| Faecal occult blood test: | Wagner et al23* | |
| Sensitivity for detecting polyps | 0.1 | |
| Specificity for detecting polyps | 0.9 | |
| Sensitivity for detecting cancer | 0.6 | |
| Specificity for detecting cancer | 0.9 | |
| Sigmoidoscopy: | Wagner et al23* | |
| Sensitivity for detecting polyps and cancers | 0.4 | |
| Specificity for detecting polyps and cancers | 0.9 | |
| Colonoscopy: | Wagner et al23* | |
| Sensitivity for detecting polyps and cancers | 0.9 | |
| Specificity for detecting polyps and cancers | 1.0 | |
| Digital rectal examination: | Herrinton et al24† | |
| Sensitivity for detecting polyps and cancers | 0.04 | |
| Specificity for detecting polyps and cancers | 1.0 | |
| Eat more fruit and vegetables campaign: | ||
| Increased consumption | 12.4% | Dixon et al25‡ |
| Decrease in cancer risk per 80 mg increase | 0.01 | Lock et al26§ |
| Disability weights for colorectal cancer: | Murray and Lopez12¶ | |
| Diagnosis and treatment | 0.80 | |
| Watchful waiting | 0.80 | |
| Metathesis | 0.25 | |
| Terminal | 0.19 |
Estimates of incidence and case fatality reductions were derived from modelling the above data and are listed in table A3.1 in appendix 3 on bmj.com.
*Consensus values from systematic literature reviews for the US Office of Technology Assessment.
†Highest available level of evidence, from a single case-control study.
‡Largest available health promotion campaign, in state of Victoria, Australia.
§Meta-analysis of available literature.
¶Burden of Disease study following standard WHO-CHOICE methods.
For breast cancer, we evaluated lumpectomy with auxiliary dissection supplemented with external radiotherapy to the breast for stage I and II cancer; for stage III cancer, we evaluated neoadjuvant chemotherapy followed by mastectomy with auxiliary dissection supplemented with adjuvant chemotherapy including external breast radiotherapy; and for stage IV cancer, we evaluated systemic chemotherapy. All interventions included endocrine therapy for eligible patients. We also considered combinations of treatment strategies, with and without the implementation of a breast awareness program and early case finding through biannual mammography screening in women aged 50–70 years. Details on assumptions on intervention effectiveness are provided in table 3, and the modelling design is provided in appendix 1 on bmj.com.
For cervical cancer, screening interventions (plus removal of lesions as required) included the smear test, testing for human papillomavirus (HPV) DNA, visual inspection with acetic acid, and combinations of smear test with HPV DNA testing at various frequencies. HPV vaccination in a scenario where a booster dose is required every 10 years5 16 assumed an efficacy of 100% against viral genotypes 16 and 18,17 which together account for around two thirds of cervical cancers in low income countries.18 19 20 Treatment of cervical cancer included chemotherapy, radiotherapy, and surgery. Details of assumptions on intervention effectiveness are provided in table 4, and the modelling design is provided in appendix 2 on bmj.com.
For colorectal cancer, a range of single screening (at age 50years) and repeated screening (every five or 10 years) strategies were assessed, including faecal occult blood test, sigmoidoscopy, colonoscopy, and (despite uncertain evidence as to its efficacy) digital rectal examination, with subsequent removal of polyps and cancerous lesions as needed. The estimated impact of these strategies on the incidence of colorectal cancer ranged from 2.6% (single screening at age 50 with faecal occult blood test) to over 50% (such as colonoscopy every 10 years, annual faecal occult blood test plus sigmoidoscopy every five years).6 Treatment strategies included radiotherapy, chemotherapy, and surgery. In addition, the preventive effect of a mass media campaign focused on increasing fruit and vegetable consumption was considered. Details on assumptions on intervention effectiveness are provided in table 5, and the modelling design is provided in appendix 3 on bmj.com.
At present, cancer control strategies in many sub-Saharan African and South East Asian countries mainly rely on treatment of (often) advanced cases in referral hospitals, with treatment availability varying widely in and among countries in the regions. At present, there is low to very low coverage of cervical cancer vaccination or screening programmes in the regions27: in South Africa coverage of smear test screening is around 10%, while in India it is less than 1%.28 However, screening by visual inspection with acetic acid is likely to be more common. Screening programmes for colorectal or breast cancer29 are virtually absent.
Intervention costs
WHO-CHOICE employs an ingredients approach to costing, such that resources used in the implementation of an intervention (such as outpatient visits or diagnostic tests) are specified in detail, and the unit costs of these resources are determined separately. For example, for the breast cancer analysis, patient level patterns of resource use (that is, initial evaluation, local treatment, and follow-up) were based on clinical practice guidelines,30 31 and are summarised by Groot et al.4 Since only a small proportion of all presenting women are diagnosed with breast cancer, most of the resources used for initial evaluation correspond to women diagnosed as not having breast cancer. Screening in the extensive cancer programme included mammographic screening of women aged 50–70 years, with further diagnostic tests on referral. Stage-specific treatment protocols for treating cervical cancer were based on standard practice in high income countries.32 33 Resource quantities for the delivery of screening tests and treatment procedures for cervical and colorectal cancer (staff salaries, room use, drugs, and disposable and reusable equipment) were retrieved from a South African database.34 Beyond these facility level resources, estimates of the resources needed to set up and maintain screening programmes were generated, based on a standard procedure35 and predicted numbers of human and other resources required to implement the programmes (such as four or five administrative posts per million population for notification, coordination, follow-up, and monitoring activities5 6). Details on resource use patterns are provided in appendices 1–3 on bmj.com.
Unit costs of non-traded goods—including salaries of health and administrative workers as well as inpatient and outpatient services—were retrieved from the WHO-CHOICE database (www.who.int/choice/costs), which reports region-specific values derived from econometric estimation.36 Drug prices were obtained from the International Drug Price Indicator Guide, marked up for international and local transportation costs.37 38 Unit costs of laboratory, diagnostic, and screening tests, as well as surgical procedures, derived on the basis of the aforementioned South African database, are provided in appendices 1–3.
Unit costs were combined with resource use patterns (described in more detail in appendices 1–3) to estimate costs per patient treated. Total patient costs in the population were then calculated as the cost per patient treated multiplied by the number of patients treated (calculated from the modelled annual incidence of disease multiplied by the coverage level and the proportion of cases diagnosed and treated in the covered population). All costs were reported in international dollars ($Int) for year 2005 to facilitate more meaningful comparisons across regions ($Int1 buys the same quantity of healthcare resources in the sub-Saharan African and South East Asian regions as it does in the United States). Cost estimates in sub-Saharan Africa in international dollars should be divided by a factor 2.3 to obtain US dollar cost estimates for Kenya (in South East Asia cost estimates should be divided by a factor of 3.1 to obtain US$ cost estimates for India).8 All costs and effects are discounted at 3%, following standardised WHO-CHOICE analysis.9
Cost effectiveness
Dividing total implementation costs of each intervention by its effects generates a simple average cost effectiveness ratio relative to a comparator situation of no intervention. In addition, incremental cost effectiveness ratios are reported for the successive set of interventions that would be selected at expanding levels of resource availability, starting with the intervention with the lowest cost per DALY averted, then moving to the next most cost effective combination intervention out of the remaining available set of interventions. An intervention that is more costly or less effective than other more efficient interventions is denoted as “dominated.”
Uncertainty
Estimating the cost effectiveness of interventions is inherently uncertain. To deal with this, we plot results on a double logarithmic scale, so as to ascertain order of magnitude differences (such as $Int10–100 v $Int100–1000 per DALY averted). Second, we classify results according to defined cost effectiveness thresholds: WHO-CHOICE calls an intervention yielding a healthy year of life for less than three times gross domestic product (GDP) per capita “cost effective,” and an intervention yielding a healthy year of life for less than the GDP per capita “very cost effective.” In the sub-regions considered here an intervention yielding a DALY for <$Int2000 is considered highly cost effective. Interventions yielding a DALY at a cost greater than three times GDP per capita (>$Int6000) are considered not cost effective, while those with a cost effectiveness ratio falling between $Int2000 and $Int6000 are considered cost effective.39 Finally, for the subset of interventions that are not dominated and therefore fall on the cost effectiveness frontier, we undertook a probabilistic uncertainty analysis using the MCLeague software program.40 We also assessed the impact of removing age weights or discounting on baseline results via one way sensitivity analysis for interventions with 95% coverage.
Results
Cost, effects, and cost effectiveness of interventions are listed in tables 6 and 7 for sub-Saharan Africa and South East Asia and are rank ordered on the basis of their incremental cost effectiveness ratios (the tables do not include dominated interventions that are more costly or less effective than other interventions). The focus here is on determining the most efficient set of interventions, first within and then across the disease specific groups (costs, effects, and cost effectiveness of all interventions are listed in appendices 4–6 on bmj.com for cervical, colorectal and breast cancer respectively).
Table 6.
Costs, effects, and cost effectiveness of interventions to combat breast, cervical, and colorectal cancer in WHO sub-Saharan African sub-region AfrE
| Intervention | Coverage (%) | Annual cost per capita ($Int) | Annual DALYs averted per million population | Cost effectiveness ratio | Rank* | ||
|---|---|---|---|---|---|---|---|
| Average | Incremental | ||||||
| Breast cancer | |||||||
| BRE-6: Optimal programme (treatment of stages I–IV cancer, plus biannual mammographic screening) | 50 | 0.68 | 313 | 2248 | 2248 | 8 | |
| BRE-12: Optimal programme | 80 | 1.09 | 501 | 2253 | 2261 | 9 | |
| BRE-18: Optimal programme | 95 | 1.34 | 595 | 2323 | 2696 | 10 | |
| Cervical cancer | |||||||
| CVC-129: Smear test at age 40 (with lesion removal) + cancer treatment | 50 | 0.14 | 462 | 307 | 307 | 1 | |
| CVC-4: Treatment of invasive cancer (by surgery, chemotherapy, and/or radiotherapy) | 95 | 0.24 | 606 | 401 | 702 | 4 | |
| CVC-51: Smear test at age 40 + HPV vaccinations starting at age 12 at cost of US$0.60 per vaccine dose + cancer treatment | 95 | 0.41 | 829 | 497 | 756 | 5 | |
| CVC-35: VIA at age 40 + HPV vaccine from age 12 at US$0.60 per vaccine dose + cancer treatment | 95 | 0.42 | 834 | 500 | 972 | 6 | |
| CVC-49: VIA at ages 35, 40, 45 + HPV vaccine from age 12 at US$0.60 per vaccine dose+ cancer treatment | 95 | 0.48 | 872 | 550 | 1675 | 7 | |
| CVC-37: Smear test every five years for ages 20–65 + HPV vaccine from age 12 at US$0.60 per vaccine dose+ cancer treatment | 95 | 0.72 | 934 | 772 | 3906 | 12 | |
| CVC-34: Smear test every three years for ages 20–65 + HPV vaccine from age 12 at US$0.60 per vaccine dose+ cancer treatment | 95 | 0.92 | 950 | 970 | 12 425 | 14 | |
| CVC-43: Smear test every five years for ages 20–30 then smear test with HPV vaccination every five years for ages 30–65 + HPV vaccine from age 12 at US$0.60 per vaccine dose + cancer treatment | 95 | 1.00 | 956 | 1048 | 13 705 | 15 | |
| CVC-33: Annual smear test for ages 20–65 + HPV vaccine from age 12 at US$0.60 per vaccine dose+ cancer treatment | 95 | 1.41 | 971 | 1456 | 27 139 | 17 | |
| CVC-39: Annual smear test for ages 20–30 + then annual smear test with HPV vaccination every five years for ages 30–65 + HPV vaccine from age 12 at US$0.60 per vaccine dose+ cancer treatment | 95 | 2.73 | 984 | 2773 | 100 075 | 18 | |
| Colorectal cancer | |||||||
| CRC-35: Cancer treatment (by surgery, chemotherapy, and/or radiotherapy) | 80 | 0.27 | 792 | 336 | 336 | 2 | |
| CRC-10: Cancer treatment | 95 | 0.35 | 1031 | 336 | 337 | 3 | |
| CRC-18: Colonoscopy at age 50 (with surgical removal of polyps) + cancer treatment | 95 | 0.65 | 1115 | 585 | 3630 | 11 | |
| CRC-14: Colonoscopy screening every 10 years + cancer treatment | 95 | 0.87 | 1138 | 766 | 9598 | 13 | |
| CRC-15: Annual faecal occult blood test + sigmoidoscopy every 5 years (with surgical removal of polyps) + cancer treatment | 95 | 1.10 | 1153 | 952 | 15 548 | 16 | |
HPV=human papillomavirus, VIA=visual inspection with acetic acid.
*Rank ordered on the basis of incremental cost effectiveness ratios.
Table 7.
Costs, effects, and cost effectiveness of interventions to combat breast, cervical, and colorectal cancer in WHO South East Asian sub-region SearD
| Intervention | Coverage (%) | Annual cost per capita ($Int) | Annual DALYs averted per million population | Cost effectiveness ratio | Rank* | ||
|---|---|---|---|---|---|---|---|
| Average | Incremental | ||||||
| Breast cancer | |||||||
| BRE-6: Optimal programme (treatment of stages I–IV cancer plus biannual mammographic screening) | 50 | 0.87 | 201 | 4338 | 4338 | 8 | |
| BRE-12: Optimal programme | 80 | 1.40 | 321 | 4362 | 4401 | 9 | |
| BRE-18: Optimal programme | 95 | 1.68 | 381 | 4399 | 4596 | 10 | |
| Cervical cancer | |||||||
| CVC-129: Smear test at age 40 (with lesion removal) + cancer treatment | 50 | 0.19 | 1327 | 142 | 142 | 1 | |
| CVC-4: Treatment of invasive cancer by surgery, chemotherapy, and/or radiotherapy | 95 | 0.27 | 1507 | 182 | 477 | 3 | |
| CVC-23: Smear test at age 40 + cancer treatment | 95 | 0.46 | 1755 | 264 | 757 | 4 | |
| CVC-7: VIA at age 40 (with lesion removal) + cancer treatment | 95 | 0.48 | 1765 | 269 | 1240 | 5 | |
| CVC-21: VIA at ages 35, 40, and 45 (with lesion removal) + cancer treatment | 95 | 0.53 | 1796 | 294 | 1719 | 6 | |
| CVC-17: Smear test at ages 35, 40, and 45 (with lesion removal) + cancer treatment | 95 | 0.55 | 1803 | 303 | 2886 | 7 | |
| CVC-34: Triennial smear test for ages 20–65 + HPV vaccinations starting at age 12 at cost of US$0.60 per vaccine dose+ cancer treatment | 95 | 0.85 | 1822 | 467 | 16 051 | 13 | |
| CVC-41: Triennial smear test for ages 20–30 then triennial smear test with HPV vaccination for ages 30–65+ HPV vaccinations starting at age 12 at cost of US$0.60 per vaccine dose + cancer treatment | 95 | 1.41 | 1837 | 770 | 36 764 | 15 | |
| CVC-39: Annual smear test for ages 20–30 then annual smear test with HPV vaccination for ages 30–65+ HPV vaccinations starting at age 12 at cost of US$0.60 per vaccine dose + cancer treatment | 95 | 2.77 | 1854 | 1493 | 81 629 | 17 | |
| Colorectal cancer | |||||||
| CRC-10: Cancer treatment by surgery, chemotherapy, and/or radiotherapy | 95 | 0.31 | 868 | 362 | 362 | 2 | |
| CRC-17: Sigmoidoscopy at age 50 (with removal of polyps) + cancer treatment | 95 | 0.51 | 891 | 574 | 8291 | 11 | |
| CRC-18: Colonoscopy at age 50 (with removal of polyps) + cancer treatment | 95 | 0.73 | 914 | 794 | 9318 | 12 | |
| CRC-14: Colonoscopy screening every 10 years + cancer treatment | 95 | 1.04 | 926 | 1124 | 28 017 | 14 | |
| CRC-15: Annual faecal occult blood test + sigmoidoscopy every 5 years (with surgical removal of polyps) + cancer treatment | 95 | 1.63 | 939 | 1735 | 42 940 | 16 | |
VIA=visual inspection with acetic acid, HPV=human papillomavirus.
*Rank ordered on the basis of incremental cost effectiveness ratios.
In both regions, certain interventions in cervical cancer control (that is, screening with smear testing or visual inspection with acetic acid in combination with treatment) and colorectal cancer control (increasing the coverage of treatment interventions) cost <$Int2000 per DALY averted and can thus be considered highly cost effective. In the African sub-region, screening for colorectal cancer (by colonoscopy at age 50 in combination with treatment) costs <$Int6000 per DALY averted and can be considered cost effective. In both regions, certain interventions in breast cancer control (treatment of all stages in combination with mammography screening) cost between $Int2000 and $Int6000 per DALY averted and can be considered cost effective. Below we discuss the findings in detail.
In breast cancer control, treatment of all stages in combination with mammography screening costs $Int2248–4596 per DALY averted in both regions. At an optimal coverage level of 95%, this optimal programme would avert 381 and 595 DALYs per million population in South East Asia and sub-Saharan Africa respectively, at a cost of between $Int1.38 and $Int1.68 per capita (that is, around US$0.45–0.55). In both regions treatment of stage I cancer costs between $Int3800 and $Int4548 per DALY averted, whereas treatment of stage IV costs >$Int49 000 per DALY averted and is the least cost effective option (these interventions are less effective or more costly than other combination in breast cancer control and are therefore not reported in tables 6 and 7).
For cervical cancer, screening 50% of the target population through a single smear test at age 40, with lesion removal and treatment as required, represents the single most cost effective strategy in both sub-Saharan Africa and South East Asia ($Int307 and $Int142 per DALY averted respectively). In both regions, the next most cost effective intervention is treatment of invasive cancer with an appropriate combination of surgery, chemotherapy, and radiotherapy. In both regions, screening by means of visual inspection with acetic acid instead of the smear test is slightly more effective but also more costly, and therefore less cost effective. In sub-Saharan Africa adding an HPV vaccination programme to the provision of smear tests at age 40 and treatment as required can be considered very cost effective if a cost per dose of US$0.60 can be realised. In the South East Asia, an HPV vaccination programme is not cost effective even at the same low vaccine price. Adding a booster vaccination every 10 years in addition to such strategies has a negligible impact on health outcomes but substantially increases costs and hence incremental cost effectiveness values.
In colorectal cancer control, the most cost effective strategy is the increased coverage of treatment interventions: at 95% coverage, this would avert 792 and 868 DALYs per million people in South East Asia and sub-Saharan Africa respectively, at a cost of around $Int0.30 per capita in both regions (that is, around US$0.10). Once treatment has been scaled up, it would still be cost effective to introduce colonoscopy screening at age 50 in sub-Saharan Africa. The incremental cost and cost effectiveness of all other assessed interventions makes them much less attractive options.
The incremental cost and cost effectiveness of these interventions are shown in figures 1 and 2, which include only interventions considered cost effective (with a cost <$Int6000 per DALY averted). These graphs reveal the cost implications of adding successively less cost effective or more comprehensive interventions, showing, for example, that the cumulative cost per capita associated with the provision of one of the more cost effective interventions for each of the three cancers is less than $Int1 in both regions.

Fig 1 Incremental cost and cost effectiveness of interventions to combat breast, cervical, and colorectal cancer in WHO sub-Saharan African sub-region AfrE. See table 6 for explanation of intervention codes

Fig 2 Incremental cost and cost effectiveness of interventions to combat breast, cervical, and colorectal cancer in WHO South East Asian sub-region SearD. See table 7 for explanation of intervention codes
The probabilistic uncertainty analysis depicted in figures 3 and 4 shows the impact of plausible variations in total costs and total effects and shows that the average cost effectiveness ratio of most interventions would retain their classification of highly cost effective or cost effective, after taking into account such uncertainty. A similar logic would apply to the incremental cost effectiveness ratios. One way sensitivity analysis (appendix 7 on bmj.com) shows that, for both sub-regions and all three diseases, removing age weights in the calculation of DALYs has a moderate impact on cost effectiveness (cost effectiveness ratio rising slightly or falling by up to 20%). Removing discounting as well as age weighting had a far larger influence, increasing health outcomes and thereby lowering (improving) cost effectiveness values markedly (by 45–90%).
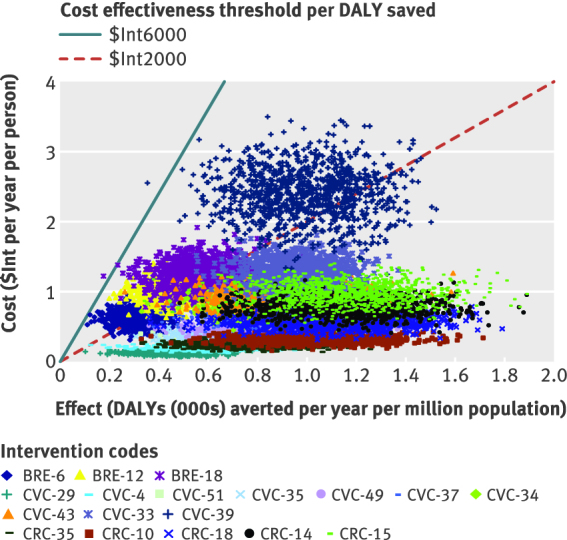
Fig 3 Probabilistic uncertainty analysis of interventions to breast, cervical and colorectal cancer in WHO sub-Saharan African sub-region Afr-E. See table 6 for explanation of intervention codes

Fig 4 Probabilistic uncertainty analysis of interventions to breast, cervical and colorectal cancer in WHO South East Asian sub-region Sear-D. See table 7 for explanation of intervention codes
In addition, we performed a sensitivity analysis on the price of HPV vaccines: the approximate threshold price for HPV vaccine to become very cost effective is US$6 in sub-Saharan Africa and US$9 in South East Asia. If booster doses are required every 10 years, a cost as low as US$1.30 in sub-Saharan Africa and US$0.90 in South East Asia is required to render the intervention cost effective (data not shown).
Discussion
Principal findings
Our analyses suggest that several highly cost effective interventions to combat cervical and colorectal cancer are available in sub-Saharan Africa and South East Asia. For cervical cancer, these include screening through smear testing or visual inspection with acetic acid in combination with treatment. For colorectal cancer, increasing treatment coverage is highly cost effective (screening through colonoscopy is cost effective in the African sub-region). For breast cancer, mammography screening in combination with treatment of all cancer stages is cost effective.
Policy implications
For breast cancer control, our analyses show that treating early stage breast cancer is more cost effective than treating late stage disease. Results indicate that priorities in national breast cancer control should be the implementation of an extensive programme including active mammography screening and treatment of all stages. Although such a programme reflects the economic attractiveness of diagnosing breast cancer at an earlier stage, many developing countries may not be able to meet its total costs (including the required infrastructure, logistics, and expertise). Given the limited available resources, priorities are probably best directed at treatment of early stage disease and at developing a less expensive means of early diagnosis. We did not evaluate clinical breast examination or breast self examination because currently there is no consensus on their value, either alone or in addition to mammography. However, together with other ways of raising awareness, they could be cost effective means by which to diagnose breast cancer earlier in resource poor settings.
For cervical cancer control, an increased coverage of treatment services and low cost screening programmes such as with smear testing or visual inspection with acetic acid are both economically very attractive in both regions. Increasing treatment coverage is challenging and requires ample investments in hospital infrastructure (especially in rural areas) and the training of staff in surgery, chemotherapy, and radiotherapy. Also the implementation of screening through smear tests is complex and requires routine availability of laboratory facilities. In that respect, implementation of screening by means of visual inspection with acetic acid, which does not require laboratory facilities, may be less complex.
In sub-Saharan Africa an HPV vaccination programme could also be considered if vaccine prices were low. However, analyses of the effect of HPV vaccination have a greater level of uncertainty41 42: for example, there is no observational evidence on the duration of efficacy (conservatively assumed to be 10 years in our analysis), and the price is unknown. We assumed a vaccine price as low as US$0.60, based on a figure twice that of the current yellow fever vaccine and the precedent of falling costs of hepatitis B vaccine in the 1990s. At the current price (US$40–100 per dose in developed countries), the HPV vaccine may not necessarily be cost effective in developed, let alone in developing, countries. An additional question is the acceptability of vaccination to prevent cervical cancer initially aimed at 12 year old girls, especially in religious cultures.43 However, it should be noted that the reported cost effectiveness ratios for HPV vaccination are upwardly biased in the sense that our model did not take into account the burden of condyloma44 or recurrent respiratory papillomatosis45 on health systems, nor the potential cost savings or DALY reductions when a quadravalent vaccine is used.46 47 Targeting screening and vaccinations towards people infected with HIV could improve cost effectiveness, since HIV infection is associated with elevated risk of cervical cancer.48 A more sensitive but less specific HPV test (carelHPV) will soon be available in developing countries at a far lower cost than the Hybrid Capture II test49. This is likely to improve the cost effectiveness of HPV DNA testing.
For colorectal cancer control, increasing the low level of treatment coverage is the most cost effective intervention in both the regions considered here. Screening by colonoscopy at age 50 in combination with treatment is also cost effective in sub-Saharan Africa. The use of digital rectal examination is not cost effective despite its low cost, as only a small percentage of polyps can be detected. However, the cost effectiveness ratio of digital rectal examination is overestimated as our model did not include the potential effects of reducing mortality from prostate cancer. We also evaluated the introduction of a campaign to encourage consumption of fruit and vegetables and the provision of price subsidies for fruit and vegetables, but these are able to avert only a modest level of disease burden and are accordingly not cost effective in relation to their effect on colorectal cancer alone. However, such campaigns might be cost effective when possible protective effects on other diseases are taken into account.
Comparison with other studies
Several studies have reported on the global and regional cost effectiveness of interventions targeting breast, cervical, and colorectal cancer.4 5 6 However, these have been carried out in isolation, which prevents direct comparison of the cost effectiveness of the different interventions in cancer control. In addition, these studies were analysed using year 2000 demographics and price levels. Our study directly compares cost and effects of interventions targeting breast, cervical, and colorectal cancer using more recent prices. This allows the identification of most efficient strategies to improve cancer control in the regions considered. For example, our analyses show that certain interventions in cervical cancer and colorectal cancer control are more cost effective than others in breast cancer control in both the considered regions .
Strengths and limitations of study
As well as the limitations of these cancer-specific models, some more general shortcomings need to be mentioned. Firstly, our analysis considers costs and effectiveness of interventions, but it does not address health systems constraints that add difficulties to the actual implementation of the interventions. For cancer control strategies, constraints may be in terms of infrastructure, logistics, and expertise, and these factors should be taken into account when making actual decisions about control strategies. For example, the expansion of colonoscopy services for colorectal cancer control or mammography screening for breast cancer control will be constrained by lack of trained health staff. Likewise, the successful implementation of cervical smear testing and screening for HPV DNA will depend on laboratory capacity. Also, issues of acceptability may play a role—such as of the HPV vaccine.50 We therefore stress that cost effectiveness analysis should be considered as only one input in the decision making process and should not be used in a formulaic way.
Secondly, for some interventions, assumptions on effectiveness were based on studies in other (high income) settings (many under trial conditions) in the absence of local evidence. This may overestimate the effectiveness that can be achieved in the regions of analysis, and therefore the economic attractiveness of interventions. However, our uncertainty analysis indicates that study results are robust to alternative assumptions. Thirdly, and closely related, patterns of resource use were sometimes based on clinical practice guidelines in Western settings—such as in the cost analysis of breast cancer treatment. The relevance of these guidelines was then carefully assessed and adjusted where necessary (see Groot et al4 for more detail).
Fourthly, we did not evaluate all possible interventions in cancer control, and our selection of interventions for analysis was pragmatic and somewhat arbitrary. Policy makers should be aware of this, and should not limit their choice of interventions to those included in this analysis. Fifthly, the analyses did not include economies of scale resulting from the joint provision of breast, cervical, or colorectal cancer interventions. In reality, cost savings may be realised when breast and cervical cancer screening are jointly organised. Sixthly, in the absence of reliable data, the analyses did not include time and travel costs of patients seeking or undergoing care, nor did it include changes in productivity as a result of the interventions.51 52 53 Seventhly, the analysis evaluates interventions at 50%, 80%, and 95% geographic coverage levels, following standard WHO-CHOICE methodology. The higher coverage levels may not be achievable in the short term but are included to indicate the long term efficiency resulting from economies of scale as more people are reached.54 Lastly, analyses are carried out at the regional level, but important differences in costs and effectiveness of interventions may exist between countries in the same region. Since decision making is made at the country (as opposed to regional) level, more refined estimates of costs, effects, and cost effectiveness should be made at the county level, based on country-specific data. A good example is the contextualisation of WHO-CHOICE regional results to the country level in Mexico, as reported in this series.55
The above limitations should be considered in the overall aim of WHO-CHOICE analysis to provide broad indications—that is, a crude, bird’s eye view on the cost effectiveness of a range of interventions—to inform general policy discussions rather than to deliver precise estimates on a specific intervention.7 8 9
What is already known on this topic
Several studies have reported on the global and regional cost effectiveness of interventions targeting breast, cervical, and colorectal cancer
These studies have been carried out in isolation, preventing direct comparison of the cost effectiveness of the different interventions
In addition, these studies have been analysed using year 2000 demographics and price levels
What this study adds
This study directly compares, using standardised methodology, cost and effects of interventions targeting breast, cervical, and colorectal cancer using more recent price levels
Analyses show that several highly cost effective interventions to combat cervical and colorectal cancer are available in sub-Saharan Africa and South East Asia, including screening for cervical cancer through smear testing or visual inspection with acetic acid in combination with treatment, and increasing treatment coverage for colorectal cancer (screening through colonoscopy is also cost effective in the African sub-region)
For breast cancer control, mammography screening in combination with treatment of all stages is cost effective
We thank Stephen Lim for technical input on modelling the effectiveness of colorectal cancer interventions, Cecilia Sepulveda for advice regarding treatment of colorectal and cervical cancers, Ben Johns for advice regarding cost estimation, Inbar Ben-Shahar for detailing the treatment modes for cervical cancer, and Dan Chisholm for editorial work related to this paper and series.
Contributors: All authors contributed to the study conception and design, interpretation of data, and drafting of the manuscript. GG, SZ, and SB performed the technical analysis. All authors approved the submitted version of the manuscript. GG is the guarantor of the manuscript.
Funding: No external funding or sponsorship.
Competing interests: All authors have completed the ICMJE uniform disclosure form at www.icmje.org/coi_disclosure.pdf (available on request from the corresponding author) and declare: no support from any organisation for the submitted work; no financial relationships with any organisation that might have an interest in the submitted work in the previous 3 years; no other relationships or activities that could appear to have influenced the submitted work.
JAL is a staff member of the WHO. The authors alone are responsible for the views expressed in this publication and they do not necessarily represent the decisions, policy, or views of the WHO.
Ethical approval: Not required.
Data sharing: No additional data available
Cite this as: BMJ 2012;344:e614
Web Extra. Extra material supplied by the author
General appendix (referred to by all the papers in this cluster)
Appendices 1–3: Modelling design and estimated effects and costs of (1) breast cancer interventions, (2) cervical cancer interventions, (3) colorectal cancer interventions
Appendices 4–6: Annual costs, effects, and cost effectiveness of (4) cervical cancer interventions, (5) colorectal cancer interventions, (6) breast cancer interventions
Appendix 7: Sensitivity analysis on discounting and age-weighing, in Afr-E and Sear-D
References
- 1.World Health Organization. The global burden of disease: 2004 update. WHO, 2008.
- 2.Ortegon M, Lim S, Chisholm D, Mendis S. Cost effectiveness of strategies to combat cardiovascular disease, diabetes, and tobacco use in sub-Saharan Africa and South East Asia: mathematical modelling study. BMJ 2012;344:e607. [DOI] [PMC free article] [PubMed] [Google Scholar]
- 3.Chisholm D, Saxena S. Cost effectiveness of strategies to combat neuropsychiatric conditions in sub-Saharan Africa and South East Asia: mathematical modelling study. BMJ 2012;344:e609. [DOI] [PMC free article] [PubMed] [Google Scholar]
- 4.Groot MT, Baltussen R, Uyl-de Groot CA, Anderson BO, Hortobágyi GN. Costs and health effects of breast cancer interventions in epidemiologically different regions of Africa, North America, and Asia. Breast J 2006;129(suppl 1):S81-90. [DOI] [PubMed] [Google Scholar]
- 5.Ginsberg GM, Lauer JA, Johns B, Sepulveda C. Screening, prevention and treatment of cervical cancer: a global and regional generalized cost-effectiveness analysis. Vaccine 2009;27:6060-79. [DOI] [PubMed] [Google Scholar]
- 6.Ginsberg GM, Lim S, Lauer JA, Johns B, Sepulveda C. Prevention, screening and treatment of colorectal cancer: a global and regional generalized cost-effectiveness analysis. Cost Eff Resour Alloc 2010;8:2. [DOI] [PMC free article] [PubMed] [Google Scholar]
- 7.Evans DB, Tan-Torres Edejer T, Adam T, Lim S, the WHO-CHOICE Millennium Development Goals Team. Achieving the millennium development goals for health: evaluation of current health intervention strategies and future priorities in developing countries. BMJ 2005;331:1457-61. [DOI] [PMC free article] [PubMed] [Google Scholar]
- 8.Evans DB, Tan-Torres Edejer T, Adam T, Lim S, the WHO-CHOICE Millennium Development Goals Team. Achieving the millennium development goals for health: methods to assess the costs and health effects of interventions for improving health in developing countries. BMJ 2005;331:1137-40. [DOI] [PMC free article] [PubMed] [Google Scholar]
- 9.Tan Torres Edejer T, Baltussen RM, Adam T. Making choices in health: WHO guide to cost-effectiveness analysis. WHO, 2003.
- 10.Sankaranarayanan R, Black RJ, Parkin DM. Cancer survival in developing countries. International Agency for Research on Cancer, 1998:173.
- 11.Bland KI, Menck HR, Scott-Conner CE, Morrow M, Winchester DJ, Winchester DP. The National Cancer Data Base 10-year survey of breast carcinoma treatment at hospitals in the United States. Cancer 1998;83:1262-73. [DOI] [PubMed] [Google Scholar]
- 12.Murray CJL, Lopez AD. The global burden of disease: a comprehensive assessment of mortality and disability from diseases, injuries, and risk factors in 1990 and projected to 2020. Global burden of disease and injury series: volume 1. Harvard School of Public Health, 1996.
- 13.Norum J, Olsen JA, Wist EA. Lumpectomy or mastectomy? Is breast conserving surgery too expensive? Breast Cancer Res Treat 1997;45:7-14. [DOI] [PubMed] [Google Scholar]
- 14.Launois R, Reboul-Marty J, Henry B, Bonneterre J. A cost-utility analysis of second-line chemotherapy in metastatic breast cancer. Docetaxel versus paclitaxel versus vinorelbine. Pharmacoeconomics 1996;10:504-21. [DOI] [PubMed] [Google Scholar]
- 15.De Koning HJ, van Ineveld BM, van Oortmarssen GJ, de Haes JC, Collette HJ, Hendricks JH, et al. Breast cancer screening and cost-effectiveness; policy alternatives, quality of life considerations and the possible impact of uncertain factors. Int J Cancer 1991;49:531-7. [DOI] [PubMed] [Google Scholar]
- 16.Ginsberg GM, Fisher M, Ben-Shahar I, Bornstein J. Cost utility analysis of vaccination against HPV in Israel. Vaccine 2007;25:6677-91. [DOI] [PubMed] [Google Scholar]
- 17.Kim JJ, Ortendahl J, Goldie SJ. Cost-effectiveness of human papillomavirus vaccination and cervical cancer screening in women older than 30 years in the United States. Ann Intern Med 2009;151:538-45. [DOI] [PMC free article] [PubMed] [Google Scholar]
- 18.Munoz N, Bosch FX, Castellsague X, Diaz M, de Sanjose S, Hammouda D, et al. Against which human papillomavirus types shall we vaccinate and screen? The international perspective. Int J Cancer 2004;111:278-85. [DOI] [PubMed] [Google Scholar]
- 19.Clifford GM, Smith JS, Plummer M, Munoz N, Franceschi S. Human papillomavirus types in invasive cervical cancer worldwide: a meta-analysis. Br J Cancer 2003;88:63-73. [DOI] [PMC free article] [PubMed] [Google Scholar]
- 20.Francheschi S, Rajkumar T, Vaccarella S, Gajalakshmi V, Sharmila A, Snijders PJ, et al. Human papillomavirus and risk factors for cervical cancer in Chennai, India: a case-control study. Int J Cancer 2003;107:127-33. [DOI] [PubMed] [Google Scholar]
- 21.Goldie SJ, Khun L, Denny L, Pollack A, Wright TC. Policy analysis of cervical cancer screening strategies in low-resource settings: clinical benefits and cost-effectiveness. JAMA 2001;27:3107-15. [DOI] [PubMed] [Google Scholar]
- 22.Kim JJ, Wright TC, Goldie SJ. Cost-effectiveness of human papillomavirus DNA testing in the United Kingdom, The Netherlands, France, and Italy. J Natl Cancer Inst 2005;97:888-95. [DOI] [PubMed] [Google Scholar]
- 23.Wagner JL, Beheny CJ, Tunis SR, Ching A, US Congress, Office of Technology Assessment. Cost-effectiveness of colorectal cancer screening in average-risk adults, OTA-BP-H-146. US Government Printing Office, 1995.
- 24.Herrinton LJ, Selby JV, Friedman GD, Queensberry CP, Weiss NS. Case-control study of digital-rectal screening in relation to mortality from cancer of the distal rectum. Am J Epidemiol 995;142:961-4. [DOI] [PubMed]
- 25.Dixon H, Borland R, Segan C, Stafford H, Sindall C. Public reaction to Victoria’s “2 Fruit ‘n’ 5 Veg Every Day” campaign and reported consumption of fruit and vegetables. PrevMed 1998;27:572-82. [DOI] [PubMed] [Google Scholar]
- 26.Lock K, Pomerleau J, Causer L, Altmann DR, McKee M. The global burden of disease attributable to low consumption of fruit and vegetables: implications for the global strategy on diet. Bull World Health Organ 2005;83:100-8. [PMC free article] [PubMed] [Google Scholar]
- 27.Alliance for Cervical Cancer Prevention (ACCP). Improving screening coverage rates of cervical cancer prevention programs: a focus on communities. Issues in depth. No 4. ACCP, 2004.
- 28.Cervix Cancer Screening/IARC Working Group on the Evaluation of Cancer Prevention Strategies. IARC handbooks of cancer prevention. IARC, 2004.
- 29.Harford JB, Otero IV, Anderson BO, Cazap E, Gradishar WJ, Gralow JR, et al. Problem solving for breast health care delivery in low and middle resource countries (LMCs): consensus statement from the Breast Health Global Initiative. Breast 2011;20(suppl 2):S20-9. [DOI] [PubMed] [Google Scholar]
- 30.National Comprehensive Cancer Network. Clinical practice guidelines in oncology, version 1: breast cancer [guideline]. National Comprehensive Cancer Network, 2004.
- 31.MD Anderson Cancer Center. Clinical practice guideline of the MD Anderson Cancer Center: breast cancer [guideline]. MD Anderson Cancer Center, 2004.
- 32.Waggoner SE. Cervical cancer. Lancet 2003;361:2217-25. [DOI] [PubMed] [Google Scholar]
- 33.US National Institute of Health. National Cancer Institute recommendations. 2011. http://cancer.gov/cancertopics/pdq/treatment/cervical/healthprofessional.
- 34.World Health Organization, Department of Essential Health Technologies. Essential health care technology package (EHTP). WHO, 2005. www.who.int/medical_devices/appropriate_use/en.
- 35.Johns B, Baltussen R, Hutubessy R. Programme costs in the economic evaluation of health interventions. Cost Eff Resour Alloc 2003;1:1. [DOI] [PMC free article] [PubMed] [Google Scholar]
- 36.Adam T, Evans DB, Murray CJ. Econometric estimation of country-specific hospital costs. Cost Eff Resour Alloc 2003;1:3. [DOI] [PMC free article] [PubMed] [Google Scholar]
- 37.Management Sciences for Health. International drug price indicator guide. 2006. erc.msh.org/priceguide
- 38.Johns B, Baltussen R. Accounting for the cost of scaling up health interventions. Health Econ 2004;13:1117-24. [DOI] [PubMed] [Google Scholar]
- 39.WHO Commission on MacroEconomics and Health. Macroeconomics and health: investing in health for economic development. Report of the Commission on Macroeconomics and Health. World Health Organization, 2001.
- 40.Monte Carlo League. Software program for uncertainty analysis. 2011. www.who.int/choice/toolkit/mc_league/en/index.html.
- 41.Van de Velde N, Brisson M, Boily MC. Modelling human papilloma vaccine effectiveness: quantifying the impact of parameter uncertainty. Am J Epidemiol 2007;165:762-75. [DOI] [PubMed] [Google Scholar]
- 42.Newall AT, Beutels P, Wood JG, Edmunds WJ, Macintyre CR. Cost-effectiveness analyses of human papillomavirus vaccination. Lancet Infect Dis 2007;7:289-96. [DOI] [PubMed] [Google Scholar]
- 43.Bornstein J. Human papillomavirus vaccine: the beginning of the end for cervical cancer. Isr Med Assoc J 2007;9:156-8. [PubMed] [Google Scholar]
- 44.Bosch FX, Manos MM, Munoz N, Sherman M, Jansen AM, Peto J, et al. Prevalence of human papillomavirus in cervical cancer: a worldwide perspective. International Biological Study on Cervical Cancer Study Group. J Natl Cancer Inst 1995;87:796-802. [DOI] [PubMed] [Google Scholar]
- 45.Armstrong LR, Preston EJ, Reichert M, Phillips DL, Nisenbaum R, Todd NW, et al. Incidence and prevalence of recurrent respiratory papillomatosis among children in Atlanta and Seattle. Clin Infect Dis 2000;31:107-9. [DOI] [PubMed] [Google Scholar]
- 46.Alam M, Stiller M, Direct medical costs for surgical and medical treatment of condylomata acuminate. Arch Dermatol 2001;137:337-41. [PubMed] [Google Scholar]
- 47.Brown RE, Breugelmans JG, Theodoratou D, Bernard S. Costs of detection and treatment of cervical cancer, cervical dysplasia and genital warts in the UK. Curr Med Res Opin 2006;22:663-70. [DOI] [PubMed] [Google Scholar]
- 48.Clifford GM, Polesel J, Rickenbach M, Dal Maso L, Keiser O, Kofler A, et al. Cancer risk in the Swiss HIV Cohort Study: associations with immunodeficiency, smoking and highly active antiretroviral therapy. J Natl Cancer Inst 2005;97:425-32. [DOI] [PubMed] [Google Scholar]
- 49.Sankaranarayanan R, Nene BM, Shastri SS, Jayant K, Muwonge R, Budukh AM, et al. HPV screening for cervical cancer in rural India. N Engl J Med 2009;360:1385-94. [DOI] [PubMed] [Google Scholar]
- 50.Coleman MA, Levison J, Sangi-Haghpeykar H. HPV vaccine acceptability in Ghana, West Africa. Vaccine 2011: published online 8 April. [DOI] [PubMed]
- 51.Shireman TI, Tsevat J, Goldie SJ. Time costs associated with cervical cancer screening. Int J Technol Assess Health Care 1991;17:146-52. [DOI] [PubMed] [Google Scholar]
- 52.Brown ML, Fintor L. Cost-effectiveness of breast cancer screening: preliminary results of a systematic review of the literature. Breast Cancer Res Treat 1993;25:113-8. [DOI] [PubMed] [Google Scholar]
- 53.Boer R, de Konig HJ, van Ballegooijen M, van der Maas PJ. Important influences on effectiveness and costs to be considered in the evaluation of cancer screening. In: Duffy S, Hill C, Esteve J, eds. Quantitative methods of evaluation of cancer screening. Arnold, 2001:13-25.
- 54.Johns B, Baltussen R. Accounting for the cost of scaling-up health interventions. Health Econ 2004;13:1117-24. [DOI] [PubMed] [Google Scholar]
- 55.Salomon JA, Carvalho N, Gutiérrez-Delgado C, Orozco R, Mancuso A, Hogan DR, et al. Intervention strategies to reduce the burden of non-communicable diseases in Mexico: cost effectiveness analysis. BMJ 2012;344:e355. [DOI] [PMC free article] [PubMed] [Google Scholar]
Associated Data
This section collects any data citations, data availability statements, or supplementary materials included in this article.
Supplementary Materials
General appendix (referred to by all the papers in this cluster)
Appendices 1–3: Modelling design and estimated effects and costs of (1) breast cancer interventions, (2) cervical cancer interventions, (3) colorectal cancer interventions
Appendices 4–6: Annual costs, effects, and cost effectiveness of (4) cervical cancer interventions, (5) colorectal cancer interventions, (6) breast cancer interventions
Appendix 7: Sensitivity analysis on discounting and age-weighing, in Afr-E and Sear-D