Filter cubes made with machine-vision dichroic filters and illuminated with a royal blue light emitting diode can be used to produce an epifluorescent digital camera attachment that improves whole organism green fluorescent protein (GFP) photography. Mean pixel intensity responds linearly to purified GFP titration.
Abstract
Background and aims
Studies have shown that levels of green fluorescent protein (GFP) leaf surface fluorescence are directly proportional to GFP soluble protein concentration in transgenic plants. However, instruments that measure GFP surface fluorescence are expensive. The goal of this investigation was to develop techniques with consumer digital cameras to analyse GFP surface fluorescence in transgenic plants.
Methodology
Inexpensive filter cubes containing machine vision dichroic filters and illuminated with blue light-emitting diodes (LED) were designed to attach to digital single-lens reflex (SLR) camera macro lenses. The apparatus was tested on purified enhanced GFP, and on wild-type and GFP-expressing arabidopsis grown autotrophically and heterotrophically.
Principal findings
Spectrum analysis showed that the apparatus illuminates specimens with wavelengths between ∼450 and ∼500 nm, and detects fluorescence between ∼510 and ∼595 nm. Epifluorescent photographs taken with SLR digital cameras were able to detect red-shifted GFP fluorescence in Arabidopsis thaliana leaves and cotyledons of pot-grown plants, as well as roots, hypocotyls and cotyledons of etiolated and light-grown plants grown heterotrophically. Green fluorescent protein fluorescence was detected primarily in the green channel of the raw image files. Studies with purified GFP produced linear responses to both protein surface density and exposure time (H0: β (slope) = 0 mean counts per pixel (ng s mm−2)−1, r2 > 0.994, n = 31, P < 1.75 × 10⁻²⁹).
Conclusions
Epifluorescent digital photographs taken with complementary metal-oxide-semiconductor and charge-coupled device SLR cameras can be used to analyse red-shifted GFP surface fluorescence using visible blue light. This detection device can be constructed with inexpensive commercially available materials, thus increasing the accessibility of whole-organism GFP expression analysis to research laboratories and teaching institutions with small budgets.
Introduction
DNA sequences encoding green fluorescent protein (gfp) have become widely used in reporter genes because the encoded green fluorescent protein (GFP) can be detected without the addition of exogenous factors (Chalfie et al. 1994; Tsien 1998). As a result, gfp has become widely used in whole-plant experimentation, including studies on viral infection (Leffel et al. 1997; Rodman et al. 2002; Yambao et al. 2008), identification of transformed plant tissues (Leffel et al. 1997; Blumenthal et al. 1999; Halfhill et al. 2001; Molinier and Hahne 2002; Hraška et al. 2006) and the monitoring of potential gene flow from transgenic crops (Leffel et al. 1997; Stewart 2001; Stewart 2006). In whole-plant studies, ultraviolet (UV) light has often been used to observe GFP fluorescence (Leffel et al. 1997; Harper et al. 1999; Stewart 2001; Rodman et al. 2002; Halfhill et al. 2004, 2001; Zhu et al. 2004). There are potential problems in using UV light sources, such as cellular damage (Li et al. 2002; Kaiserli and Jenkins 2007) and potential injury to experimenters. Thus, there are significant advantages in detecting whole-plant GFP expression with visible light.
Fortunately, the original gfp sequence cloned from the bioluminescent jelly fish Aequorea victoria (Prasher et al. 1992) has been extensively modified to improve its use as a reporter gene. The wild-type protein has two excitation peaks: a major peak in the UV range and a minor peak in the visible blue range of the electromagnetic spectrum (Chalfie et al. 1994; Tsien 1998). Several gfp variants have been created by point mutations that change the spectral properties of encoded protein (Tsien 1998; Haseloff 1999; Patterson et al. 2001; Stewart 2001, 2006; Kremers et al. 2011). In one point mutant named gfp(S65T), a conversion of serine to threonine at position 65 produced a GFP with a spectrum shifted to the red portion of the visible light spectrum (Chiu et al. 1996). Additionally, it had 100 times greater quantum yield. Transgenic plants expressing the gfp(S65T) gene show little phototoxicity when illuminated by visible blue light (Niwa et al. 1999). Thus red-shifted gfp genes make ideal markers for in planta assays. A second point mutation has been added to gfp(S65T) that produced an F64L substitution in the GFP. The resulting protein has greater stability at 37 °C and is called enhanced GFP (EGFP) (Zhang et al. 1996).
Leaf surface fluorescence can be used to assess the amount of GFP present in the leaves. Studies involving direct comparison of surface fluorescence and GFP content in soluble protein extracts have shown linear relationships (Blumenthal et al. 1999; Harper et al. 1999; Richards et al. 2003; Halfhill et al. 2004). Green fluorescent protein leaf surface fluorescence can be measured with probes that clip onto leaves, laboratory-based fluorescent imaging systems (Niwa et al. 1999; Millwood et al. 2003; Richards et al. 2003; Halfhill et al. 2004; Stewart 2006) and dissecting fluorescent microscopes (Zhou et al. 2005; Jach 2006; Hraška et al. 2008; Yambao et al. 2008). Although all of these systems have specific advantages (Halfhill et al. 2004), they are all expensive. For example, Photon Systems Instruments (Brno-Řečkovice, Czech Republic), a manufacturer of a diverse array of plant fluorescence detection systems, sells GFP fluorescence imaging instruments that range in price from €13 990 (∼US$20 160) to €17 690 (∼US$25 500) (Website 1).
Consumer digital single-lens reflex (SLR) cameras are much less expensive than laboratory digital imaging systems and can capture images at very high resolution, typically ranging between 4 and 12 megapixels in a 16-bit format. They use either a complementary metal-oxide-semiconductor (CMOS) detector or a charge-coupled device (CCD) detector (Nakamura 2006). Digital SLR cameras have been used to develop a medical device that detects cells stained with fluorescent dyes (Shin et al. 2010). Here we report on the development of a device that uses blue light-emitting diode (LED) illumination and uses similar beam-splitting optics found in epifluorescent compound microscopes to detect red-shifted GFP fluorescence. It can be attached to digital SLR cameras and dissecting microscopes. The device allows for the quantification of red-shifted GFP surface fluorescence in pot-grown and Petri plate-germinated transgenic plants and in other organisms. The camera attachment can be assembled at a fraction of the cost of other fluorescent imaging systems.
Materials and methods
Plant materials and growth conditions
Arabidopsis thaliana (arabidopsis) lines were obtained from the Arabidopsis Biological Resource Center (Rhee et al. 2003). Wild-type plants were Columbia-O. Transgenic plants CS84732 (also known as LE8) (Cutler et al. 2000) expressed EGFP under the control of the cauliflower mosaic virus (CaMV) 35S promoter. Variegated im-1 mutant (CS3218) was an X-ray-generated mutant from ecotype Col-1 (Redei 1967). Seeds were sown onto hydrated Ferry-Morse (Fulton, KY, USA) peat pellets (no perlite or vermiculite) containing the recommended concentration of 24-8-6 Miracle Grow fertilizer (Scotts Co. LLC, Marysville, OH, USA). To produce more uniform germination, A. thaliana seeds were vernalized at 4 °C for 3 days. Salvia officinalis, variety tricolor sage, was purchased from a retail outlet. All plants were grown at 22 °C, 50 % relative humidity and 24-h illumination by cool white fluorescent light at a photosynthetically active radiation intensity of ∼125 µE m−2 s−1.
Photography and filter cube
Photographs were taken with a Canon EOS 30D camera (Canon USA, Lake Success, NY, USA) connected to a Canon EF100 mm f/2.8 Macro USM EF 100-mm lens, and a Nikon D80 camera (Nikon USA, Melville, NY, USA) connected to a Nikon 105-mm zoom lens. Photographs were taken in a darkroom or within a light-tight box and illuminated with a royal blue LED or with 4800-°K incandescent bulbs. Barrier filters tested included Quantaray YA2 (Ritz Camera, Beltsville, MD, USA), Hoya O [G] (Hoya Corporation, Tokyo, Japan), Nightsea BB (Nightsea, Andover, MA, USA), a yellow dichroic machine vision filter (Edmund Optics Inc., Barrington, NJ, USA) and a cyan dichroic machine vision filter (Edmund Optics). The illumination source was an Opto Technology (Wheeling, IL, USA) lamp containing a 5-W royal blue Luxeon V Star (Philips Lumileds Lighting Company, San Jose, CA, USA) 455-nm LED with 10 ° collimating acrylic optics attached to a machine vision magenta dichroic filter (Edmund Optical). Additional beam collimation was accomplished with convex lenses (Edmund Optical). The filter cube contained a 45° blue reflective (50 % reflection (R50 %) at 510 nm) dichroic filter (Edmund Optical). A diagram describing the construction of the filter cube is presented in Fig. 1. An alternative design, using more generally available materials, is presented in the Additional Information.
Fig. 1.
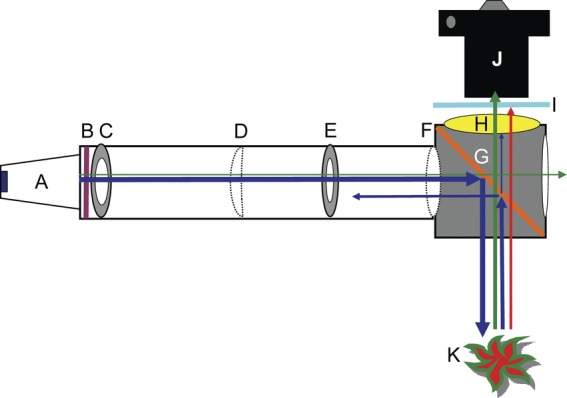
Light-emitting diode light source and filter cube attached to digital camera. (A) Royal blue LED (5 W) array with a 10° collimator. (B) Magenta dichroic glass excitation filter, 3 cm from the LED array. (C) Blackened washer with 18 mm inner diameter placed 4 cm from LED array. (D) Planoconvex f = 25 mm lens placed 10 cm from LED array. (E) Blackened washer with 14 mm inner diameter placed 14.5 cm from LED array. (F) Double convex f = 50 mm lens placed 19.5 cm from LED array. The blackened tube had an inner diameter of 25 mm. The filter cube, assembled out of 3 mm blackened Masonite, holds a 45° blue light reflective (G) dichroic filter and barrier filters made from yellow (H) and cyan (I) dichroic glass. The filter cube–LED assembly was attached to the digital camera (J) with a Cokin (Piktus, France) filter holder. The directions of blue, green and red light rays are shown with correspondingly coloured arrows. A GFP-expressing plant is shown (K).
Digital images were captured with the Canon EOS 30D in a series of exposures ranging from 1 to 20 s. Expanding cotyledons of 12- to 19-day-old seedlings were photographed in three biological replicates of the experiment.
Additional photographs were taken with the Canon EOS 30D (ISO 1600) attached to a Tritech Research (Los Angeles, CA, USA) model SMT1-FL fluorescent dissecting microscope using a GFP illumination system and a GFP filter set provided by the manufacturer. The density of 12-day-old seedlings was high enough to have two or more seedlings visible in the ×6 magnification. Expanded cotyledons were photographed. An exposure time of 2 s was used with the microscope and 0.5 s with the filter cube.
Spectrometry and chlorophyll
Spectra of dichroic filters and methanol leaf extracts were measured with a Shimadzu (Kyoto, Japan) UV-1201S scanning spectrophotometer. Chlorophyll extraction and measurements were performed as described by Meeks and Castenholz (1971). The diluent was 90 % methanol. To remove chlorophyll from wild-type arabidopsis, whole pot-grown plants were placed in 95 % ethanol in a 4 °C refrigerator overnight (Zhou et al. 2005).
GFP titration
Enhanced GFP purchased from Biovision (Mountain View, CA, USA) was diluted in 1 × phosphate-buffered saline (PBS) (Sambrook et al. 1989) and placed in blackened flat-bottom microtitre plates. Green channel counts observed in 1 × PBS wells were subtracted from the counts observed in EGFP-containing wells.
Etiolated plants
Arabidopsis seeds were surface sterilized (Valvekens et al. 1988) and sown on germination medium (GM) (Valvekens et al. 1988) modified by substituting 0.5 % Gelrite (Sigma, St Louis, MO, USA) for agar. Transgenic seeds were sown on GM containing 50 μg mL−1 kanamycin sulphate. To produce uniform germination, seeds were cold treated in the dark at 4 °C for 4 days. Seeds were germinated with the Petri plates in a vertical position for 9 days. Etiolated plants were grown in darkness at 22 °C. Control plants were grown in light (∼50 μE m−2 s−1) at 22 °C with a 16- h photoperiod.
Software
ImageJ 1.40g was downloaded from the National Institutes of Health website (Rasband, Website). The plug-in, DCRaw V.1.0.0 (Coffin, Website), was downloaded from Sourceforge (Website 2). Camera raw files were opened with DCRaw, without adding white balance, read as 16-bit linear files with an interpolation quality of three. Measurements were expressed as counts per pixel (cpp). The ImageJ ROI Tool was used to take measurements from serial images. Logarithmic TIFF files were created from the raw CR2 files using Digital Photo Professional (version 2.1.1.4; Canon USA, Lake Success, NY, USA) at its default setting (no white balance, gamma corrected). The raw file images obtained from plants grown on GM medium were processed using Adobe Photoshop CS3 (San Jose, CA, USA). The effects of media glare were reduced using the following setting: temp 7500, tint +30, exposure +2.80, brightness +50, contrast +25. Statistical analysis was conducted with Microsoft (Seattle, WA, USA) Excel 2007 (version 12.0.6504.5001).
Results
Developing a fluorescent detection system
In the initial experiments, green wild-type and transgenic arabidopsis plants expressing red-shifted GFP (Fig. 2A) were illuminated with a royal blue 5-W LED covered with a magenta dichroic filter. The resulting photographs with a CMOS SLR digital camera produced blue images (Fig. 2B). Consumer orange lens filters were effective in blocking reflected blue light and detected red fluorescence caused by chlorophyll (Fig. 2B versus C and D). However, no GFP expression was evident with a Quantaray YA2 filter (Fig. 2C) and only modest GFP fluorescence was detected with a Hoya O [G] filter. A yellow lens filter specially designed to photograph fluorescent marine organisms, the NightSea BB, was more effective in detecting GFP expression (Fig. 2E) but was not as effective in blocking reflected blue light, making the wild-type plants appear purple. Similar results were obtained when a long-pass yellow dichroic filter was used (Fig. 2F). When a short-pass cyan dichroic filter was added, chlorophyll fluorescence was effectively blocked (Fig. 2G). The GFP-expressing plants fluoresced green. However, reflected blue light was still visible in the photographs.
Fig. 2.
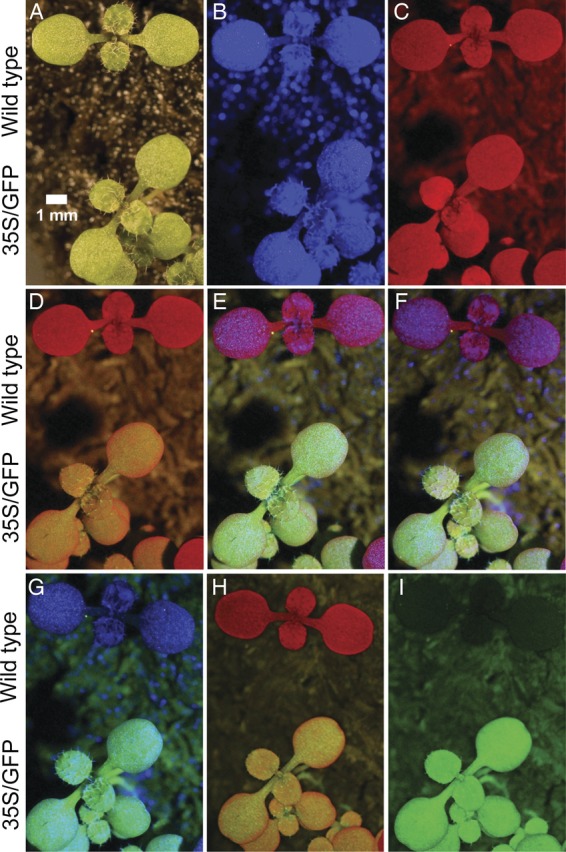
Photographs of GFP-expressing and non-expressing plants under different lighting sources and camera filters. Thirteen-day-old wild-type and GFP-expressing (35S/GFP) arabidopsis seedlings are shown. (A) White light with no barrier filter. (B)–(G) were illuminated with 5 W royal blue LED with magenta excitation filters, 30° tilt, 30 cm from plants producing a light intensity of 8700 lx. (B) No barrier filter. (C) Quantaray YA2 barrier filter. (D) Hoya O [G] barrier filter. (E) NightSea BB barrier filter. (F) Yellow dichroic glass barrier filter. (G) Combination of yellow and cyan glass barrier filters. (H) and (I) were illuminated with a filter cube, as described in Fig. 1. (H) Yellow dichroic glass barrier filter. (I) Combination of yellow and cyan dichroic glass barrier filters. The Canon EOS 30D camera was set with an aperture of 8.0 and an ISO of 1600.
Since none of the filter combinations was sufficient to produce artefact-free photographs, a filter cube containing inexpensive machine vision-enhancing dichroic filters was constructed (Fig. 1). The filter cube containing a single yellow dichroic barrier filter was effective in blocking reflected blue light, and allowed detection of both red chlorophyll fluorescence and green GFP fluorescence (Fig. 2H). A barrier filter consisting of a combination of yellow dichroic glass and cyan dichroic glass was effective in blocking red chlorophyll fluorescence while transmitting green GFP fluorescence. The resulting photograph produced high contrast between the wild-type plants and the GFP-expressing plants (Fig. 2I).
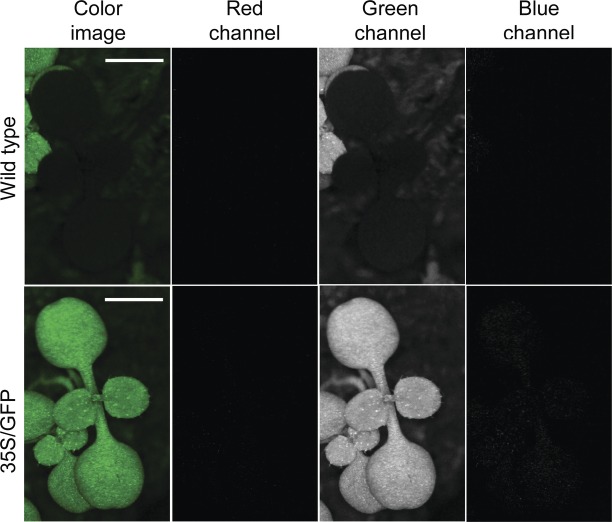
The computer program ImageJ (Rasband, Website) was used to characterize the fluorescent images. Photographs of wild-type arabidopsis taken using the filter cube described above produced images with dark leaves (Fig. 3). Transgenic plants expressing GFP showed green fluorescence. When the resulting gamma-corrected TIFF images were split into their three component colours, the red and blue channels produced dark images, and fluorescence was detected in the green channel. The sum of these results indicates that the filter cube blocks the blue reflected light, can block the red light produced by chlorophyll fluorescence when a cyan filter is added, and detects fluorescence in leaves caused by expression of red-shifted GFP.
Fig. 3.
Epifluorescent image of wild-type and GFP-expressing arabidopsis. Rows: wild-type (top) and transgenic (bottom) plants. Transcription of the GFP open reading frame was under the control of the CaMV 35S promoter (35S/GFP). Columns: colour TIFF images and the three grey-scale colour channels viewed using ImageJ. The Canon EOS 30D camera with a filter cube containing yellow and cyan barrier filters was set with an aperture of 8.0, an ISO of 1600 and an exposure time of 1.3 s. The light intensity was ∼11 660 lx. A 2 mm size standard is shown in both colour images.
Spectrophotometric scans (Fig. 4) confirmed that the machine vision dichroic filters were effectively combined to create a filter cube able to detect red-shifted GFPs. The excitation wavelength for EGFP is between 375 and 520 nm with a peak at 489 nm (Patterson et al. 2001). The combination of the magenta excitation filter and the 45 ° blue-light-reflecting dichroic filter illuminates specimens with light between ∼450 and ∼500 nm. Thus, the filter cube illuminates specimens within the EGFP excitation spectrum. Enhanced GFP emission is from ∼495 to ∼575 nm with the peak at 508 nm (Patterson et al. 2001). The long-pass dichroic yellow barrier filter starts to transmit light from ∼510 nm, thus allowing sufficient fluoresced light to pass for digital detection of EGFP expression. In planta, chlorophyll fluorescence ranges from ∼645 to ∼800 nm (Pedrós et al. 2008). The short-pass cyan filter blocks light above ∼595 nm. Thus the combination of a yellow dichroic filter and a cyan dichroic filter permits the light emitted from EGFP to enter the camera, but blocks red light emitted by the fluorescence of chlorophyll.
Fig. 4.
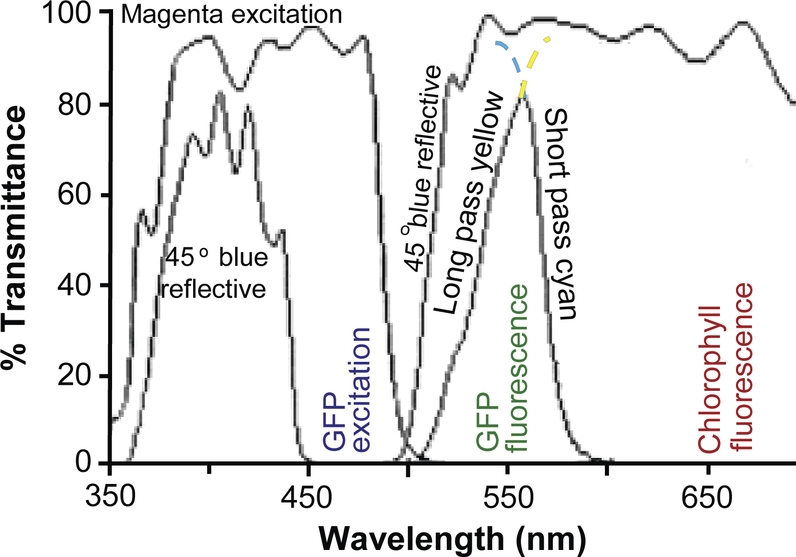
Spectrum of filter cube camera attachment. Transmittance spectra of the excitation filter (magenta excitation), a 45° dichroic beam-splitting filter (45° blue reflective), and the barrier filters consisting of both long-pass yellow dichroic glass and short-pass cyan glass are shown. The dotted lines are extrapolations if only single barrier filters were used. The portion of the spectrum that excites red-shifted GFP (GFP excitation) is labelled. The regions of the spectrum corresponding to red-shifted GFP fluorescence (GFP fluorescence) and in planta chlorophyll fluorescence (chlorophyll fluorescence) are labelled.
Characterization of GFP images
To evaluate the signal (GFP fluorescence) to noise (wild-type background) ratios, GFP-expressing and wild-type arabidopsis plants were photographed in series of exposure times. Linear regression (Fig. 5) of mean green pixel intensities measured from raw files showed positive correlations between GFP signal to background noise (r2 (coefficient of determination) = 0.9999–0.9985, H0 (null hypothesis): r (correlation coefficient) = 0, n = 10 for all observations, P (probability of accepting null hypothesis) = 1.25 × 10⁻¹³ to 3.58 × 10⁻¹¹, reject null hypothesis). All of the regression lines plot through the y-intercept of zero (H0: y-intercept = 0, P = 0.433–0.100, accept null hypothesis). The signal-to-noise ratio (GFP mean cpp per wild-type mean cpp), which is the slope of the regression lines, ranged between 16.452 and 3.4712. The greatest signal-to-noise ratio was observed when the filter cube was used. The yellow dichroic barrier filter produced a signal-to-noise ratio of 16.452. The combination yellow dichroic and cyan dichroic barrier filters produced a signal-to-noise ratio of 12.489. These results indicate that the filter cube improved the signal-to-noise ratio of the photographic images.
Fig. 5.
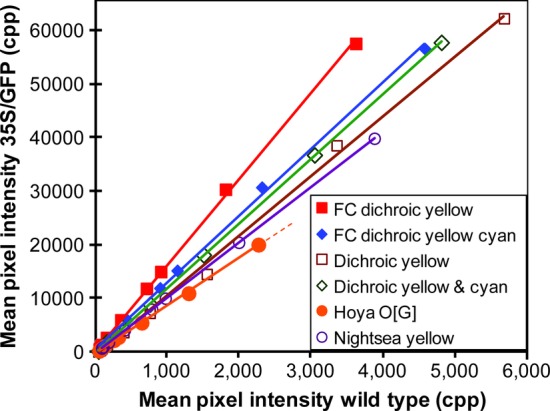
Comparing signal-to-noise ratios with different barrier filter combinations. Mixed populations of wild-type and transgenic plants expressing GFP under the control of the CaMV 35S promoter were grown in peat-based potting mix. Exposure times ranged from 0.05 to 5 s. Using direct illumination with the 5 W royal blue LED with magenta excitation filter (8700 lx), plants were photographed with Hoya O [G] filter, Nightsea yellow filter, yellow dichroic filter and yellow plus cyan dichroic filters. The filter cube (FC) illuminated the plants at 11 660 lx, using either a yellow dichroic barrier filter or a combination of yellow and cyan dichroic barrier filters. The camera was set with an aperture of 8.0 and an ISO of 1600. Pixel intensity measurements were taken from expanded cotyledons.
To compare the performance of the inexpensive filter cube attachment to that of a research-grade instrument, mixed populations of transgenic and wild-type plants were sown at a high enough density so that two or more seedlings could be photographed simultaneously. The mean signal-to-noise ratio for the dissecting scope was 4.99 (95 % confidence interval was 6.30–3.68, degrees of freedom (df) = 13). When the same population of plants was photographed with the filter cube, the mean signal-to-noise ratio was 5.81 (95 % confidence interval was 6.83–4.89, df = 15). When a two-sample t-test (two-sided, assuming unequal variance) was performed, the difference in the means was not statistically significant (t = 1.07, df = 26, P = 0.294).
Camera response to red-shifted GFP
To evaluate the responses of CMOS and CCD detectors to the signal produced by red-shifted GFP fluorescence, titration experiments with purified EGFP were conducted (Fig. 6). Since the amount of light entering a camera is determined by the surface area of the image, the EGFP content was expressed as EGFP density (ng mm−2). With 1-s exposures (Fig. 6A), the green channel of the raw image files produced a linear response with both the Canon CMOS detector (Fig. 6A, r2 = 0.995, n = 6, P = 1.40 × 10⁻⁴) and the Nikon CCD detector (r2 = 0.986, n = 7, P = 8.20 × 10⁻⁶, data not shown). The exposure time also determines the amount of light entering a camera. To confirm a linear response to exposure time, multiple exposures, ranging from 1 to 10 s, were taken of each EGFP titration measurement. When EGFP density × exposure time (ng s mm−2) was plotted against the resulting green channel raw file signal, the regression line showed a linear response for both the CMOS detector (Fig. 6B, r2 = 0.994, n = 31, P = 1.75 × 10⁻²⁹) and the CCD detector (Fig. 6C, r2 = 0.992, n = 65, P = 8.20 × 10−69). These results show that the raw files produced by SLR cameras can be used to measure fluorescence intensities of red-shifted GFPs.
Fig. 6.
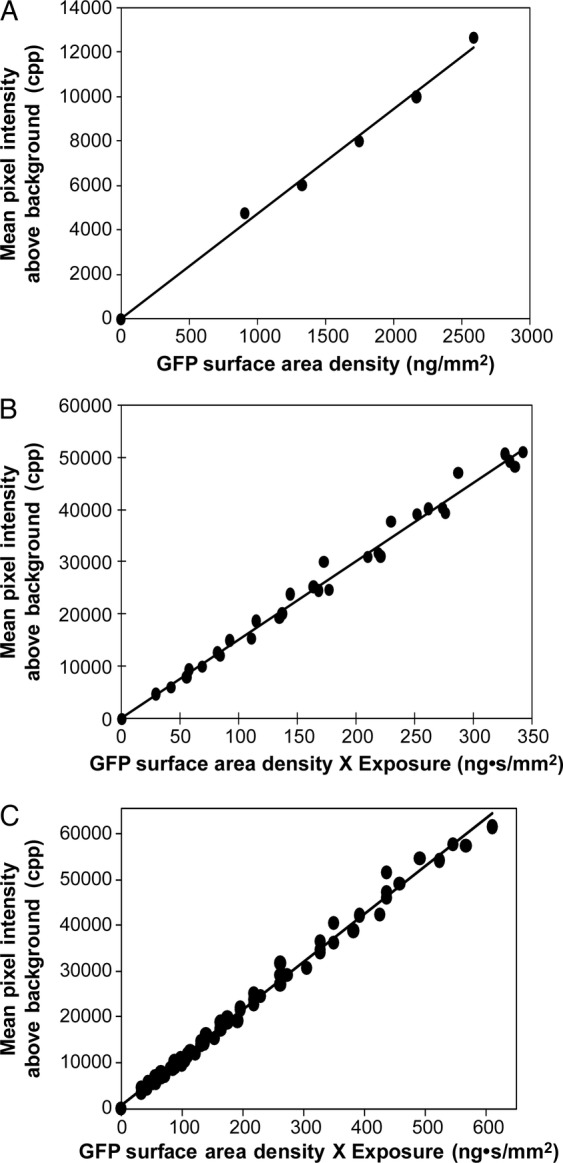
Camera response to a GFP titration. Enhanced GFP titrations in blackened microtitre plates were photographed with the epifluorescent filter cube containing a yellow dichroic barrier filter. (A) Response of 1 s exposure with a Canon CMOS camera. Photographic conditions were an illumination of 20 200 lx, ISO of 800, aperture of 8.0. (B) Response combining 1, 2, 3.2, 4, 5, 6, 8 and 10 s exposures. (C) Response combining 1, 2, 3.2, 4, 5, 6, 8, 10, 13 and 15 s, with a Nikon CCD camera, 21 500 lx, ISO of 800 and an aperture of 8.0.
To determine the specificity of the colour channels to red-shifted GFP fluorescence, pixel intensities in the red, green and blue channels were measured from raw file photographs of purified EGFP (Fig. 7). When a combination of yellow dichroic glass and cyan dichroic glass was used as the barrier filter with a CMOS-containing Canon EOS 30D (Fig. 7A), GFP fluorescence was only detected in the green channel. The response was linear with exposure time (r2 = 0.9975, n = 20, P = 7.14 × 10⁻²⁵). These results indicate that the green channel detects GFP fluorescence. When only the yellow dichroic glass was used as the filter cube's barrier filter (Fig. 7B), both the green channel (r2 = 0.9989, n = 25, P = 7.59 × 10⁻³⁴) and the red channel (r2 = 0.9987, n = 25, P = 3.97 × 10⁻³³) showed linear responses to EGFP fluorescence, with ∼87 % of the counts being detected in the green channel and ∼13 % being detected in the red channel. Thus, caution should be used when interpreting chlorophyll fluorescence measurements in plants expressing GFP. When only a single yellow dichroic barrier filter was used with the filter cube attached to the CCD-containing Nikon D80, EGFP fluorescence was only detected in the green channel (Fig. 7C). The green response was linear to exposure time (r2 = 0.9946, n = 13, P = 8.217 × 10⁻¹⁴).
Fig. 7.
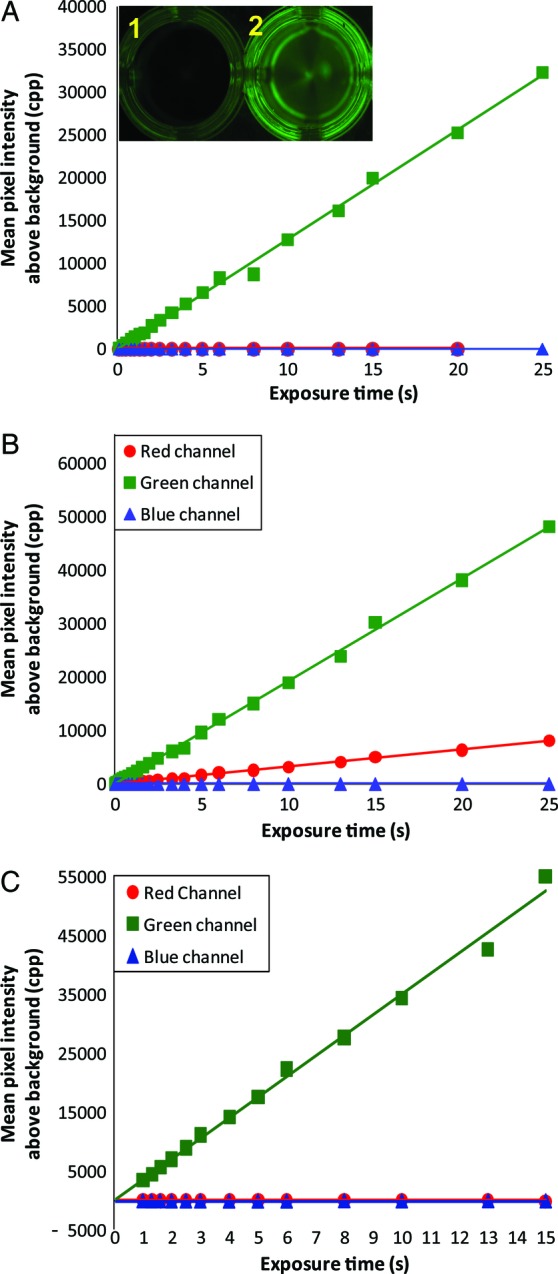
CMOS and CCD detector response to red-shifted GFP fluorescence. Enhanced GFP (A and B: 79 ng mm−2; C: 32.7 ng mm−2) in blackened microtitre plate wells (A, inset) were photographed with exposure times ranging from 0.1 to 25 s with the LED illuminated filter cube (A and B: 14 550 lx; C: 20 200 lx). Both cameras were set with an ISO of 800 and an aperture of 8.0. Counts observed from wells (inset 1) containing dilution buffer (1× PBS) were subtracted from EGFP light intensity measurements (inset 2). (A) Canon camera with CMOS detector configured with the filter cube containing a combination of dichroic yellow glass and cyan dichroic glass as the barrier filter. (B) Same camera as (A), with only a yellow dichroic barrier filter. (C) Nikon camera with a CCD detector configured with a filter cube as described in (B).
To determine the specificity of the camera colour channel responses to arabidopsis leaf pigments, chlorophyll was extracted with methanol and quantified using a spectrophotometer (Meeks and Castenholz 1971). Timed exposures were taken using the filter cube containing a yellow dichroic glass barrier filter. Measurements of pixel intensities in the raw files (Fig. 8) showed a positive linear response in the red channel for both the CMOS-containing Canon EOS 30D (Fig. 8A, r2 = 0.993, n = 11, P = 2.07 × 10⁻¹⁴) and the CCD-containing Nikon D80 (Fig. 8B, r2 = 0.992, n = 18, P = 1.18 × 10⁻¹⁰). Both cameras produced nearly horizontal slopes in the blue channel and green channel. The green channel slope was slightly negative for the Canon (r2 = 0.991, n = 11, P = 1.75 × 10⁻¹⁰). These results indicate that fluorescence from leaf pigments extracted with methanol does not produce a detectable signal in the cameras' green channel.
Fig. 8.
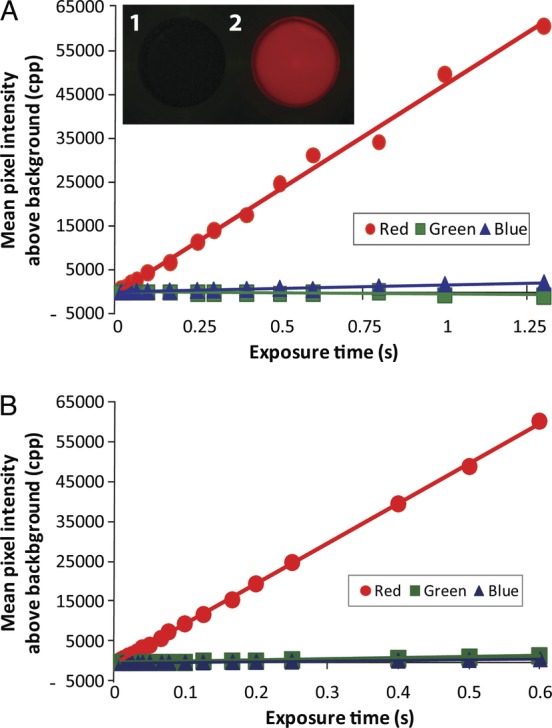
Camera responses to methanol leaf extracts. (A) Methanol (inset 1) and methanol leaf extracts (inset 2) were placed in blackened microtitre plate wells at a chlorophyll density of 121 ng mm−2. Fluorescent photographs were taken with a Canon CMOS-containing camera with the filter cube containing a yellow dichroic barrier filter. Illumination intensity was 14 550 lx. (B) Nikon CCD-containing camera with the same filter cube used in (A) (chlorophyll at 158 ng μL−1, 20 000 lx). Both cameras were set with an ISO of 800 and an aperture of 8.0. Exposure times ranged from 0.001 to 1.25 s. Counts observed from the dilution buffer (90 % methanol) were subtracted from the fluorescent pigment measurements.
Camera response to in planta GFP fluorescence
To evaluate the camera response to in planta GFP fluorescence, mixed populations of wild-type and red-shifted GFP-expressing plants (35S/GFP) were photographed with the filter cube with exposure times ranging from 0.05 to 30 s. Pixel intensities in the raw files' red, green and blue channels were measured (Fig. 9). When a single yellow dichroic barrier filter was used with the CMOS-containing Canon camera (Fig. 9A), the red channel corresponding to chlorophyll fluorescence increased linearly in both the wild-type (r2 = 0.9999, n = 10, P = 6.05 × 10⁻¹⁶) and GFP-expressing plants (r2 = 0.9995, n = 10, P = 2.57 × 10⁻¹³) until the pixel intensity approached 58 500 cpp. The red channel graph lines became nearly horizontal when the mean pixel intensities rose above 60 000 cpp. In contrast, when the cyan dichroic glass, which blocks red light, was included in the barrier filter, few counts were detected in the red channel at 5 s or less (Fig. 9B). The green channel responded linearly to exposure time until the mean pixel intensity approached ∼57 500 cpp (Fig. 9A and B). When the green channel plateaued above 60 000 cpp, the red channel started to produce a signal which increased with additional exposure time. In exposures >15 s, the blue channel started to produce aberrant signals as well. Parallel experiments with a CCD-containing Nikon camera produced similar results [see Additional Information].
Fig. 9.
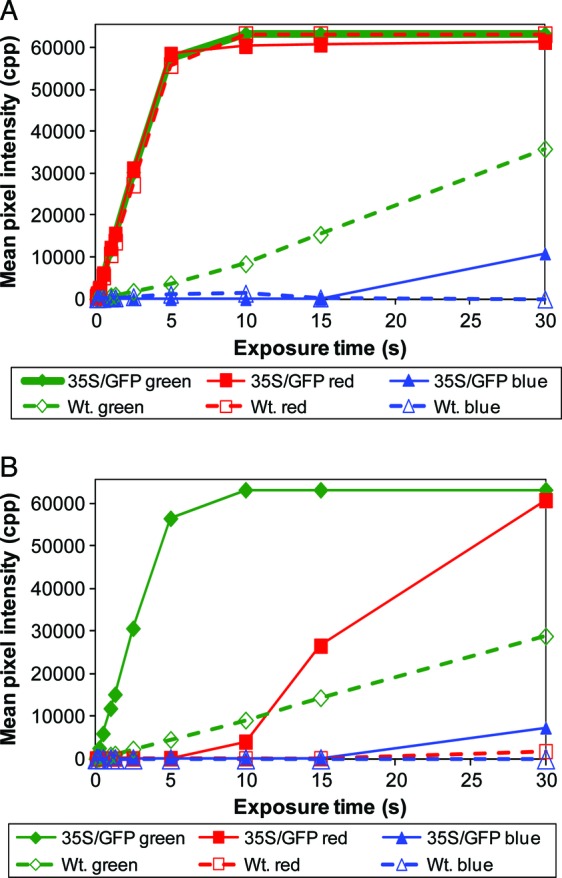
Digital camera response to in planta GFP expression. A mixed population of 13-day-old peat-grown wild-type (Wt.) seedlings and transgenic seedlings expressing the CaMV35S/GFP chimeric gene (35S/GFP) were photographed with a CMOS-containing Canon camera with the filter cube attachment containing a barrier filter made of yellow dichroic glass (A) or a barrier filter made of a combination of yellow and cyan dichroic glass (B). The photographs had exposure times from 0.05 to 30 s. Photographic conditions were an aperture of 8.0, an ISO of 1600 and an illumination intensity of 11 660 lx. Pixel intensity measurements were taken from expanded cotyledons.
Green fluorescence was detected in wild-type plants with both the CMOS-containing (Fig. 9) and CCD-containing cameras [see Additional Information]. The main difference between the cameras was the sensitivity. The signal-to-noise ratio of the Canon camera was 16.1 when the yellow barrier filter was used (Fig. 9A), and 13.3 when both the cyan and yellow filters were combined (Fig. 9B). In contrast, the Nikon's signal-to-noise ratios were 6.8 and 8.5, respectively. The sum of these results shows that GFP surface fluorescence levels can be measured in planta when corresponding background counts are subtracted. However, overexposed photographs start to produce aberrant signals.
Background leaf fluorescence
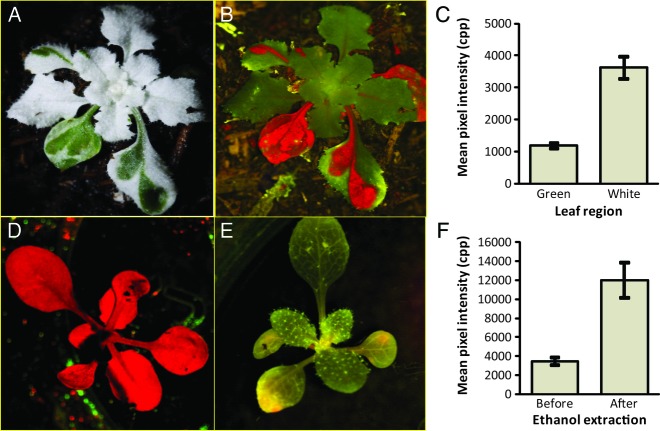
To investigate the cause of the green signal observed in plants not expressing GFP, variegated plants were photographed with the filter cube containing a yellow dichroic barrier filter. Photographs of mutant variegated arabidopsis (Fig. 10A and B) showed that the non-pigmented regions of the leaf produced 3.0 times more fluorescence (Fig. 10C) than the pigmented regions of the leaf. The difference in the endogenous fluorescence was statistically significant (H0: μgreen = μwhite, where μ is the population mean, two-sided t-test assuming unequal variance, t = 14.506, df = 25, P = 1.115 × 10⁻¹³). Similar results were obtained when variegated garden sage (S. officinalis cv. tricolor) was assessed [see Additional Information].
Fig. 10.
Endogenous background fluorescence. Variegated arabidopsis was photographed with white light (A) and with a filter cube containing a yellow barrier filter (B). The Canon EOS 30D camera setting for the fluorescent images was 5 s exposure, ISO 400 and f/8.0. The light intensity was ∼11 000 lx. ImageJ was used to measure green pixel intensity from the green regions and white regions of the variegated plants (C). Range bars are 95% confidence intervals. Wild-type Columbia-O plants were photographed with the filter cube containing a yellow barrier filter (0.03 s exposure, ISO 1600, f/2.8, intensity of ∼10 000 lx) before 95 % ethanol extraction (D) and after extraction (photography conditions the same as D) (E). Green channel pixel intensity was measured (F). Range bars are 95 % confidence intervals.
To determine whether background green fluorescence was inherent in normal leaf material, the chlorophyll of wild-type arabidopsis leaves was removed by ethanol extraction. Fluorescent photographs showed that after the red fluorescence caused by chlorophyll (Fig. 10D) was removed, additional endogenous fluorescence was revealed (Fig. 10E). Measurement of the pixel intensities showed that green fluorescence increased 3.46-fold after ethanol extraction (Fig. 10F). Student's t-test showed that the difference was statistically significant (H0: μbefore extraction = μafter extraction, assuming unequal variance, t = 2.13, df = 15, P = 6.75 × 10⁻⁸).
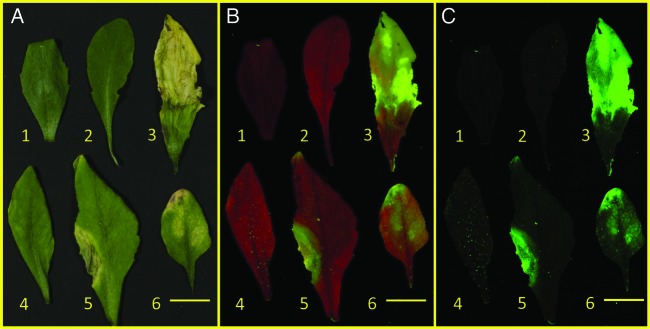
Since loss of chlorophyll is a potential source of false-positive signals, the fluorescence of plants with chlorotic and necrotic leaves was investigated. Wild-type arabidopsis was allowed to mature until the leaves started to senesce (Fig. 11A). Fully green and affected leaves were then photographed with the filter cube. Photographs using the yellow barrier filter (Fig. 11B) showed diminished red chlorophyll fluorescence in the necrotic regions of the leaves. Additionally, the leaf with low levels of chlorosis (leaf 4) produced a speckled fluorescence pattern caused by trichomes. Some trichome fluorescence was also seen in garden sage leaves [see Additional Information]. When the cyan filter that blocks chlorophyll fluorescence was added (Fig. 11C), pronounced fluorescence was evident in the necrotic regions of the leaves and in the leaf with large trichomes (leaf 4). The sum of these results indicates that false-positive signals can result from necrotic leaves and leaves with prominent trichomes.
Fig. 11.
Effect of leaf necrosis and chlorosis on background fluorescence. Leaves from wild-type arabidopsis were photographed with white light (A), with the filter cube containing a yellow barrier filter (Canon EOS 30D camera, 1.0 s exposure, ISO 400, f/8.0, intensity of ∼8000 lx) (B) and the filter cube containing yellow and cyan barrier filters (same photographic conditions as B) (C). Leaves 1 and 2 were controls; leaves 3 and 5 were necrotic; leaf 4 was chlorotic; and leaf 6 was necrotic on the tip and chlorotic in the middle region. The size bar is 1 cm.
GFP expression in non-green plant tissues
To determine whether non-green plant tissues, like roots and etiolated organs, can be used in GFP expression experiments, wild-type and GFP-expressing plants were grown heterotrophically (Fig. 12). Comparison of transgenic and wild-type plants showed that green fluorescence was statistically greater in the cotyledons, hypocotyls and roots of both etiolated and non-etiolated plants (P < 0.05). Though background green fluorescence was evident in the etiolated wild-type plants, the increased signal in the GFP-expressing plants (4.2-fold in cotyledons, 2.5-fold in hypocotyls and 1.5-fold in roots) is sufficient to use these organs in experiments.
Fig. 12.
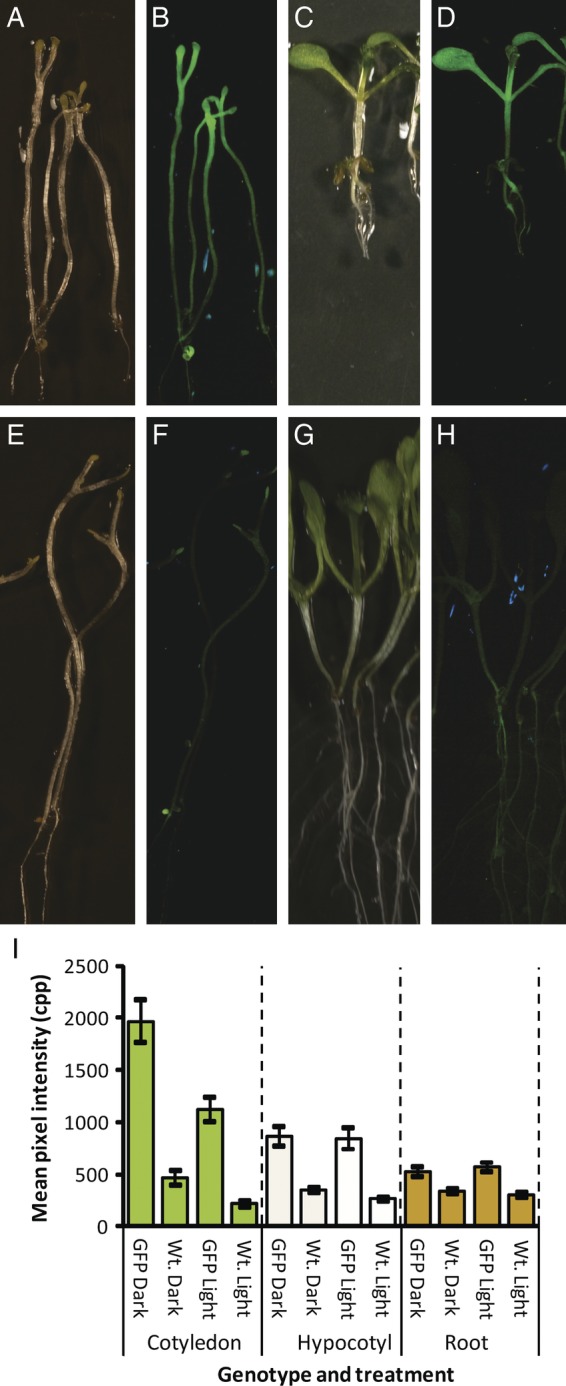
Green fluorescent protein fluorescence in etiolated plants. Transgenic seed expressing the CaMV35S/EGFP (GFP) chimeric gene (A–D) and wild-type (Wt.) seeds (E–H) were grown on germination medium in darkness (dark) or in the light (light) for 9 days. Photographs were taken with white light (A, C, E and G) and with the filter cube (B, D, F and H) holding yellow and cyan barrier filters (39 900 lx, 3.2 s, ISO 400, aperture 8.0). Green channel pixel intensities corresponding to cotyledons, hypocotyls and roots are shown in (I). Range bars are 95 % confidence intervals.
Discussion
The authors' goal was to develop an experimental system in which undergraduates could perform quantitative inquiry investigations with transgenic plants expressing GFP, thus supporting the educational goals of the National Research Council (1996, 2003). Instruments designed to measure surface GFP expression are expensive and thus inaccessible for many research and most teaching laboratories. To overcome this barrier, the authors wanted to utilize inexpensive techniques to detect and quantify GFP expression. The initial plan was to use commercially available hand-held LED illumination systems designed for GFP detection. However, these devices were not suitable because of non-uniform illumination and filters that produced photographic artefacts (for example, see Fig. 2E). Consumer camera filters were also not suitable because of numerous photographic artefacts, some of which are presented in Fig. 2C and D. Dichroic filters were an improvement over consumer photographic filters (Fig. 5), but were not effective in blocking blue excitation light (Fig. 2F and G).
The epifluorescent device illustrated in Fig. 1 works like the filter cubes found in epifluorescent compound microscopes (Ruzin 1999; Billinton and Knight 2001), and is designed to be inexpensive while still being effective in imaging red-shifted GFP fluorescence. The device can be attached to most commercial SLR cameras and many dissecting microscopes because it is mounted with a Cokin (Piktus, France) lens filter holder which includes a number of size adapters. The fact that GFP fluorescence was measured in pot-grown plants (Figs 2 and 3) in addition to plants growing on agar medium (Fig. 11) shows that the device is effective and flexible. Additionally, because of the flexibility of the apparatus design, this technique can be used in many research applications. The spectral properties of the apparatus (Fig. 4) should allow it to work with non-plant organisms such as GFP-expressing Xenopus laevis and Caenorhabditis elegans. The apparatus has been successfully used with GFP-expressing Danio rerio along with fluorescent minerals like willemite and calcite [see Additional Information].
The device is inexpensive because it was constructed mostly from mass-produced materials. Blue LEDs have been shown to be effective light sources for fluorescent microscopy (Chin-Sang, Website; Martin et al. 2005). The light source (Fig. 1) contained a Luxeon V royal blue LED. The spectrum is reported to have a range of ∼420–500 nm with a single emission peak of 490 nm (Technical Data DS34, Lumileds Lighting), falling within the reported excitation wavelengths of red-shifted GFPs (Chiu et al. 1996; Zhang et al. 1996; Patterson et al. 2001). This lamp has been successfully used to view C. elegans expressing high levels of GFP without the addition of an excitation filter (Chin-Sang, Website); however, when the spectrum was observed with a hand-held spectroscope, detectable emission of green light was observed. Thus, an excitation filter was included with the apparatus.
Dichroic filters designed to enhance machine vision devices were used because they are much less expensive than epifluorescent microscope filter sets. The excitation filter (Fig. 1) was made of magenta dichroic glass because it does not emit light longer than ∼500 nm (Fig. 4). The 45° reflective filter (50 mm × 50 mm) was large enough to accommodate the field of view of a 100-mm macro-lens, reflect light with wavelengths <500 nm, and provide additional improvement of the excitation light quality by allowing wavelengths >500 nm to pass through the filter cube. Reflected light with wavelengths <500 nm was blocked by the 45° reflective filter and the long-pass yellow dichroic filter, resulting in images with little or no reflected light and allowing fluorescence caused by GFP and chlorophyll to be detected (Figs 2H). This combination of filters produced the greatest signal-to-noise ratio in GFP-expressing transgenic arabidopsis (Fig. 5). When the green channel pixel intensity of the raw files was measured, the counts observed in GFP-expressing transgenic arabidopsis were 16-fold greater than those observed in the equivalent exposure of wild-type plants. If the red fluorescence caused by chlorophyll is not desired in the photograph, a short-pass cyan dichroic filter can be added (Fig. 2) to block wavelengths longer than ∼590 nm (Fig. 4), thus obscuring the light emitted by chlorophyll (Figs 1I, 3 and 12B). Unfortunately, adding the cyan filter reduces the signal-to-noise ratio to 12.5-fold above background (Fig. 5).
The performance of the device is comparable to fluorescent dissecting microscopes specially designed to detect GFP (Tritech Research model SMT1-FL). To compare the two instruments, a mixed population of GFP-expressing and wild-type seeds was sown at a high enough density so that two or more germinating seedlings could be viewed in the microscope's ×6 field of view. After photographing using the Canon EOS 30D camera body, the same plants were photographed using the filter cube. The observed signal-to-noise ratios were 4.99 and 5.81, respectively. The differences in the ratios were not statistically significant.
The machine vision filters are not optimized for GFP fluorescence. Thus, the sensitivity of the apparatus can be improved by using dichroic filters specifically made for GFP detection. However, research-grade 45° beam-splitting filters are ∼8 times more expensive than the filter used in this study. The barrier filters are ∼18 times more expensive. The manufacturing tolerance of the machine vision filters is somewhat broader (±3 % at R50 %) than that of epifluorescence microscope dichroic filters (±2 % at R50 %) (per Technical Support, Edmund Optics Inc., Barrington, NJ, USA). However, the device can be reliably produced as long as spectrophotometric scans of the filters are used to confirm the filters' optical properties. The comparable signal-to-noise ratio of the apparatus and a research-grade fluorescent dissecting microscope show that the use of mass production dichroic filters is a pragmatic compromise between costs and performance.
Both the CMOS and CCD image detectors responded quantitatively to red-shifted GFP fluorescence. When a titration of purified EGFP was photographed with the filter cube (Fig. 6), the linear regression of the green channel pixel intensity produced a statistically significant correlation coefficient in response to GFP surface density (ng mm−2) with the regression line passing through a y-intercept of zero. The cameras responded linearly to exposure time as well (Fig. 7). When green channel pixel intensity was plotted against GFP surface density by exposure times (ng s mm−2), the resulting regression line was statistically significant. Thus, pixel intensity is directly proportional to both GFP surface density and exposure time (Fig. 6) when the protein is contained in a transparent solution.
The implication of these results is that both CMOS and CCD digital SRL cameras might be used to quantify surface GFP fluorescence. However, comparisons between surface fluorescence and in planta GFP protein concentrations have not been made in this investigation. Other investigators have found linear relationships between surface fluorescence and GFP protein concentrations in plant tissues (Blumenthal et al. 1999; Harper et al. 1999; Richards et al. 2003; Halfhill et al. 2004). Because both GFP fluorescence and background fluorescence are affected by physiology and development in situ, standard curves will need to be performed for each experimental system investigated.
Colour CMOS and CCD detectors contain Bayer colour filter arrays that give each pixel some degree of colour specificity by preferentially transmitting green, blue or red photons (Turchetta et al., Website). The transmittance spectrum of each green pixel filter overlaps the transmittance spectrum of both the red and blue pixel filters in the Canon EOS 30D/40D (Buil, Website) and the Nikon D80 (Schmitt, Website). To confirm that EGFP fluorescence is detected primarily in the green channel of digital images, exposure time series of photographs were taken of purified EGFP. When the filtered cube's barrier filter contained a combination of yellow and cyan dichroic glass, GFP fluorescence was only observed in the green channel of the Canon camera (Fig. 7A). When the cyan dichroic glass was removed, a steeper linear response was observed in the green channel. Additionally, a 6.6-fold smaller linear response was also detected in the red channel (Fig. 7B). The latter result indicates that some of EGFP's fluorescence was detected by the red channel when the barrier filter only contained yellow dichroic glass. The Nikon camera, in contrast, did not produce a red-channel response when the filter cube only contained a yellow barrier filter (Fig. 7C), indicating this camera has better colour specificity for EGFP fluorescence.
To ascertain whether chlorophyll fluorescence affects the green channel of the camera, leaf pigments were extracted with methanol and quantified spectrophotometrically (Meeks and Castenholz 1971). When the green leaf extracts in the wells of microtitre plates were photographed with the filter cube containing a yellow dichroic barrier filter, a positive linear response with exposure time was observed in the red channel of both the Canon and Nikon digital cameras (Fig. 8). A slightly negative slope was observed in the green channel of the Canon image files (Fig. 8A). The negative slope was probably due to chlorophyll light absorption blocking the green background fluorescence caused by the microtitre plates. In subsequent experiments with the Nikon camera (Fig. 8B), a different style of blackened microtitre plate was used that produced 4-fold less background counts. The sum of these results suggests that fluorescent measurements of red-shifted GFPs can be made from counts observed in the green channel when using SLR digital cameras.
Long exposures should not be taken when making quantitative measurements with digital cameras. Both CMOS and CCD detectors lose colour fidelity when their photodiodes become saturated (Fellers and Davidson, Website; Tian et al. 2005). Once saturated, contiguous photodiodes start to accept charges, a phenomenon known as blooming (Fellers and Davidson, Website) or crosstalk (Tian et al. 2005). The effect of blooming became evident in Fig. 9 when the green channel mean pixel intensity was >60 000 cpp. Sixteen-bit cameras have a theoretical saturation level of 216 = 65 536 cpp. In the photographs taken with the filter cube that blocked red light with a cyan filter (Fig. 9B), counts in the red channel were detected in exposures >10 s, which corresponds to the exposure times that the green channel pixel intensities approached 60 000 cpp in the CMOS-containing Canon camera. Additionally, the blue channel started to produce counts in photographs of plants expressing GFP after 30 s of exposure (Fig. 9A and B) but not in photographs of wild-type plants. This result indicates that the blue photodiodes started to accept charges when the green pixels became saturated. Similar results were observed with a CCD-containing Nikon camera [see Additional Information]. Therefore, pixel intensity measurements should not be taken when any of the colour channels approach saturation.
Background fluorescence
Autofluorescence can interfere with the detection of GFP. For example, Zhou et al. (2005) showed that chlorophyll can completely obscure GFP fluorescence in Medicago truncatula (alfalfa) and Oryza sativa (rice). The chlorophyll concentration varies with the age and species of leaf. They proposed that the chlorophylls absorbed the excitation photon, thus reducing GFP fluorescence. Fortunately, mature arabidopsis leaves are not as affected by its chlorophyll as alfalfa (Zhou et al. 2005). However, materials other than red-fluorescing chlorophyll appear to produce interfering fluorescence in arabidopsis.
Green background fluorescence was detected in the leaves of wild-type arabidopsis (Figs 5, 10 and 12). Since methanol leaf pigment extracts did not produce detectable green fluorescence (Fig. 8), substances other than chlorophyll are the likely source of this background. Several substances have been identified as potential sources of unwanted green autofluorescence, including lignin, flavins, nicotinamide-adenine dinucleotide phosphate and aromatic amino acids (Billinton and Knight 2001). Experiments with variegated varieties of plants (Fig. 10A) showed increased green fluorescence in the albino regions of the leaves. In arabidopsis, there was 3.06-fold greater green autofluorescence. Similar results were observed in variegated garden sage [see Additional Information]. Zhou et al. (2005) showed that ethanol extraction of whole leaves can remove pigments that obscured GFP fluorescence. Green autofluorescence increased by 2.4-fold when ethanol was used to extract leaf pigments from wild-type arabidopsis (Fig. 10D–F). The increase in autofluorescence could be caused by reducing the interference caused by chlorophyll (Zhou et al. 2005) or by releasing fluorescent soluble materials (Billinton and Knight 2001) when cells were ruptured. In either case, these results indicate that materials other than chlorophylls are responsible for endogenous green background fluorescence.
Blumenthal et al. (1999) have shown that subtracting the in situ fluorescence spectrum of wild-type tobacco from the fluorescent spectrum of GFP-expressing tobacco produced ‘differential emission spectra’ that were nearly identical to the fluorescent spectrum of purified GFP. This observation indicates that the fluorescence spectrum of GFP-expressing plants is the sum of the GFP fluorescence and its autofluorescence. Thus, the green channel counts observed in negative controls should be subtracted from the counts observed in GFP-expressing plants. Developmental age (Harper and Stewart 2000; Halfhill et al. 2003; Hraška et al. 2006, 2008), environmental growth conditions (Halfhill et al. 2004) and plant species (Zhou et al. 2005) can affect the efficiency of GFP fluorescence detection. Thus, controls should be physiologically identical to GFP-expressing plants in terms of genetic background, developmental ages and growth conditions. Care should be taken when conducting experiments involving stress physiology. When leaves become necrotic or chlorotic (Fig. 11), green fluorescence becomes evident in wild-type plants. A detailed discussion of the factors to consider when developing controls is presented by Halfhill et al. (2004).
The experiments presented in Figs 2, 5 and 9 were conducted in a manner that reduced the variability between treatment and control observations. The wild-type plants were the same ecotype as the transgenic lines. The wild-type plants and the GFP-expressing plants were sown in the same pot on the same day and grown at a density where they were not competing for light. To ensure developmental uniformity, all intensity measurements were taken from expanded cotyledons or the first true leaves. As a result, when background counts were subtracted from GFP measurements, the background counts were observed from plant tissues that were nearly identical both physiologically and developmentally.
Non-green leaf tissue can have high levels of green fluorescence (Figs 10A–C and 11). However, some non-green plant tissues can be used in GFP expression experiments. For example, etiolated cotyledons, hypocotyls and roots expressing GFP produce statistically greater green pixel intensities than the corresponding organs of wild-type plants (Fig. 12).
Conclusions and forward look
Epifluorescent photographs taken with digital SLR cameras allow for the capturing of artefact-free images of whole plants without the use of damaging UV light and improve the signal-to-noise ratio. By using mass production materials, the cost of constructing the camera attachment is low, allowing resource-poor laboratories greater access to GFP imaging technology. The technology is flexible, making it amenable to capturing fluorescent images from a wide array of organisms, materials and experimental situations. It should be possible to modify the light source and/or dichroic filters to detect fluorescent sources as diverse as red fluorescent protein and enhanced blue fluorescent protein (Patterson et al. 2001).
Additional information
The following additional information is available in the online version of this article –
File 1. Diagram. An alternative design for an epifluorescent camera attachment using generic optical lenses.
File 2. Diagram. Charge-coupled device camera response to in planta GFP expression.
File 3. Diagram. Endogenous fluorescence of a variegated sage, S. officinalis.
File 4. Diagram. Fluorescence of transgenic zebra fish (Gong et al. 2003) (D. rerio), and the minerals willemite and calcite.
Sources of funding
This material is based upon work supported by the National Science Foundation—Division of Undergraduate Education under grant no. 0442771.
Contributions by the authors
S.S.B. conceived the project, constructed and evaluated the apparatus, performed at least one replication of each experiment, did the statistical analysis and wrote the manuscript. C.B.V., H.G.G., C.C.J. A.W.S., C.H.S., A.A.B., M.A.W. and D.A.T. are all undergraduates in S.S.B.'s laboratory. H.G.G. and A.W.S. conducted replications of the experiment described in Fig. 2. M.A.W. and D.A.T. contributed to Fig. 5. C.B.V. conducted replications of the experiments presented in Fig. 3. C.C.J. conducted replications of the experiments corresponding to Fig. 8. C.H.S. conducted the experiments involving S. officinalis. A.A.B. produced the pure breeding transgenic lines from the mixed population obtained from the Arabidopsis Resource Center. D.S.C. took all the photographs involving the Nikon digital camera.
Conflict of interest statement
None declared.
Acknowledgements
We would like to thank Dr Robert Ross, Physics Department, University of Detroit Mercy (UDM), for technical advice on optics and Drs Barbra Hollar (Biology Department, UDM), Stephanie Conant (Biology Department, UDM), Sarah Wyatt (Plant Sciences Department, Ohio University) and A. Bruce Cahoon (Department of Biology, Middle Tennessee State University) for critiques of the manuscript.
References
- Billinton N, Knight AW. Seeing the wood through the trees: a review of techniques for distinguishing green fluorescent protein from endogenous autofluorescence. Analytical Biochemistry. 2001;291:175–197. doi: 10.1006/abio.2000.5006. [DOI] [PubMed] [Google Scholar]
- Blumenthal A, Kuznetzova L, Edelbaum O, Raskin V, Levy M, Sela I. Measurement of green fluorescence protein in plants: quantification, correlation to expression, rapid screening and differential gene expression. Plant Science. 1999;142:93–99. [Google Scholar]
- Buil C. Caracteristiques Spectrales du Canon EOS 40D Modifie and Evaluation du filtre Anti-pollution CLS Astronomik http://www.astrosurf.com/~buil/eos40d2/filter.htm 14 August 2010.
- Chalfie M, Tu Y, Euskirchen G, Ward W, Prasher D. Green fluorescent protein as a marker for gene expression. Science. 1994;263:802–805. doi: 10.1126/science.8303295. [DOI] [PubMed] [Google Scholar]
- Chin-Sang ID. GFP stereoscope using LED light source http://130.15.90.245/gfp_stereoscope.htm 21 July 2011.
- Chiu W, Niwa Y, Zeng W, Hirano T, Kobayashi H, Sheen J. Engineering GFP as a vital reporter in plants. Current Biology. 1996;6:325–330. doi: 10.1016/s0960-9822(02)00483-9. [DOI] [PubMed] [Google Scholar]
- Coffin D. Decoding raw digital photos in Linux http://www.cybercom.net/~dcoffin/dcraw/ 23 July 2011.
- Cutler SR, Ehrhard DW, Griffitts JS, Somerville CR. Random GFP::cDNA fusions enable visualization of subcellular structures in cells of Arabidopsis at a high frequency. Proceedings of the National Academy of Sciences of the USA. 2000;97:3718–3723. doi: 10.1073/pnas.97.7.3718. [DOI] [PMC free article] [PubMed] [Google Scholar]
- Fellers TJ, Davidson MW. Concepts in digital imaging technology: CCD saturation and blooming http://micro.magnet.fsu.edu/primer/digitalimaging/concepts/ccdsatandblooming.html 17 May 2008.
- Gong Z, Wan H, Tay TL, Wang H, Chen M, Yan T. Development of transgenic fish for ornamental and bioreactor by strong expression of fluorescent proteins in the skeletal muscle. Biochemical and Biophysical Research Communications. 2003;308:58–63. doi: 10.1016/s0006-291x(03)01282-8. [DOI] [PubMed] [Google Scholar]
- Halfhill MD, Richards HA, Mabon SA, Stewart CN., Jr Expression of GFP and Bt transgenes in Brassica napus and hybridization with Brassica rapa. Theoretical and Applied Genetics. 2001;103:659–667. [Google Scholar]
- Halfhill MD, Millwood RJ, Rufty TW, Weissinger AK, Stewart CN., Jr Spatial and temporal patterns of green fluorescent protein (GFP) fluorescence during leaf canopy development in transgenic oilseed rape, Brassica napus L. Plant Cell Reports. 2003;22:338–343. doi: 10.1007/s00299-003-0696-4. [DOI] [PubMed] [Google Scholar]
- Halfhill MD, Millwood RJ, Stewart CN. Green fluorescent protein quantification in whole plants. In: Peña L, editor. Transgenic plants: methods and protocols. Totowa, NJ: Humana Press; 2004. pp. 215–226. [DOI] [PubMed] [Google Scholar]
- Harper BK, Stewart CN., Jr Patterns of green fluorescent protein expression in transgenic plants. Plant Molecular Biology Reporter. 2000;18:141a–141i. [Google Scholar]
- Harper BK, Mabon SA, Leffel SM, Halfhill MD, Richards HA, Moyer KA, Stewart CN., Jr Green fluorescent protein in transgenic plants indicates the presence and expression of a second gene. Nature Biotechnology. 1999;17:1125–1129. doi: 10.1038/15114. [DOI] [PubMed] [Google Scholar]
- Haseloff J. GFP variants for multispectral imaging of living cells. Methods in Cell Biology. 1999;58:139–151. doi: 10.1016/s0091-679x(08)61953-6. [DOI] [PubMed] [Google Scholar]
- Hraška M, Rakouský S, Čurn V. Green fluorescent protein as a vital marker for non-destructive detection of transformation events in transgenic plants. Plant Cell, Tissue and Organ Culture. 2006;86:303–318. [Google Scholar]
- Hraška M, Heřmanová V, Rakouský S, Čurn V. Sample topography and position within plant body influence the detection of the intensity of green fluorescent protein fluorescence in the leaves of transgenic tobacco plants. Plant Cell Reports. 2008;27:67–77. doi: 10.1007/s00299-007-0431-7. [DOI] [PubMed] [Google Scholar]
- Jach G. Use of fluorescent proteins as reporters. In: Salinas J, Sánchez-Serrano JJ, editors. Arabidopsis protocols. 2nd edn. Totowa, NJ: Humana Press; 2006. pp. 275–291. [Google Scholar]
- Kaiserli E, Jenkins GI. UV-B promotes rapid nuclear translocation of the Arabidopsis UV-B specific signaling component UVR8 and activates its function in the nucleus. Plant Cell. 2007;19:2662–2673. doi: 10.1105/tpc.107.053330. [DOI] [PMC free article] [PubMed] [Google Scholar]
- Kremers G-J, Gilbert SG, Cranfill PJ, Davidson MW, Piston DW. Fluorescent proteins at a glance. Journal of Cell Science. 2011;124:157–160. doi: 10.1242/jcs.072744. [DOI] [PMC free article] [PubMed] [Google Scholar]
- Leffel SM, Mabon SA, Stewart CN. Applications of green fluorescent protein in plants. BioTechniques. 1997;23:912–918. doi: 10.2144/97235bi01. [DOI] [PubMed] [Google Scholar]
- Li A, Schuermann D, Gallego F, Kovalchuk I, Tinland B. Repair of damaged DNA by Arabidopsis cell extract. Plant Cell. 2002;14:263–273. doi: 10.1105/tpc.010258. [DOI] [PMC free article] [PubMed] [Google Scholar]
- Martin G, Agostini HT, Hansen LL. Light emitting diode microscope illumination for green fluorescent protein or fluorescein isothiocyanate epifluorescence. BioTechniques. 2005;38:204–206. doi: 10.2144/05382BM06. [DOI] [PubMed] [Google Scholar]
- Meeks JC, Castenholz RW. Growth and photosynthesis in an extreme thermophile, Synechococcus lividus (Cyanophyta) Archiv für Mikrobiologie. 1971;78:25–41. doi: 10.1007/BF00409086. [DOI] [PubMed] [Google Scholar]
- Millwood RJ, Halfhill MD, Harkins D, Russotti R, Stewart CN. Instrumentation and methodology for quantifying GFP fluorescence in intact plant organs. BioTechniques. 2003;34:638–643. doi: 10.2144/03343pf02. [DOI] [PubMed] [Google Scholar]
- Molinier J, Hahne G. Use of green fluorescent protein to detect transformed shoots. In: Jackson JF, Linskens HF, Inman RB, editors. Testing for genetic manipulation in plants. Berlin: Springer; 2002. pp. 19–30. [Google Scholar]
- Nakamura J. Image sensors and signal processing for digital still cameras. Boca Raton, FL: CRC Press; 2006. [Google Scholar]
- National Research Council. From analysis to action: undergraduate education in science, mathematics, engineering, and technology. Washington, DC: National Academy Press; 1996. [Google Scholar]
- National Research Council. Bio2010: transforming undergraduate education for future research biologists. Washington, DC: National Academy Press; 2003. [Google Scholar]
- Niwa Y, Hirano T, Yoshimoto K, Shimizu M, Kobayashi H. Non-invasive quantitative detection and applications of non-toxic, S65T-type green fluorescent protein in living plants. The Plant Journal. 1999;18:455–463. doi: 10.1046/j.1365-313x.1999.00464.x. [DOI] [PubMed] [Google Scholar]
- Patterson G, Day RN, Piston D. Fluorescent protein spectra. Journal of Cell Science. 2001;114:837–838. doi: 10.1242/jcs.114.5.837. [DOI] [PubMed] [Google Scholar]
- Pedrós R, Moya I, Goulas Y, Jacquemoud S. Chlorophyll fluorescence emission spectrum inside a leaf. Photochemical and Photobiological Sciences. 2008;7:498–502. doi: 10.1039/b719506k. [DOI] [PubMed] [Google Scholar]
- Prasher DC, Eckenrode VK, Ward WW, Prendergast FG, Cormier MJ. Primary structure of the Aequorea victoria green-fluorescent protein. Gene. 1992;111:229–233. doi: 10.1016/0378-1119(92)90691-h. [DOI] [PubMed] [Google Scholar]
- Rasband WS. ImageJ http://rsbweb.nih.gov/ij/ 14 August 2010.
- Redei GP. Biochemical aspects of a genetically determined variegation in Arabidopsis. Genetics. 1967;56:431–443. doi: 10.1093/genetics/56.3.431. [DOI] [PMC free article] [PubMed] [Google Scholar]
- Rhee SY, Beavis W, Berardini TZ, Chen G, Dixon D, Doyle A, Garcia-Hernandez M, Huala E, Lander G, Montoya M, Miller N, Mueller LA, Mundodi S, Reiser L, Tacklind J, Weems DC, Wu Y, Xu I, Yoo D, Yoon J, Zhang P. The Arabidopsis Information Resource (TAIR): a model organism database providing a centralized, curated gateway to Arabidopsis biology, research materials and community. Nucleic Acids Research. 2003;31:224–228. doi: 10.1093/nar/gkg076. [DOI] [PMC free article] [PubMed] [Google Scholar]
- Richards HA, Halfhill MD, Millwood RJ, Stewart CN. Quantitative GFP fluorescence as an indicator of recombinant protein synthesis in transgenic plants. Plant Cell Reports. 2003;22:117–121. doi: 10.1007/s00299-003-0638-1. [DOI] [PubMed] [Google Scholar]
- Rodman MK, Yadav NS, Artus NN. Progression of geminivirus-induced transgene silencing is associated with transgene methylation. New Phytologist. 2002;155:461–468. doi: 10.1046/j.1469-8137.2002.00467.x. [DOI] [PubMed] [Google Scholar]
- Ruzin S. Plant microtechnique and microscopy. New York: Oxford University Press; 1999. [Google Scholar]
- Sambrook J, Fritsch EF, Maniatis T. Molecular cloning: a laboratory manual. 2nd edn. Cold Spring Harbor, NY: Cold Spring Harbor Laboratory; 1989. [Google Scholar]
- Schmitt K. Nikon D80 / D200 spectral response UV IR http://photographyoftheinvisibleworld.blogspot.com/2009/08/nikon-d80-d200-spectral-response-uv-ir.html 23 July 2011.
- Shin D, Pierce M, Gillenwater A, Williams M, Richards-Kortum R. A fiber-optic fluorescence microscope using a consumer-grade digital camera for in vivo cellular imaging. PLoS One. 2010 doi: 10.1371/journal.pone.0011218. doi:10.1371/journal.pone.0011218. [DOI] [PMC free article] [PubMed] [Google Scholar]
- Stewart CN., Jr The utility of green fluorescent protein in transgenic plants. Plant Cell Reports. 2001;20:376–382. doi: 10.1007/s002990100346. [DOI] [PubMed] [Google Scholar]
- Stewart CN., Jr Go with the glow: fluorescent proteins to light transgenic organisms. Trends in Biotechnology. 2006;24:155–162. doi: 10.1016/j.tibtech.2006.02.002. [DOI] [PubMed] [Google Scholar]
- Tian H, Sun Q, Li J, Domine A. Crosstalk challenges CMOS sensor design. Laser Focus World. 2005;41:119–123. [Google Scholar]
- Tsien RY. The green fluorescent protein. Annual Review of Biochemistry. 1998;67:509–544. doi: 10.1146/annurev.biochem.67.1.509. [DOI] [PubMed] [Google Scholar]
- Turchetta R, Spring KR, Davidson MW. Introduction to CMOS image sensors http://microscopy.fsu.edu/primer/digitalimaging/index.html 20 May 2008.
- Valvekens D, Van Montagu M, Van Lijsebettens M. Agrobacterium tumefaciens-mediated transformation of Arabidopsis thaliana root explants by using kanamycin selection. Proceedings of the National Academy of Sciences of the USA. 1988;85:5536–5540. doi: 10.1073/pnas.85.15.5536. [DOI] [PMC free article] [PubMed] [Google Scholar]
- Website 1. Photon systems instruments: professional instruments for plant science, biotechnology, and agriculture http://www.psi.cz/applications/fluorescence-imaging/ 23 July 2011.
- Website 2. Reader for digital camera raw images http://ij-plugins.sourceforge.net/plugins/dcraw/index.html 23 July 2011.
- Yambao MLM, Yagihashi H, Sekiguchi H, Sekiguchi T, Sasaki T, Sato M, Atsumi G, Tacahashi Y, Nakahara KS, Uyeda I. Point mutations in helper component protease of clover yellow vein virus are associated with the attenuation of RNA-silencing suppression activity and symptom expression in broad bean. Archives of Virology. 2008;153:105–115. doi: 10.1007/s00705-007-1073-3. [DOI] [PubMed] [Google Scholar]
- Zhang G, Gurtu V, Kain SR. An enhanced green fluorescent protein allows sensitive detection of gene transfer in mammalian cells. Biochemical and Biophysical Research Communications. 1996;227:707–711. doi: 10.1006/bbrc.1996.1573. [DOI] [PubMed] [Google Scholar]
- Zhou X, Carranco R, Vitha S, Hall TC. The dark side of green fluorescent protein. New Phytologist. 2005;168:313–322. doi: 10.1111/j.1469-8137.2005.01489.x. [DOI] [PubMed] [Google Scholar]
- Zhu YJ, Aghayani R, Moore PH. Green fluorescent protein as a visual selection marker for papaya (Carica papya L.) transformation. Plant Cell Reports. 2004;22:660–667. doi: 10.1007/s00299-004-0755-5. [DOI] [PubMed] [Google Scholar]


