Abstract
The few picosecond time scale H-bond making and breaking in the system acetonitrile-methanol dominates the mechanism of vibrational coherence transfer that is evident in the shapes of both the linear and nonlinear IR spectra of the CN group.
Keywords: coherence transfer, dynamic exchange, hydrogen-bond making and breaking, 2D IR, condensed phase
Introduction
The conventional IR spectral line shapes contain all the details of the dynamics of the modes, but it is often impossible to establish a physically meaningful set of dynamical parameters from the linear spectrum. On the other hand, the two-dimensional infrared (2D IR), spectra1–3 are composed from many more independent data points, so they can establish these parameters with improved confidence limits. Furthermore in 2D IR spectra, the overlapping populations of solvent-solute structures are more likely to be separately observed because of the separation of homogeneous and inhomogeneous contributions to the spectral bands. In this paper we consider the comparison of 2D IR and linear IR spectra of a system undergoing fast hydrogen-bond exchange that gives rise to coherence transfer. By fast exchange is meant the same as in NMR,4 namely that the exchange competes effectively with the other mechanisms of vibrational dephasing of the transition. The example used is the CN stretching mode of a dilute solution of acetonitrile in methanol. It will be seen that transfer between the vibrational coherences of the hydrogen-bonded (H) and non-hydrogen-bonded (F) sub-populations is occurring. We use the term coherence transfer because it is the 0–1 coherence that is transferred back and forth between the H and F states. The population exchange kinetics reported previously5 depends on different dynamical constants in principle.
In linear IR spectra there is only one time interval involved, a detection time, and the IR spectrum displays the Fourier transform of the free decay on this time axis. Therefore, only those exchange processes that can compete with other dephasing mechanisms can contribute to the IR spectral shape: this is the fast exchange or coherence transfer condition. The 2D IR echo spectra contain heterodyned photon echo signals as functions of three time intervals- the coherence time τ, the waiting time T, and the detection time t. In the τ and t intervals the mode is in a coherent state and it is during these intervals that the fast dynamic exchange may be seen. The population kinetics of the exchange is obtained from 2D IR experiments that vary the T interval or from delay time transients in pump-probe spectroscopy.
We have previously described in detail5 the use of 2D IR echo spectroscopy to measure the hydrogen-bond making and breaking for the system acetonitrile in methanol by monitoring the T-dependence of the echo signals, which yields the population kinetics. Hamm and coworkers6 have used 2D IR pump-probe methods1 to follow the delay time dependence of the H-bond kinetics of an amide mode in methanol which has recently been simulated.7 Other types of H-bonding systems undergoing exchange have been reported using 2D IR echo spectroscopy.8 Although there are numerous studies of hydrogen-bonding dynamics using ultrafast infrared pulses,9 examples of the fast limit of exchange where the conventional mechanisms of dephasing do not dominate the spectral line shapes are much less common in IR spectroscopy than in NMR where the intrinsic dephasing is much slower. There are a few examples of fast exchange in linear spectra10–15 and also on various nonlinear IR responses.5–8,16 But it is reasonable to assume that coherence transfer effects on spectra are relatively common in hydrogen-bonding media such as alcohols and water: in the latter case four exchanging states have been invoked in describing the nonlinear response.17 Because of the definitive information that such studies could provide and their importance in condensed phase dynamics, a systematic comparison of 1D IR and 2D IR spectra in the presence of fast exchange brought about by H-bond dynamics in a simple system is needed. In linear IR spectroscopy, a single peak caused by fast coherence transfer between two structures is not distinguishable from a peak with a similar shape, but coming from a continuous distribution of structures. In 2D IR spectroscopy, however, the line widths along the anti-diagonal and the diagonal are different and change with temperature thereby exposing the coherence transfer.
In a certain sense, all line broadening effects in vibrational spectra of solutions that derive from fluctuations of the vibrational frequency might be thought of as exchange amongst large numbers of solvent-solute configurations that are very close in energy. But, in the example described here a special role is ascribed to exchange between two particular configurations that have identifiably different mean frequencies under certain conditions. These configurations correspond to two distributions of a CH3CN molecule in relation to the surrounding CH3OH molecules– one that is more strongly H-bonded than the other: we refer to these two distributions as the H-bonded (H) and free (F) states, respectively. The H-bonded CN has the higher vibrational frequency.18
Experimental Methods
The experimental laser and processing methods are the same as previously reported in detail.5,19,20 Briefly, three transform limited 75-fs (200 cm−1 spectral width at FWHM) pulses at time intervals τ, between the first and second, and T, between the second and third, centered at 2250 cm−1 were used to generate the photon echo in a phase-matched direction. The signal was combined with a fourth pulse, separated from the third pulse by a fixed time delay of ~1.5 ps, and dispersed by a monochromator. The Fourier transform of the heterodyned signal along τ yielded the 2D IR spectra at each T: these spectra are presented as plots of ωτ versus ωt corresponding to the Fourier components of the τ and t scans. A solution of 1.5 M CH3CN in MeOH was used and the optical density of the sample was ~0.2 in a 56-μm path length CaF2 cell.
Results
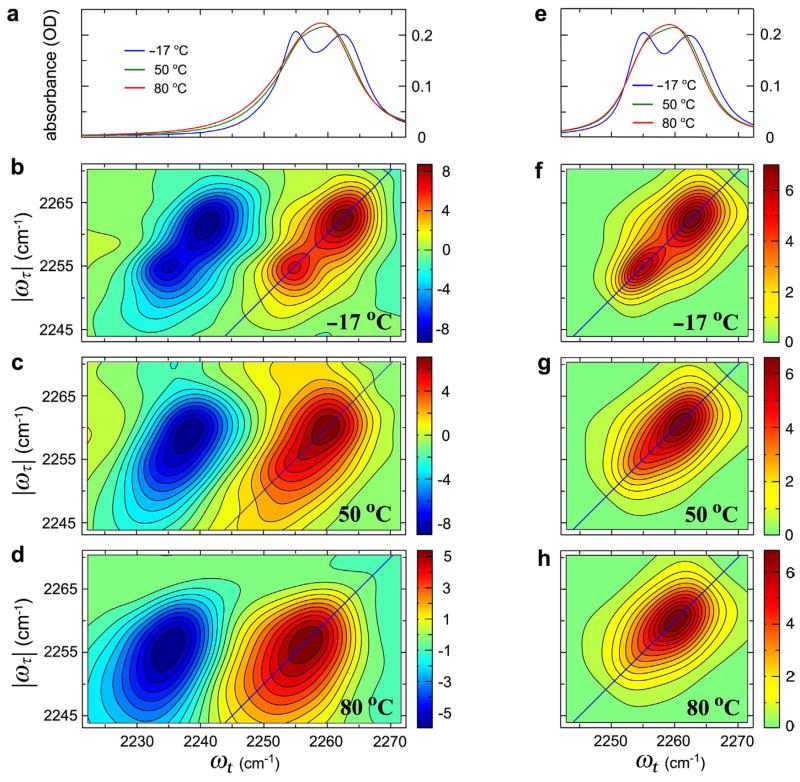
Figure 1 shows the linear FTIR spectra and 2D IR spectra at −17 °C, 50 °C, and 80°C. The two separate peaks in the FTIR at −17 °C are the CN stretch modes corresponding to the free (~2254 cm−1) and H-bonded (~2263 cm−1) configurations. The FTIR spectra at 50 °C and 80 °C manifest only one peak suggestive of partial dynamic averaging. The peak frequencies ascribed to free and H-bonded correspond closely to those of acetonitrile in nonpolar and aqueous solvents,18 respectively. The 2D IR spectrum contains two components (red and blue in Figure 1) that correspond to the contributions of the v = 0 → v = 1 transitions (red) and v = 1 → v = 2 transitions (blue) to the echo. Focusing on the v = 0 → v = 1 region at −17 °C and T = 0, the two peaks of the linear spectrum are clearly seen on the diagonal of the 2D IR. In addition, there is a suggestion in Figure 1b of cross peaks, shown at (|ωτ|, ωt)=(~2262 cm−1, ~2254 cm−1) and (~2254cm−1, ~2262 cm−1), linking these transitions. The presence of cross peaks at would imply that there is some fast coherence transfer even at −17 °C. In the case of T = 0, the cross-peaks are caused by the transfer of coherence during the τ and t times. Cross-peaks can be generated both by chemical exchange of populations5 (during the waiting time) and dynamic exchange (during the coherence times). The effect of cross peaks is to change the appearance of the 2D IR spectrum from a diagonally elongated double peaked shape to a more square shape having peaks at each vertex. At 50 °C the 2D IR spectrum at T = 0 shown in Figure 1c clearly shows more elongated peak shapes along the anti-diagonal line compared with those collected at lower temperatures:5 the spectrum no longer reveals two distinctive peaks along the diagonal. As shown in ref. 5, when the waiting time T is increased from zero, the peak shape becomes even more anti-diagonally elongated due to the cross peaks arising from the exchange of populations. The 2D spectra at 80 °C and T = 0 show significant elongation of the peak shapes along the anti-diagonal direction in both the v = 0 → v = 1 and v = 1 → v = 2 regions indicative of an increase in the contribution of cross peaks to the spectrum. At 80 °C the coherence transfer is already fast enough to make the 2D IR peak shapes in each spectral region almost circular as seen from Figure 1.
Figure 1.
Experimental (a–d) and simulated (e–h) linear and 2D IR spectra of acetonitrile in methanol. Experimental (a) and simulated (e) linear IR spectra of CH3CN in MeOH at −17, 50, and 80 °C. (b–d) The real part of the purely absorptive 2D IR spectra of CH3CN in MeOH at −17, 50, and 80 °C at waiting time T = 0. (f–h) 2D IR spectra in the region of the v = 0 → v = 1 transition simulated using parameters given in the text at −17, 50, and 80 °C.
The vibrational coherences (ρ01 ≡ ρv=0,v=1) for the two configurations H and F having frequencies and should satisfy a Liouville equation:
| (1.1) |
where the off-diagonal kHF and kFH are the forward and backward coherence transfer rate coefficients, respectively. The total homogeneous dephasing rates are and independent of population relaxation due to chemical exchange. The forward and backward exchange rates in each vibrational state which are connected by microscopic reversibility.5 The solutions of Eq. 1.1, dependent on the initial coherences introduced by a pulse, are easily found analytically in terms of the average frequency ω̄, relaxation rate γ̄ and exchange rate k̄, and the differences , and Δk̄ (kHF − kFH) / 2 as:
| (1.2) |
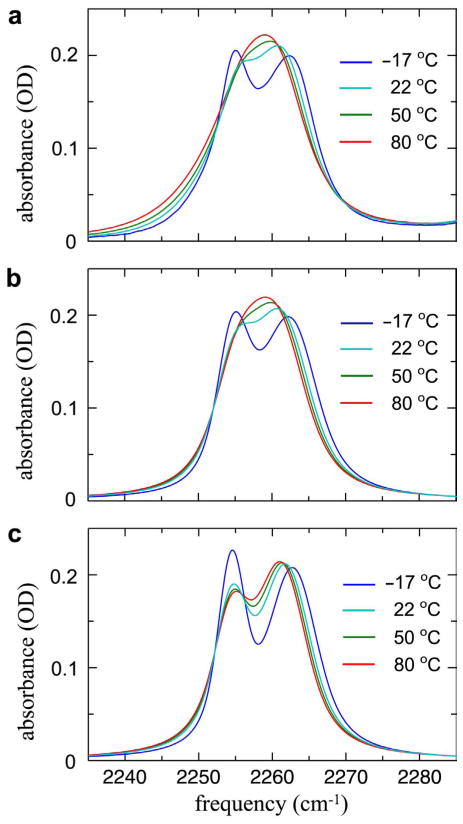
where a = −iω̄−(γ̄+k̄), b = k̄, c = −iΔk̄, d = −iΔω̄−(Δγ̄+Δk̄), and . The angle brackets symbolize integration over a Gaussian distribution of frequencies. The linear IR spectrum is given by the half Fourier transform of where nH and nF are the equilibrium fractions of H and F. The linear spectra computed from Eq. 1.2 are shown in Figure 1e, and more detail is given in Figure 2. They agree well with the experiments over the whole temperature range showing that indeed the vibrational coherence transfer between H and F is a key factor in the linear IR spectral shape. Figure 2c shows the simulation using Eq. 1.2 with all the same parameters except that kHF = kFH = 0. The linear spectrum is relatively insensitive to small changes in the inhomogeneous distribution in the range of 1.2 to 2.0 cm−1. The coherence transfer rates k̄ are in the 1011 s−1 range (see parameters below). If the coherence transfer is caused by population dynamics, then k̄ should be the average of the kinetic exchange rates in the v = 0 and v = 1 states.
Figure 2.
Experimental and simulated linear IR spectra of acetonitrile in methanol. (a) Experimental FTIR spectra of CH3CN in MeOH at various temperatures. (b) Simulated FTIR spectra of CH3CN in MeOH at various temperatures including the hydrogen-bond exchange induced coherence transfer. (c) Simulated FTIR spectra of CH3CN in MeOH at various temperatures without the hydrogen-bond exchange; i.e., kHF = kFH = 0.
A Bloch dynamics description of the 2D IR spectrum requires the impulsively generated coherences and , which are obtained from an equation of the form of Eq. 1.2 but with the initial conditions at chosen at time τ, thus:
| (1.3) |
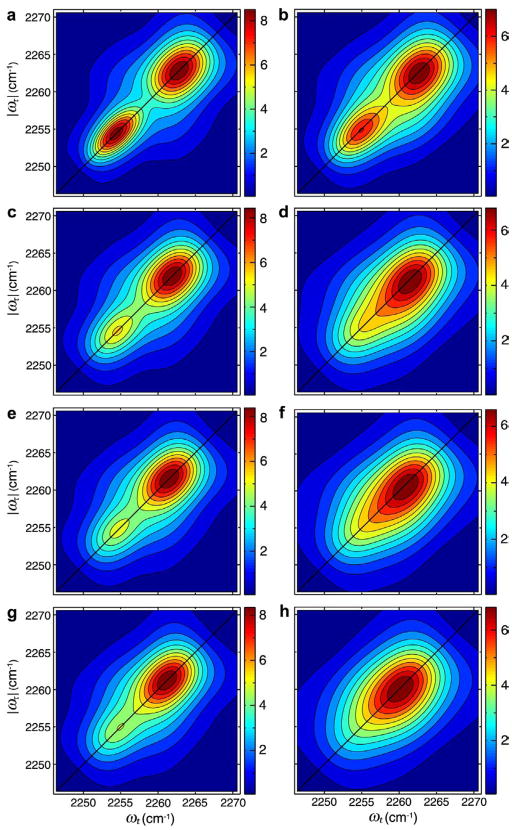
The fixed inhomogeneous distribution was incorporated by averaging the frequencies implicit in Eq. 1.3 over a bivariate Gaussian distribution. Again this approach omits any spectral diffusion which we will deal with in a separate paper. The 2D IR spectra along ωτ and ωt are obtained from half Fourier transforms along τ and t. Figure 3 shows the influence of fast dynamic exchange to the 2D IR spectra in the v = 0 → v = 1 region by comparing signals with and without coherence transfer between uncorrelated distributions at different temperatures. The key feature of the 2D simulations is the coalescence of two separated peaks into a single one along both the diagonal and anti-diagonal line. There are other cross-peaks, such as those caused by the interaction of two CN stretch peaks with two weak transitions located at ~2275 cm−1 and 2245 cm−1 and a strong transition located at ~2297 cm−1, that distort the shape of experimental 2D IR spectra. The simulated linear and 2D IR spectra were obtained with the foregoing theoretical expressions using parameters at −17°C, 22°C, 50°C and 80°C respectively as follows: ; kHF = 0.87, 1.2, 1.4 and 1.6×10¹¹s‒1; and kFH = 1.2, 1.5, 1.8 and 2.0×10¹¹ s−1. Other parameters were , μA:μB = 1: 0.88 and the previously determined free energy difference ΔGHF = 700 J/mol. The coherence transfer rate coefficients used for the present simulations are exactly in the range of the kinetic coefficients measured previously,5 which were in the range of 0.73 to 1.3 ×10¹¹ s−1 at temperatures of −17 °C to 22 °C.
Figure 3.
Simulated absorptive 2D IR spectra in the v = 0 → v = 1 region with and without hydrogen-bond exchange induced coherence transfer at various temperatures. The H-bond exchange is excluded in (a), (c), (e), and (g), and included in (b), (d), (f), and (h). The temperatures are −17 °C (a and b), 22 °C (c and d), 50 °C (e and f), and 80 °C (g and h).
The fluctuations in the H and F frequencies were chosen to be uncorrelated which fitted the 2D IR spectral shapes better than them being correlated. The dephasing rates and the exchange rates are of the same order, and the average exchange rate at 80 °C is about twice of that at −17 °C consistent with our previous free energy of activation measurements.5 From the spectra shown in Figures 2 and 3, we clearly observe the role of the coherence transfer in the linear and 2D spectra. Furthermore, the coherence transfer rates given above are equal within experimental error to the kinetic constants found from the T-dependence of the 2D IR signal in previous work5 confirming that population redistribution is the dominant mechanism of coherence transfer in this case.
Acknowledgments
This research was supported by the NSF-CHE and NIH with instrumentation from the NIH Resource P41-RR01348.
References
- 1.Hamm P, Lim M, Hochstrasser RM. J Phys Chem B. 1998;102:6123. [Google Scholar]
- 2.Asplund MC, Zanni MT, Hochstrasser RM. Proc Natl Acad Sci USA. 2000;97:8219. doi: 10.1073/pnas.140227997. [DOI] [PMC free article] [PubMed] [Google Scholar]
- 3.Khalil M, Demirdoeven N, Tokmakoff A. J Phys Chem A. 2003;107:5258. [Google Scholar]
- 4.Sandstroem J. Dynamic NMR Spectroscopy. 1982. [Google Scholar]
- 5.Kim YS, Hochstrasser RM. Proc Natl Acad Sci USA. 2005;102:11185. doi: 10.1073/pnas.0504865102. [DOI] [PMC free article] [PubMed] [Google Scholar]
- 6.Woutersen S, Mu Y, Stock G, Hamm P. Chem Phys. 2001;266:137. doi: 10.1073/pnas.201169498. [DOI] [PMC free article] [PubMed] [Google Scholar]
- 7.Kwac K, Lee H, Cho M. J Chem Phys. 2004;120:1477. doi: 10.1063/1.1633549. [DOI] [PubMed] [Google Scholar]
- 8.Zheng J, Kwak K, Asbury J, Chen X, Piletic IR, Fayer MD. Science. 2005;309:1338. doi: 10.1126/science.1116213. [DOI] [PubMed] [Google Scholar]
- 9.Nibbering ETJ, Elsaesser T. Chem Rev. 2004;104:1887. doi: 10.1021/cr020694p. [DOI] [PubMed] [Google Scholar]
- 10.Kreevoy MM, Mead CA. J Am Chem Soc. 1962;84:4596. [Google Scholar]
- 11.Turner JJ, Grevels FW, Howdle SM, Jacke J, Haward MT, Klotzbuecher WE. J Am Chem Soc. 1991;113:8347. [Google Scholar]
- 12.Turner JJ, Gordon CM, Howdle SM. J Phys Chem. 1995;99:17532. [Google Scholar]
- 13.Grevels FW, Kerpen K, Klotzbuecher WE, McClung RED, Russell G, Viotte M, Schaffner K. J Am Chem Soc. 1998;120:10423. [Google Scholar]
- 14.Londergan CH, Kubiak CP. Chem Eur J. 2003;9:5962. doi: 10.1002/chem.200305028. [DOI] [PubMed] [Google Scholar]
- 15.Stires JCIV, McLaurin EJ, Kubiak CP. Chem Commun. 2005:3532. doi: 10.1039/b504416b. [DOI] [PubMed] [Google Scholar]
- 16.Khalil M, Demirdoven N, Tokmakoff A. J Chem Phys. 2004;121:362. doi: 10.1063/1.1756870. [DOI] [PubMed] [Google Scholar]
- 17.la Cour Jansen T, Hayashi T, Zhuang W, Mukamel S. J Chem Phys. 2005;123:114504/1. doi: 10.1063/1.2008251. [DOI] [PubMed] [Google Scholar]
- 18.Eaton G, Pena-Nunez AS, Symons MCR, Ferrario M, McDonald IR. Faraday Discuss Chem Soc. 1988;85:237. [Google Scholar]
- 19.Kim YS, Wang J, Hochstrasser RM. J Phys Chem B. 2005;109:7511. doi: 10.1021/jp044989d. [DOI] [PubMed] [Google Scholar]
- 20.Kim YS, Hochstrasser RM. J Phys Chem B. 2005;109:6884. doi: 10.1021/jp0449511. [DOI] [PubMed] [Google Scholar]


