Abstract
In this paper, a novel approach is proposed for perceptual grouping and localization of ill-defined curvilinear structures. Our approach builds upon the tensor voting and the iterative voting frameworks. Its efficacy lies on iterative refinements of curvilinear structures by gradually shifting from an exploratory to an exploitative mode. Such a mode shifting is achieved by reducing the aperture of the tensor voting fields, which is shown to improve curve grouping and inference by enhancing the concentration of the votes over promising, salient structures. The proposed technique is applied to delineation of adherens junctions imaged through fluorescence microscopy. This class of membrane-bound macromolecules maintains tissue structural integrity and cell-cell interactions. Visually, it exhibits fibrous patterns that may be diffused, punctate and frequently perceptual. Besides the application to real data, the proposed method is compared to prior methods on synthetic and annotated real data, showing high precision rates.
Index Terms: Adherens junctions, curvilinear structures, perceptual grouping, iterative tensor voting
I. Introduction
Nearly one third of the human genome is involved in the regulation of membrane-bound macromolecules. Adherens junctions (e.g., E-cadherin) form an important subclass that maintains tissue architecture and cell-cell interactions on a multicellular model system. For example, it is well-known that the loss of E-cadherin increases motility and contributes to cancer progression. However, signals associated with the adherens junctions can be sequestered along neighboring cells and form perceptual curvilinear structures.
It is well known that perceptual grouping is present in the human vision system as bottom-up preattentive processes that aid in object-level delineation and recognition [1]. From when it was initially conceived by the Gestalt psychologists [2] to now, perceptual grouping has evolved from the passive observation of human behavior to its inclusion in a wide-range of computer vision applications [3]–[6]. Perceptual grouping mainly appeals to image segmentation because of its preattentive use of local cues, which reduces its complexity as well as reduces the necessity for prior knowledge when inferring structures from images. On the negative side, by relying on computed local cues from images, perceptual grouping approaches can be susceptible to scale variations and noisy measurements.
In this paper, we propose a grouping approach that explores purely preattentive cues, such as proximity, good continuity of image primitives, and minimization of the measurements’ sensitivity to scale and noise by employing an iterative voting strategy to structural inference. The method proposed here is able to infer curvilinear structures from ill-defined, noisy, often incomplete signals, such as those found in the adherens junctions shown in Fig. 1.
Fig. 1.

Adherens junctions exhibit complex patterns. The signal is frequently diffused and sequestered along the cell membranes.
A. Previous Work
In order to illustrate applications of perceptual grouping in the context of image structure inference and segmentation, we begin by citing the basilar works from [7]–[9], [11], [12], [18]. Marr [7] was one of the first researchers to publish the importance of preattentive cues for image understanding. Ullman [9], in a milestone for image completion, addressed the problem of image edge grouping with an optimizing cost function based on smoothness of the contour curvature. Hérault and Horaud [12] also used an optimization approach to segment oriented edges into figure and background. They utilized simulated annealing to maximize a cost function based on proximity, contrast and co-circularity. However, Lowes [8] was one of the first researchers to document utilization of perceptual grouping as part of the solution of a computer vision problem. In that context, perceptual cues such as proximity, collinearity and parallelism were used to produce structural hypotheses for a model based matching algorithm, thereby permitting spatial correspondences between 2D images and 3D object models and, consequently, the recognition of real-world objects. Alternatively, Parent and Zucker [11] proposed an iterative, graph-based labeling scheme that utilized local kernels, whose topography incorporated the good continuity aspect of the Gestalt philosophy to detect local organization and infer curves from images. But it was Sarkar and Boyer [18] who combined proximity, good continuity, parallelism, and perpendicularity to establish pairwise relationships between image primitives and to populate a compatibility graph whose spectra (eigenvalues and eigenvectors) revealed curvilinear structures in an image. From all these approaches, it is important to highlight the researchers’ common pursuit of the ideal set of Gestalt principles for perceptual grouping. Also, the set of perceptual cues was generally combined into a cost function that is presently called saliency. The terms less salient or more salient are, therefore, applied according to a structure’s weaker or stronger response to the saliency function.
In the context of voting as a precursor for perceptual grouping, many methods have been developed. For example, Hough [25] introduced the notion of parametric clustering in terms of well-defined geometry, which was later extended to the generalized Hough transform [30]. Sarkar and Boyer [15] introduced a technique that infers structures in an image after voting for the most promising ones from a pool of structural hypotheses. Parvin et al. [26] developed an iterative voting system that employs funneling kernels to refine paths along low curvature regions in images. Guy and Medioni [23] proposed a general purpose approach (later revisited and formalized as the tensor voting framework [24]) that uses deformable unities to reveal perceptual structures. Tong and Tang [35] proposed an adaptive tensor voting for improved gap filling and contour closure. Their three-pass tensor voting approach promoted improvements in gap filling over the classical tensor voting. An iterative version of the tensor voting framework is described by Fischer et al. [32], who demonstrated how re-voting improves the orientation estimation at the input primitives and, therefore, the overall curve inference result. Loss et al. [33] described a scheme for figure-ground segmentation based on tensor voting that gradually eliminates background elements after multiscale voting iterations. They demonstrated the improvements caused by re-voting for figure characterization in cluttered scenarios.
In general, voting operates as a function of continuity and proximity, which can occur at multiple scales (e.g., points, lines, parallel lines, etc). One of the main advantages of voting frameworks is their reliance on relative simple models, which considerably reduce the number of free parameters and the overall complexity.
B. Motivation
Inference of curvilinear structures from image primitives is particularly relevant to biomedical image analysis. In this field, many detection and recognition methods rely on good markers delineating the objects of interest (e.g., [20]–[22]). However, inherent technical and biological variations affect signal quality in different ways. For example, adherens macromolecules, responsible for tissue architecture, can provide morphological indices that quantify the loss of tissue organization and cellular morphology as a result of stress conditions.
From the point of view of image segmentation, traditional perceptual grouping of curvilinear structures strongly relies on (i) good contrast between lines and background, (ii) well behaved structural definition of the lines, and (iii) a good assumption of the lines’ scale. However, with optical resolution, adherens junctions can be ill-defined and, therefore, inconsistent with all the above assumptions. For example, they may have non-uniform intensity, be punctate (e.g., perceptual with gaps), be diffused at certain locations, and have distinct widths and lengths (Fig. 1). This significant amount of heterogeneity can happen as a result of the natural variation of chemical binding between the molecules and the staining reagent, or other technical and biological variables.
For these very reasons, a requirement for grouping ill-defined curvilinear structures should not assume (i) rigid models (e.g., [25], [30]), or (ii) a pre-computed set of image primitives (e.g., [9], [31], [32]), or (iii) segments solely extracted from boundaries (e.g., [15], [33], [36]). In addition, due to the continuous refinement required to better detect heterogeneous, low signal-to-noise contours, non-iterative approaches are mostly unsuitable (e.g., [24], [35]).
C. Approach
Our work builds upon Guy and Medioni’s Tensor Voting Framework [24] and the Iterative Voting Framework by Parvin et al. [26] in order to produce an efficient method to enhance and infer perceptually interesting curvilinear structures in images. By coupling tensor and iterative voting fundamentals, we leverage advantages of both methods to produce better results than those achieved by them individually. The main novelty of our method lies in the extension of the tensor voting framework to gradually refine curvilinear structures at different scales. Iterative funneling of tensor fields is shown to achieve better definition of pixel orientation and connectivity. This funneling operation gradually increases the concentration of the votes’ energy over promising areas, eventually improving the inference of curvilinear structures.
In one classical tensor voting approach, thresholding is applied to the resulting saliency map, thus removing tensors with low saliency. The remaining tensors are then assumed to be part of the salient structures [29]. When voting is performed on a sparse basis (i.e., image primitives are extracted prior to tensor voting), a second pass of dense tensor voting, called densification, is sometimes used [24]. However, in the method proposed here, we impose a set of consecutive tensor voting passes, all in a dense fashion, after thresholding out tensors with low saliency in a conservative manner. Instead of densification, each iteration of the proposed approach aims at refining the previous one, where magnitude and orientation might have been disturbed by frequent low-saliency background noise. These steps resemble the ones performed in [19], where a second pass of the Hough transform voting pass is introduced to fix or refine the elements’ orientation, and in [11], where a relaxation-like iterative process seeks convergence and consistence of the inferred structures. Note that the benefits of conservative elimination of tensors with low saliency from the tensor voting application were investigated and explored in [33].
In order to assess the improvements yielded by the iterative tuning of tensor voting, we performed experiments involving synthetic configurations and real microscopic images. Synthetic data were used to help us analyze and predict the behavior of the method on structures with different degrees of punctation, width, curvature and junctions. Experiments on microscopic images aim at evaluating the method on real scenarios, providing proof of its actual potential and effectiveness.
Components of this paper have already appeared in two other versions as conference papers by the same authors: an introduction to an earlier version of the method, along with some preliminary results focusing particularly on its application from a biological point of view, is in [16]; and a slightly longer version appeared in [17]. In this paper, however, we provide a deeper and more detailed description of the improved technique, besides quantitative analysis on synthetic data, and comparisons with other approaches to the same problem.
The remaining of this paper is organized as follows: Section II describes the tensor voting and the iterative voting frameworks, along with their applications to perceptual grouping of linear structures. Section III introduces our method, extending the concepts of the tensor and the iterative voting frameworks. Experimental results are shown in Section IV, and conclusions are presented in Section V.
II. Voting Frameworks
A. The Tensor Voting Framework
In the framework proposed in [24]1, perceptual grouping is achieved by vote casting between primitives of an image. Such primitives are represented by tensors, mathematical entities whose capability for encoding magnitude and orientation make tensor voting particularly efficient for detection of perceptually organized structures, such as edges, lines and regions. In 2D, tensors are represented analytically as second order nonnegative definite matrices, or geometrically as ellipses, shaped by the tensors eigenvalues’ magnitude and eigenvectors’ directions. Initialized with an arbitrary size, shape and orientation, input tensors are deformed due to the accumulation of votes cast by other neighboring tensors.
Votes are tensors composed of magnitude and orientation, which encode the Gestalt principles of proximity, smoothness and good continuation. The tensor’s size and shape are given by its eigenvalues (λ1, λ2; λ1 ≥ λ2 ≥ 0), while its orientation is given by the respective eigenvectors (e⃗1, e⃗2). For example, consider two tensors, positioned at (x, y) and (u, v), in the (x′, y′) coordinate system, as shown in Fig. 2. How can the vote from (x, y) be cast onto (u, v) subject to smoothness and proximity as stated before? The simplest way is to model smoothness and proximity as curvature and arc length, respectively. Let l be the distance between the two positions, and θ be the angle between the tangent of the osculating circle at (x, y) and a line that connects (x, y) to (u, v). The arc length and curvature are given by s = θl/sin(θ) and κ = 2sin(θ)/l, respectively. Without any prior knowledge, the path defined by an osculating circle provides the minimum energy since its curvature is kept constant. The vote at position (u, v) is thus given by Equation 1 [24].
Fig. 2.
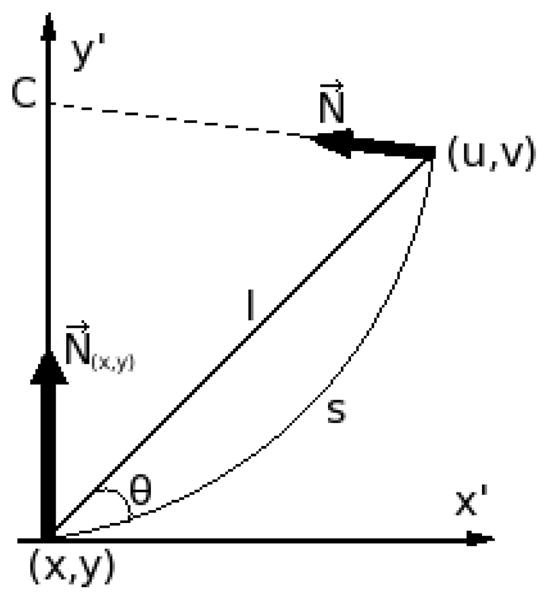
Two tensors and their geometrical relationship to produce the vote V (u, v) expressed by Equation 1 (figure redrawn from [34]).
| (1) |
Here, N⃗ is the vector normal to the tangent of the same osculating circle at (u, v), which points to the center C of the circle. It can be calculated by [−sin(2θ) cos(2θ)]T. The scale factor σ is the only free parameter in this expression and determines the extension of the voting neighborhood. The parameter c is a function of the scale and has been optimized at c = −16ln(0.1) × (σ − 1) × π−2 to control the decay at high curvature areas (for instance, where two orthogonal lines meet to form a rounded corner) [24].
Depending on the nature of the input primitives, prior information about their orientation can also be used when available. The tensor voting framework was designed to offer two possible voting configurations: one that concentrates the votes according to the input orientation (Fig. 3(a) - stick field), and another one that casts votes radially (Fig. 3(b) - ball field), respectively. The voting fields are the composition of all votes that can be cast from a tensor located in the center of the field to its neighboring tensors. Their extension is controlled by σ and, for practical reasons, the fields are usually truncated past 99% decay. In addition, the stick field is limited to exist only at |θ| ≤ 45°, as beyond this angle the osculating circle ceases to represent the smoothest path between the tensors. A somewhat similar kernel topography is also found in [9], [13].
Fig. 3.
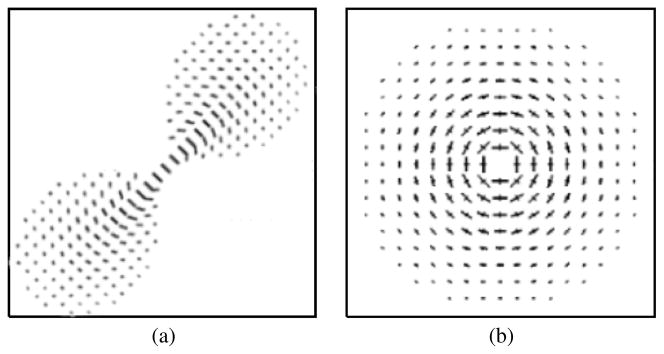
Tensor voting fields. (a) Stick field - when an estimate of the initial orientation is known, and (b) Ball field - when orientation information is unknown.
The tensor deformation imposed by accumulating the strength and orientation of the votes eventually reveals behavioral coherence among image primitives. The vote accumulation is simply tensor addition (e.g., summation of matrices), which can be algebraically represented by Tuv = ΣTxyV (u, v), where Tuv is the resulting tensor at location (u, v), after receiving the votes V (u, v) from its neighboring tensors Txy at locations (x, y). Each kind of structure is expected to produce tensors of a particular shape: for example, very elongated tensors (high λ1 − λ2) for lines, and more rounded ones (low λ1 − λ2) for regions. Fig. 4 exemplifies how a set of input primitives are encoded as tensors, whose deformations resulting from accumulated votes reveal an underlying salient linear structure.
Fig. 4.
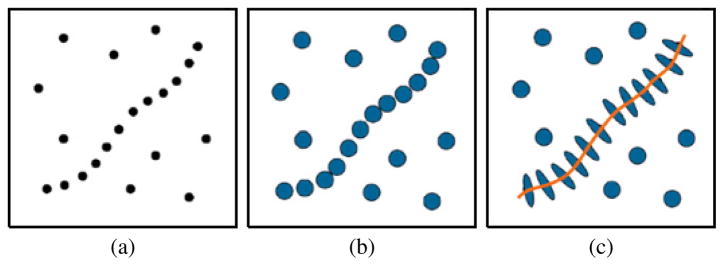
Example of perceptual grouping through tensor voting. A set of (a) input primitives are (b) encoded as tensors, whose (c) resulting deformations reveal a curve.
The voting process can also be either sparse or dense. Sparse voting restricts tensors to cast votes only on other encoded input tensors, while dense voting extrapolates the input configuration allowing tensors to cast votes everywhere within their neighborhood. Tensor voting has been shown to be robust to considerable amounts of noise and does not depend on critical thresholds.
B. The Iterative Voting
The framework proposed in [26], [38] also uses spatial voting to detect radial symmetry and to group curvilinear patterns. Similar to the tensor voting framework, each pixel propagates its structural likelihood within its neighbors by vote casting. Here, however, the propagated information is based on either spatial curvature or gradient features and a set of precomputed Gaussian kernels with a preferred topography to elucidate desirable saliency. The kernels’ topography was devised to incorporate the Gestalt principles of proximity and continuity. The iterative voting includes a funneling modification of the kernels as iterations progress. The funneling process is aimed at concentrating the voting energy over emerging promising areas by gradually reducing the kernel’s aperture. For each pixel at position (x, y), its vote casts to the neighboring pixels (u, v) by Equation 2:
| (2) |
where , and σ is a scale parameter that regulates the extent and decay of the function’s influence. A(σ, θ) is the limiting cone that extends longitudinally up to a radius which is a function of σ, and transversally of an angle θ. At each iteration, θ is reduced by Δθ. Fig. 5 illustrates V (u, v) at consecutive iterations (i.e., with different θ) bound by A(σ, θ), in red.
Fig. 5.

The iterative voting kernel’s topography (only one side is shown) as a function of θ. The voting energy is funneled as iterations progress.
Iterative voting is as follows: at iteration i, the kernel V, with θi = θi−1 − Δθ, is placed over a voting pixel (x, y), and oriented along the pixel’s direction. Each neighboring pixel (u, v) receives the corresponding vote Vx,y(u, v), and accumulates its magnitude. At the first iteration, gradient or curvature is used to estimate the direction at (x, y). At any consecutive iteration i + 1, the orientation at (x, y) is recomputed so that it points at its adjacent neighbor with the maximum magnitude (i.e., accumulated votes). Since a better estimation of the structural localization and local orientation are produced after each iteration, the kernels have their energy gradually funneled from initially diffused to eventually very focused. Note that θ changes linearly with i.
III. Iterative Tensor Voting
We build upon the Tensor Voting and the Iterative Voting frameworks in order to leverage advantages from both methods, and produce a robust method to group perceptually punctate patterns (e.g., sequestered macromolecules between neighboring cells). The approach is based on progressive funneling of the stick tensor voting field (Fig. 3), which enhances the concentration of the votes over salient features, as observed in [26] for the Iterative Voting. The input to our method is the image itself (i.e., an intensity map), and the output is the inferred salient curvilinear structures. This approach is compared with two prior methods to demonstrate superior performance on images whose structures (i) may be highly punctate, (ii) are surrounded by clutter, and (iii) have nonuniform and diffused intensities.
A. Image encoding
The first step is the construction of a voting space. We start by encoding every pixel in the image as an unoriented tensor. In tensor voting, an unoriented tensor has a perfect circular shape or, analytically speaking, has λ1 = λ2. This dense encoding enables the method to be completely independent of pre-computations of any sort, such as curvature or gradient, which would force the method to rely on the quality of the image’s sparse representation and potentially impair the solution from the beginning. Assuming that the signal of interest has brighter intensity than its counterpart background, a tensor at location (x, y) in the image is encoded to have a size proportional to the pixel intensity Ixy (e.g., λ1 = λ2 = Ixy). If this assumption does not correspond with the images under analysis, adjustments must be made in this encoding in order to guarantee that the signal of interest is input as a larger tensor. For instance, λ1 = λ2 = Iwhite/Ixy, where Iwhite is the intensity of the color white in the image (usually 1 or 255), for a dark signal on bright background. The tensor direction e⃗1 and e⃗2 can be chosen arbitrarily, as it does not influence the ball tensor voting in any sense. An input tensor Txy at location (x, y) is thus:
B. Voting iterations
After the voting space is constructed, a tensor voting pass is executed using the ball field (Fig. 3(b)). The ball field is the only option here because no initial tensor orientation is known. Note, though, that disregarding the initial uncertainty about each pixel orientation, the ball field casts a vote with magnitude and orientation, which allows the tensors to start their characteristic structural deformation. Moreover, it should be noted that since all the pixels in the image were encoded, the voting cast is dense by nature (e.g., all tensors cast and receive votes). The deformation caused by locally accumulating all votes from the ball field tensor voting pass reveals, although still inaccurately, the presence of perceptual structures in the image, or lack thereof. The resulting tensor’s magnitude (λ1, λ2) and direction (e⃗1, e⃗2) are obtained by recomputing its eigen-decomposition. From the vote casting perspective, curvilinear structures are characterized by an unbalanced distribution of elements along one main direction. For this reason, in contrast to other structures, whose tensors tend to deform more evenly due to the influence from different directions, curvilinear structures produce elongated tensors. Therefore, tensors from curvilinear structures are likely to be evidenced within the stick saliency map (e.g., image formed by computing λ1 − λ2 at each location (x, y)). Following the same reasoning, one can note that junctions (a spot in the curve where two or more curves intersect) receive votes from possibly multiple directions, deforming more evenly than curvilinear structures. In order to assure completeness of the grouped curvilinear structures, the ball saliency map (e.g., image formed by computing λ2 at each location (x, y)) is summed to the resulting saliency map.
Our protocol then proceeds with iterative dense tensor voting, which aims at gradual refinement of the previous iterations. A thresholding step is introduced prior to each iteration so that the tensors that did not deform as expected for curvilinear structures (e.g., high λ1 − λ2) are removed. This thresholding is very conservative and aims at removing elements with extremely low saliency to enhance the processing speed. Therefore, only tensors whose saliency λ1 − λ2 is higher than a threshold value are encoded. Since the tensors are guaranteed to have a more or less accurate orientation (unoriented tensors are thresholded), consecutive iterations are performed with stick fields (Fig. 3(a)). Note that the voting employed is still dense, so every site receives a vote, even if not initially inputted. Each iteration refines the previous one, where the tensors’ magnitude and orientation seem to have been disturbed by the low-saliency but frequent background noise, as well as the often noisy properties found in ill-defined signals.
An interesting observation, inspired by the funneling progression of kernels proposed in [26], [38], is that the stick fields are gradually modified (e.g., the field aperture is reduced) as the voting iterations proceed and the orientation estimations become continuously more accurate. This funneling process is a key aspect of our algorithm. It gradually reduces the diffusion of votes and concentrates the votes only over promising lines, producing better, enhanced results. Fig. 6 illustrates their topography for five exemplar iterations. Given a voting scale σ and field aperture θ, the iterative tensor vote from a pixel (x, y) at a neighboring location (u, v) can then be computed by Equation 3.
Fig. 6.
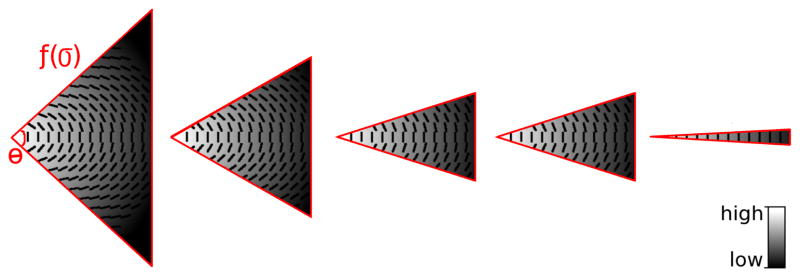
The iterative tensor voting kernel’s topography (only one side is shown) as a function of θ. The magnitude and orientation of votes vary within the kernel, while the kernel’s energy funnels as iterations progress.
Again, from Fig. 2 OP’s distance l and angle θ, s is the arc length and κ is the curvature. N⃗ is the vote direction and A(σ, θ) is the limiting cone that, as in the Iterative Voting, extends longitudinally up to a radius which is a function of σ, and transversally of the angle θ. c is the same as in the tensor voting framework.
| (3) |
The iterations can be stopped after (i) a pre-determined number of times, (ii) the quantized aperture of the voting field is small enough, producing the same field as in a previous iteration, or (iii) θ ≤ 0.
C. Curve inference
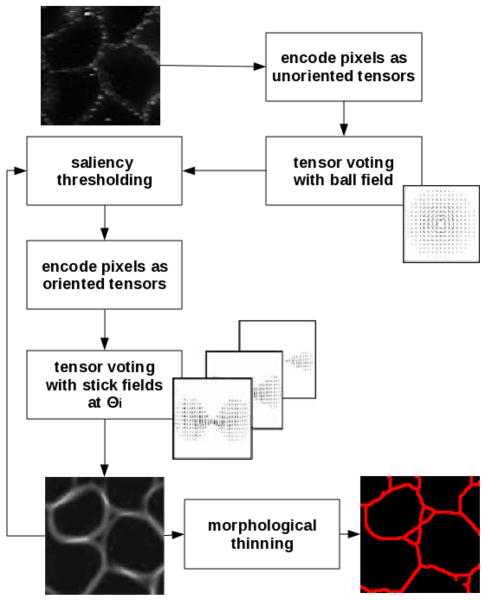
Iterative voting produces a saliency map where curvilinear structures are highly enhanced. Lines can be segmented from the saliency maps using any standard morphological thinning or non-maxima suppression technique, exploring magnitude and direction of the resulting saliency map. The outcome of this process is an image whose curvilinear structures are inferred. Fig. 7 depicts the entire process.
Fig. 7.
Inference of curvilinear structures by Iterative Tensor Voting. The primary theme is the feedback loop for refinement of the voting aperture.
D. Application to segmentation of adherens junctions
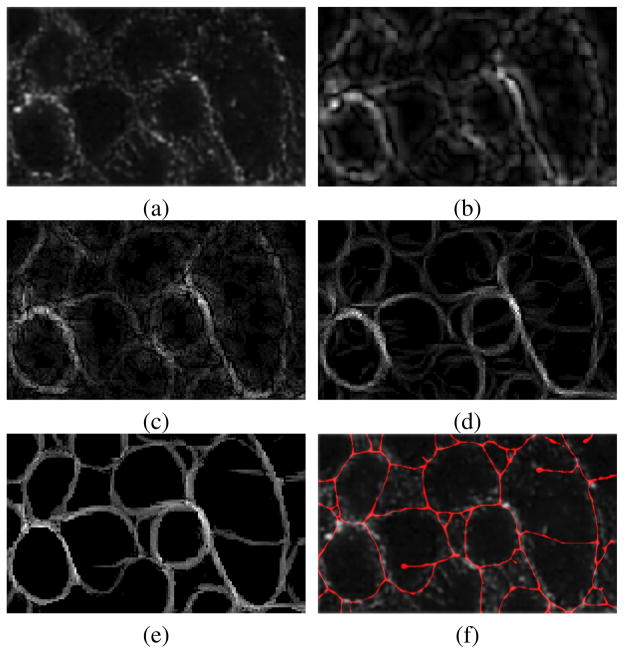
Fig. 8 shows an example of the adherens junctions imaged at 40× magnification and the intermediate results of tensor voting. It is clear that the proposed method regularizes and enhances punctate signals iteratively. In this context, the funneling process groups pixels belonging to the cellular structure with improved precision. The first iteration, produced by the ball voting, results in a diffused pattern. However, this is the initial condition where oriented stick tensor fields brings focus to the promising parts of the signal.
Fig. 8.
Grouping of adherens junctions through Iterative Tensor Voting. (a) Original signal; (b) result of first iteration; (c) and (d) examples of intermediate iterations; (e) grouped curvilinear structures; (f) inferred structures (red).
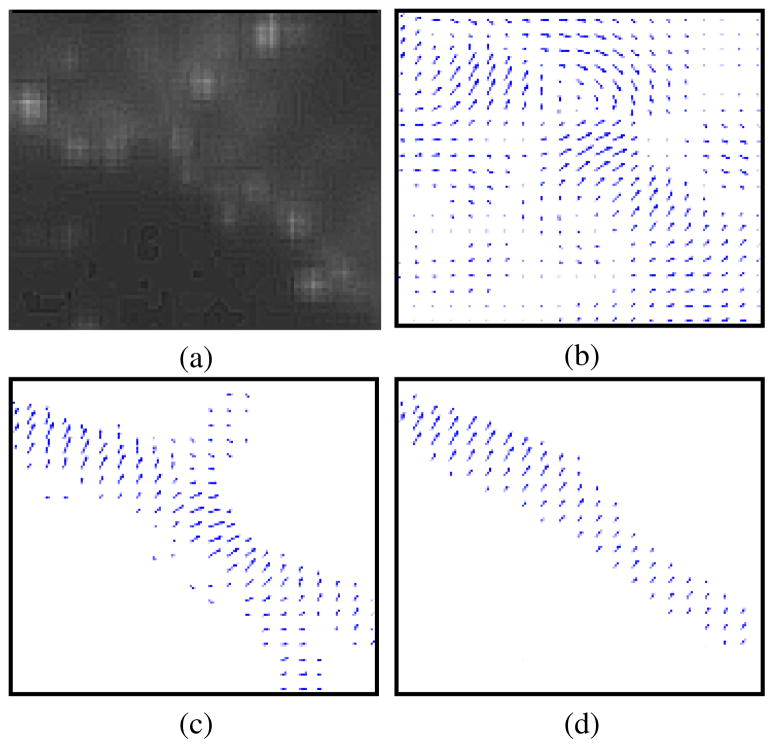
Fig. 9 and 10 show in more detail the nature of the imaged cell adherens junctions and sample results from the Iterative Tensor Voting iterations.
Fig. 9.

Close view of grouping through Iterative Tensor Voting. (a) Original signal; (b) first iteration (ball voting); (c) final iteration (at θ = 5°).
Fig. 10.
Progressive refinement of the voting landscape (tensors’ largest components) by Iterative Tensor Voting. (a) original image; (b) first iteration (ball voting); (c) four iterations (at θ = 30°); (d) final iteration (at θ = 5°).
IV. Evaluation
In this section, we demonstrate the performance of the Iterative Tensor Voting (ITV) for grouping of perceptual curvilinear structures, where validation has been performed on synthetic and annotated real data. The annotated data correspond to samples that have been imaged through fluorescence microscopy.
A. Synthetic Data
1) Experimental design
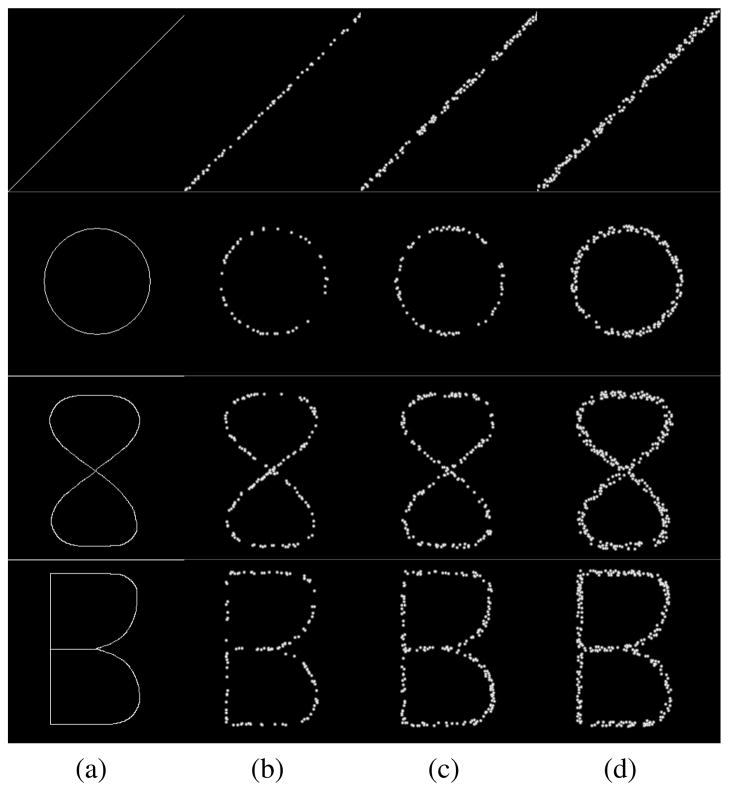
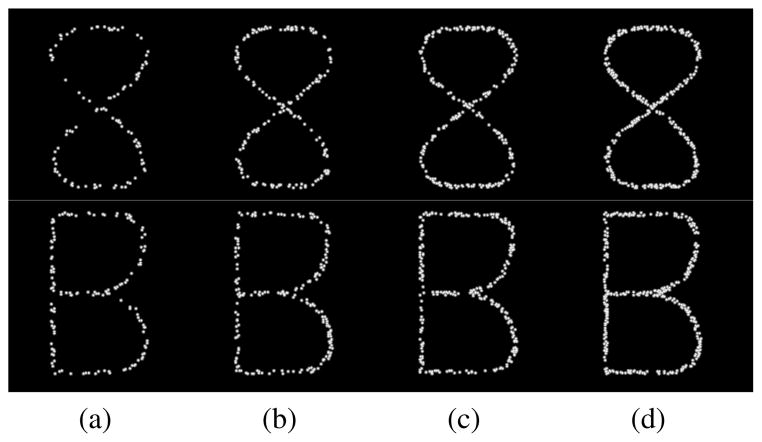
In order to test ITV’s applicability and limitations, a set of synthetic configurations were created. The synthetic data (top row) were generated to emulate a variety of spatially distributed signals, which are found in real data. Such a variety corresponds to the geometry of signal formation, density of punctation, signal width, and signal intensity. Figures 11 and 12 show samples of synthetic data that have been used for this study. The first column of Figure 11 shows the prototype geometry and signal composition through a (i) straight line, (ii) circle, (iii) figure eight-shaped object with an X-junction, in addition to a (iv) figure B-shaped object with a T-junction and a Y-junction. The data set has 48 images: 4 figures × 3 widths × 4 punctation densities. All images are 256-by-256 pixels with the intensity in the range of [0,1]. The processing parameters are σball = 10, Thresholdball = 40%, σstick = 3, T hresholdstick = 5%, Δθ = 5°.2
Fig. 11.
Synthetic data with fixed punctate density (0.09 points/pixel2) changing as a function of line width. (a) prototype signal; (b) 3 pixel-wide punctate signal; (c) 5 pixel-wide punctate signal; (d) 7 pixel-wide punctate signal.
Fig. 12.
Synthetic data with fixed width (5 pixels) changing as a function of punctation density. (a) 0.03 points/pixel2; (b) 0.05 points/pixel2; (c) 0.07 points/pixel2; (d) 0.09 points/pixel2.
2) Qualitative analysis
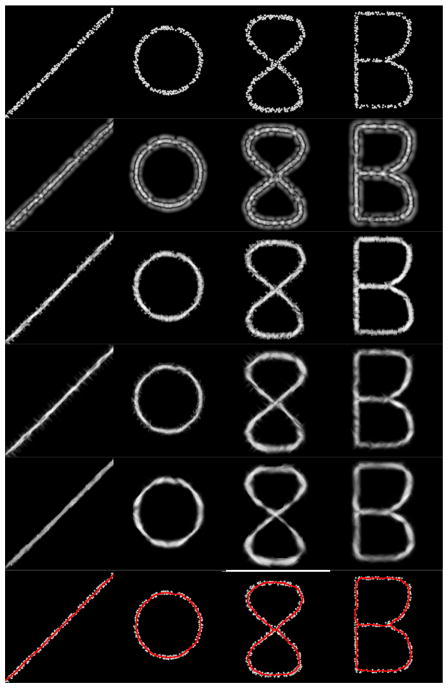
Fig. 13 shows the performance of ITV on three synthetic configurations. The first and last rows show the original configuration and the inferred curvilinear structure, respectively. The intermediate rows demonstrate stages of ITV. Rows 2 to 5 show saliency maps at different iterations, namely, ball voting and stick voting at θ = 45°, θ = 30° and θ = 15°. The results combine highly salient pixels from ITV’s stick or ball saliency maps. This is important for better preservation of junctions, whose conflicting orientations locally reduce the stick saliency (i.e., λ1 − λ2) and increase the ball saliency (i.e., λ2), as mentioned in Section III. It is clear that ITV can evolve from a punctate pattern to a strong filament. In this context, the dense voting allows pixels to be interpolated, thus, playing an important role in gap filling.
Fig. 13.
Progressive refinement and final delineation of the synthetic data by ITV. First row: punctate signals; second row: ball voting results; third to fifth rows: intermediate results with stick fields; last row: inferred structures over initial signal.
The synthetic data also allowed us to analyze ITV’s sensitivity to punctation. Figure 14 shows ITV’s inferred structure as a function of the punctation density. In general, one can observe that ITV performs fairly well in all cases where the punctate density is higher or equal to 0.05 points/pixel2 (14(b–d)). The highly punctate patterns of 14(a) can cause noisy inference of contours with potential gaps.
Fig. 14.
Qualitative analysis of ITV’s sensitivity to signal punctation. (a) 0.03 points/pixel2; (b) 0.05 points/pixel2; (c) 0.07 points/pixel2; (d) 0.09 points/pixel2. ITV performs fairly well at 0.05 points/pixel2 and above (b–d).
3) Quantitative analysis
We compared ITV’s performance quantitatively on the synthetic data set and compared it with its two precursory approaches: Tensor Voting (TV) and Iterative Voting (IV). For TV, σ = 10 and Threshold = 40%. For IV, σ = 10, δinitial = 30°, Δθ = 10°, Threshold = 1%; All parameters, including ITV’s, were defined by visual inspection of sample results, and used across all images in the data set and throughout the experiments in this paper. The percentage of mismatches between the methods’ inferred structure and the prototype signal at the correspondent width is used for quality assessment of the results.
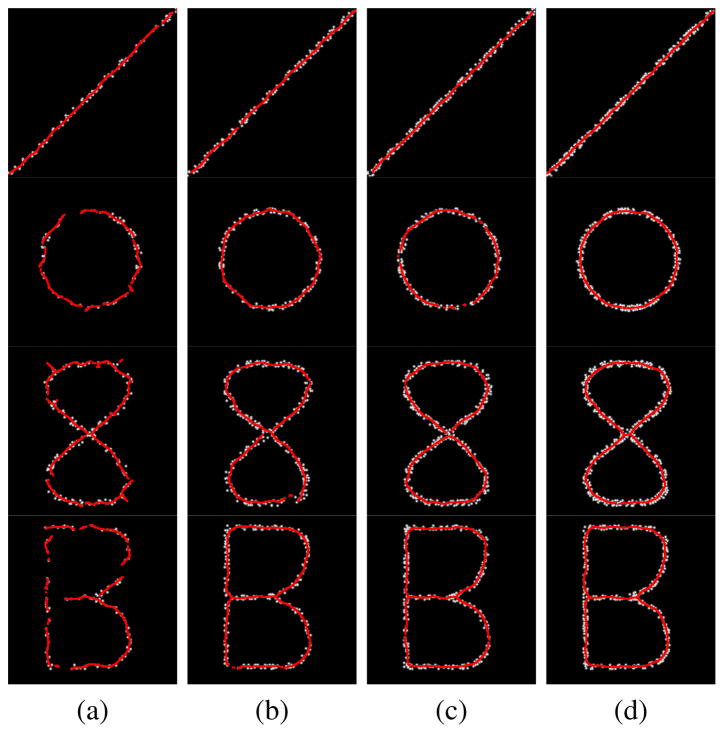
Figure 15 provides comparative results of each method on a dataset. Our analysis indicates that ITV provides more consistent results than its precursory approaches. A more detailed analysis of the visual results indicate that TV was incapable of closing big gaps along the contour. Although increasing the scale σ for tensor voting could potentially facilitate gap closure, it would also compromise the high frequency features, such as sharp corners and junctions. On the other hand, each iteration of ITV allows the curve to grow progressively and eventually close the gap. Furthermore, due to the highly punctate aspect of the signals, IV seems to fail to update the kernel’s orientation, producing misaligned fragments along the figure’s contour. Whereas, ITV’s iterations allow the pixels’ orientation to converge slowly (i.e., with low Δθ) and robustly towards the correct solution, producing smoother curves. Table I summarizes the results obtained by each method according to the signal width and punctation density.
Fig. 15.
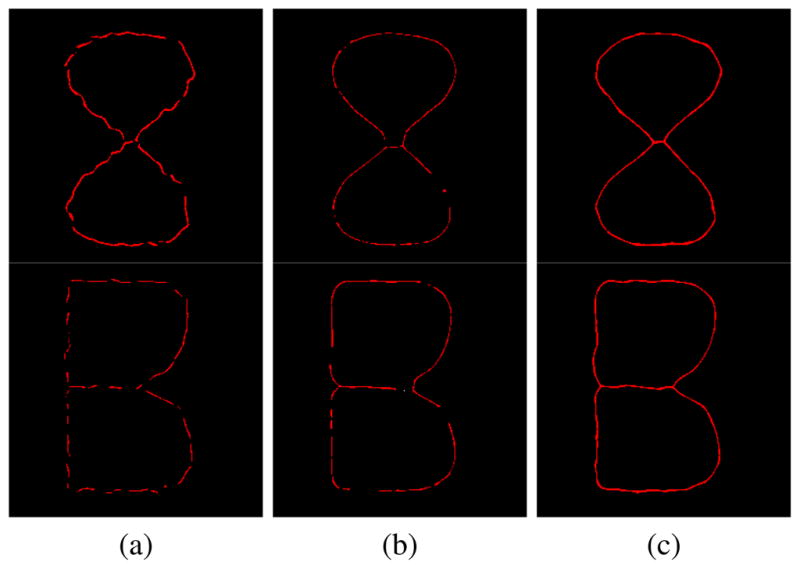
Qualitative comparisons between methods. Sample results produced by (a) IV, (b) TV, and (c) ITV. ITV produces smoother and more consistent curves than its precursory methods.
TABLE I.
Quantitative results for synthetic data.
| Method | Line Width (pixels) | Punctation Density (points/pixel2) | |||
|---|---|---|---|---|---|
|
| |||||
| 0.03 | 0.05 | 0.07 | 0.09 | ||
| IV | 3 | 54% | 65% | 78% | 82% |
| 5 | 59% | 68% | 79% | 83% | |
| 7 | 61% | 73% | 81% | 86% | |
|
| |||||
| TV | 3 | 64% | 70% | 82% | 90% |
| 5 | 64% | 73% | 88% | 90% | |
| 7 | 65% | 78% | 89% | 91% | |
|
| |||||
| ITV | 3 | 91% | 97% | 99% | 100% |
| 5 | 93% | 98% | 100% | 100% | |
| 7 | 93% | 98% | 100% | 100% | |
B. Annotated Images
In this section, we evaluated the performance of ITV against manually annotated images. In this context, samples were stained for their adherens junctions, and then imaged with a 40× magnification objective. 3 The data set consisted of 274 1344 × 1024 images, 14 of which were annotated by two cell biologists. These images were selected for annotation for their diversity and not their similarity, in order to capture important biological and technical heterogeneity. 4,5 The annotations served as representatives in human performance and as a baseline for algorithmic comparisons. Subsequently, the remainder of this section is dedicated to the evaluation of the performance of ITV, both qualitatively and quantitatively.
From a qualitative perspective, ITV generates contours with high agreement with human annotations. However, it does not properly represent nor detect junctions. Fig. 17 illustrates a sample of results, where the left and right columns respectively show the original images and human annotations that are overlaid with computed representation. The red and green contours represent the two annotations, while the white contours are the ITV results. Fig. 18 shows substandard performance of ITV at junctions. The rationale is that tensors, at the junction, do not deform in an elongated fashion.
Fig. 17.
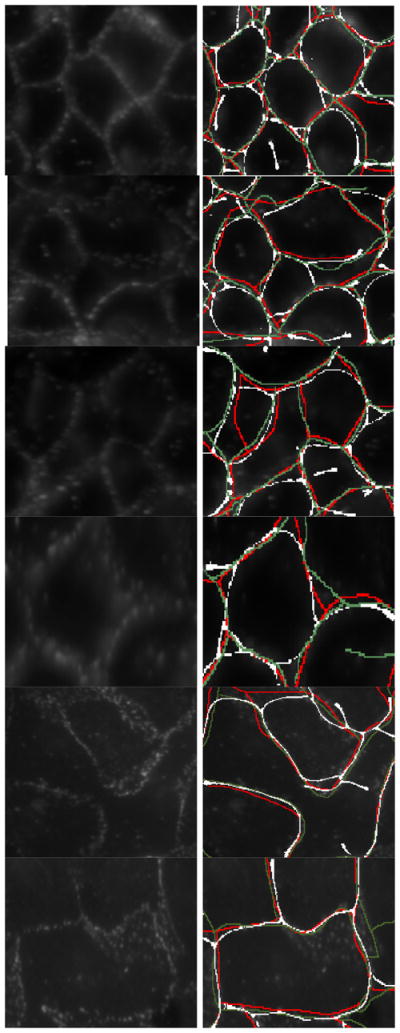
Human delineation of adherens junctions versus ITV. Left: patches of the original images. Right: delineation by ITV (white) and the specialists (red/green).
Fig. 18.
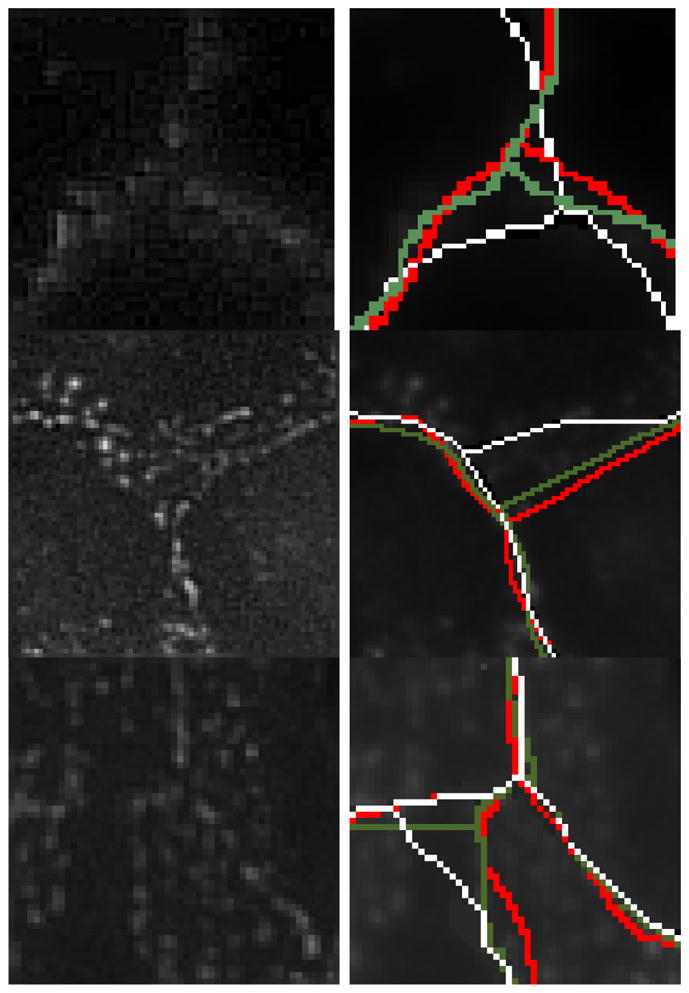
Contour junctions are the main sources for misdetection. Left: location near junctions evidenced; right: delineation by ITV (white) and the specialists (red/green).
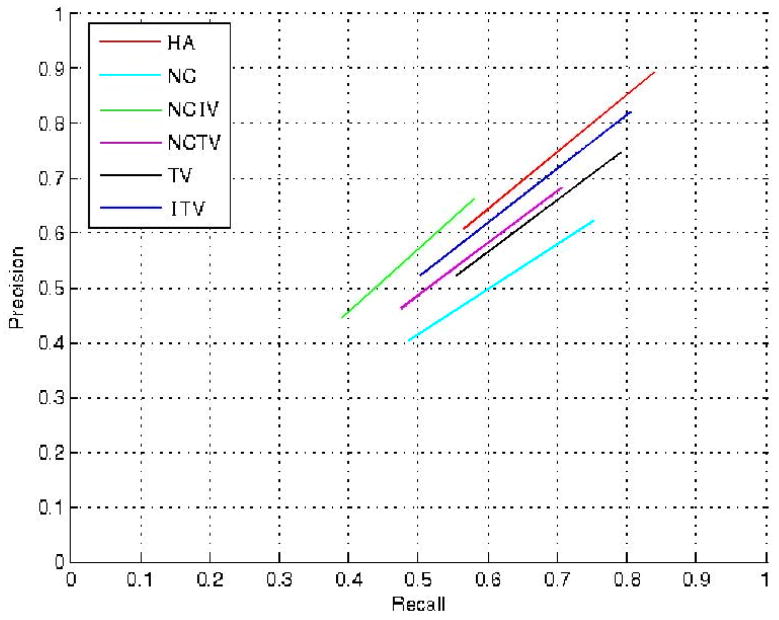
Next, a quantitative analysis is performed where precision and recall rates are computed from the (mis)matches between human annotations and automatic detected contours. In this context, precision measures the probability of a detected contour to determine a true adherens junction. Recall measures the probability of an adherens junction to be correctly detected. In order to account for digital displacement of the contours, matches were evaluated at different versions of the annotation, with each of them being dilated by a factor that varied between 1 to 20 pixels 6. Fig. 19 shows the precision and recall rates obtained from averaging matching rates between the two annotations. In this section, HA refers to the Human Annotation, the performance achieved by the specialists, which was computed by averaging reciprocal (mis)matches between the annotations. Additionally, NC indicates the performance for negative curvature maxima (i.e., negative value of the maximum principal curvature). NCIV stands for iterative voting initialized with NC, and NCTV for tensor voting initialized with NC. Lastly, TV refers to tensor voting (ball voting only).
Fig. 19.
Recall vs. precision plot of the overall performance as a function of the dilation factor. Comparison between human annotation (HA), negative curvature maxima (NC), iterative voting initialized with NC (NCIV), tensor voting initialized with NC (NCTV), tensor voting (TV), and the Iterative Tensor Voting (ITV) are shown. ITV not only performs better than the other methods but also produces a 91% rate of agreement with HA in precision and 94% in recall.
An analysis of the matching rates in Fig. 19 revealed that ITV developed the closest recall-precision curve to HA. It also showed that ITV had similar improvement rates to those produced by the specialists, presenting similar decay across the dilation factor. Furthermore, comparing the rate of agreement (RA) between the methods and HA, we can conclude that ITV had the highest agreement with the specialists, showing 91% precision and 94% recall rates of agreement (Table II). RA was obtained from averaging the sum of differences of results - precision (P) or recall (R) - from each dilated version (P (i) or R(i), where i is the dilation factor) of the annotation and the method being evaluated. Equation 4 shows how RA is computed for P. For its counterpart R, P (i) is replaced by R(i). N is the maximum dilation factor 20. A detailed analysis of these performances shows that any post-processing of NC and TV improved their results (compare, for instance, NCIV and NCTV with NC, and ITV with TV). However, one can notice that the initialization played an important role in all methods. TV had a better recall rate than NC, meaning it better resembled the human annotation. Therefore, another conclusion is that TV served as better input than NC.
TABLE II.
Rate of agreement for precision (RAP ) and recall (RAR) between the methods and the human annotation.
| RAP | RAR | |
|---|---|---|
| NC | 75% | 88% |
| NCIV | 80% | 78% |
| NCTV | 81% | 84% |
| TV | 86% | 95% |
| ITV | 91% | 94% |
| (4) |
V. Conclusions and Future Work
In this paper, we introduced the iterative tensor voting method to group ill-defined visual signals along a curvilinear structure. This method coupled the tensor and iterative voting frameworks to leverage advantages from both methods. As a result, complex patterns along a curvilinear path could be perceptually grouped and delineated. Results on inference of adherens junctions (i.e., membrane-bound macromolecules) were validated through comparison with synthetic and annotated real data by expert cell biologists. Quantitatively, the method was shown to produce (i) superior results when compared with prior techniques, and (ii) delineations comparable to annotations produced by specialists. In particular, our method achieved precision and recall rates of 91% and 94%, respectively. One limitation is that junctions (e.g., T-junctions, X-junctions) are not well characterized, which will be the subject of future efforts. An ad hoc junction detector, for example, can be feasibly added through the analysis of the ball saliency map produced by tensor voting. In addition, we plan to extend our method to confocal microscopy to infer this class of signals in 3D.
Fig. 16.
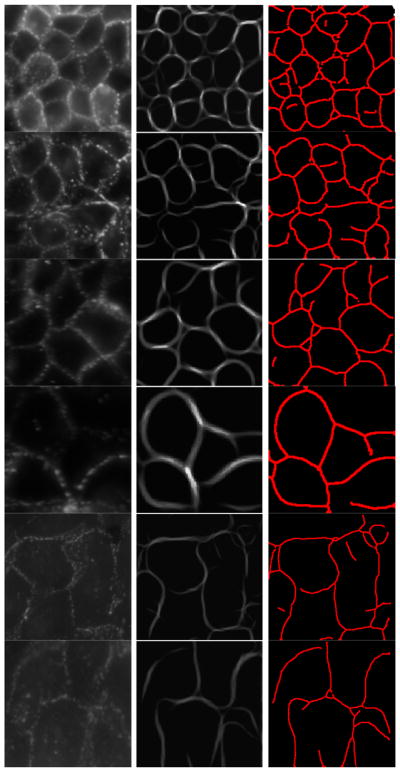
Grouping and delineation of adherens junctions by ITV. Left: original signal; center: grouped signal; right: inferred adherens junctions.
Acknowledgments
This research was supported in part by (i) the Director, Office of Science, Office of Biological and Environmental Research, the Low Dose Radiation Program of the U.S. Department of Energy, and (ii) a grant from National Cancer Institute (R01CA140663) under Contract No. DE-AC02-05CH11231.
Footnotes
Tensor voting is a patented framework.
Threshold values are computed from the maximum saliency at each iteration to remove tensors with lower saliency.
Detailed information about the experimental design and imaging protocol can be found in [38].
Statistically speaking, each image consists of over 150 cells, and every cell can be considered as an independent test tube.
The only instruction given to the biologists was to trace adherens junctions they could perceive from the image. No constraints regarding closed contours or any other higher level inference was imposed.
20 pixels served as the upper bound for being the actual average width observed for the signals analyzed.
Contributor Information
Leandro A. Loss, Email: laloss@lbl.gov, Life Sciences Division, Lawrence Berkeley National Laboratory, Berkeley, CA.
George Bebis, Email: bebis@cse.unr.edu, Department of Computer Science and Engineering, University of Nevada, Reno, NV, and the Computer Science Department, King Saud University, Riyadh, Saudi Arabia.
Bahram Parvin, Email: b_parvin@lbl.gov, Life Sciences Division, Lawrence Berkeley National Laboratory, Berkeley, CA. Department of Electrical Engineering, University of California.
References
- 1.Biederman I. Human Image Understanding: Recent Research and Theory. Academic Press; Rosenfeld: 1985. [Google Scholar]
- 2.Wertheimer M. Laws of Organization in Perceptual Forms (English title), II. Psychologische Forschung. 1923;4:301–305. [Google Scholar]
- 3.Hirogaki Y, Sohmura T, Satoh H, Takahashi J, Takada K. Complete 3-D Reconstruction of Dental Cast Shape Using Perceptual Grouping. IEEE Trans Medical Imaging. 2001;20(10):1093–1101. doi: 10.1109/42.959306. [DOI] [PubMed] [Google Scholar]
- 4.Jia J, Tang CK. Inference of Segmented Color and Texture Description by Tensor Voting. IEEE Trans Pattern Analysis and Machine Intelligence. 2004;26(6):771–786. doi: 10.1109/TPAMI.2004.10. [DOI] [PubMed] [Google Scholar]
- 5.Bonneau S, Dahan M, Cohen L. Single Quantum Dot Tracking Based on Perceptual Grouping Using Minimal Paths in a Spatiotemporal Volume. IEEE Trans Image Processing. 2005;14(9):1384–1395. doi: 10.1109/tip.2005.852794. [DOI] [PubMed] [Google Scholar]
- 6.Harit G, Chaudhury S. Video Shot Characterization Using Principles of Perceptual Prominence and Perceptual Grouping in Spatio-Temporal Domain. IEEE Trans Circuits and Systems for Video Technology. 2007;17(12):1728–1741. [Google Scholar]
- 7.Marr D. Early processing of visual information. Phil Trans of the Royal Society of London. 1975;275(942):483–519. doi: 10.1098/rstb.1976.0090. [DOI] [PubMed] [Google Scholar]
- 8.Lowe DG. Three-dimensional object recognition from single two-dimensional images. Artificial Intelligence. 1987;31:355–395. [Google Scholar]
- 9.Ullman S. Filling-in the Gaps: The Shape of subjective Contours and a Model for Their Generation. Biol Cybernetics. 1976;25 [Google Scholar]
- 10.Weickert J. Coherence-Enhancing Diffusion Filtering. Int Journal of Computer Vision. 1999;31(2):111–127. [Google Scholar]
- 11.Parent P, Zucker SW. Trace Inference, Curvature Consistency, and Curve Detection. IEEE Trans Pattern Analysis and Machine Intelligence. 1989;11(8):823–839. [Google Scholar]
- 12.Hérault L, Horaud R. Figure-Ground Discrimination: A Combinatorial Optimization Approach. IEEE Trans on Pattern Recognition and Machine Intelligence. 1993;15:899–914. [Google Scholar]
- 13.Heitger F, von der Heydt R. A Computational Model of Neural Contour Processing: Figure-Ground Segregation and Illusory Contours. Proc Int Conf in Computer Vision. 1993:32–40. [Google Scholar]
- 14.Li SX, Chang HX, Zhu CF. Fast Curvilinear Structure Extraction and Delineation Using Density Estimantion. Computer Vision and Image Understanding. 2009;113(6):763–775. [Google Scholar]
- 15.Sarkar S, Boyer K. A Computational Framework for Preattentive Perceptual Organization: Graphical Enumeration and Voting Methods. IEEE Trans on Systems, Man, and Cybernetics. 1994;24(2):246–267. [Google Scholar]
- 16.Loss L, Bebis G, Parvin B. Tunable Tensor Voting for Regularizing Punctate Patterns of Membrane-Bound Protein Signals. Proc. IEEE Int. Symposium on Biomedical Imaging; 2009. [Google Scholar]
- 17.Loss L, Bebis G, Parvin B. Tunable Tensor Voting Improves Grouping of Membrane-Bound Macromolecules. Proc IEEE Mathematical Methods in Biomedical Image Analysis. 2009 [Google Scholar]
- 18.Sarkar S, Boyer K. Quantitative Measures of Change Based on Feature Organization: Eigenvalues and Eigenvectors. Proc. IEEE Conf. on Computer Vision and Pattern Recognition; 1996. pp. 478–483. [Google Scholar]
- 19.Gerig G, Klein F. Fast Contour Identification Through Efficient Hough Transform and Simplified Interpretation Strategy. Proc. Int. J. Conf. on Pattern Recognition; 1986. pp. 498–500. [Google Scholar]
- 20.Escolar E, Weigold G, Fuisz A, Weissman N. New Imaging Techniques for Diagnosing Coronary Artery Disease. Canadian Medical Association Journal. 2006;174(4):487–495. doi: 10.1503/cmaj.050925. [DOI] [PMC free article] [PubMed] [Google Scholar]
- 21.Prigozhina NL, Zhong L, Hunter EA, Mikic I, Callaway S, Roop DR, Mancini MA, Zachariasa DA, Price JH, McDonough PM. Plasma membrane assays and three-compartment image cytometry for high content screening. Assay Drug Dev Technologies. 2007;5(1):29–48. doi: 10.1089/adt.2006.024. [DOI] [PubMed] [Google Scholar]
- 22.Diagaradjane P, Cardona J, Casasnovas N, Deorukhkar A, Shentu S, Kuno N, Schwartz D, Gelovani J, Krishnan S. Imaging Epidermal Growth Factor Receptor Expression In vivo: Pharmacokinetic and Biodistribution Characterization of a Bioconjugated Quantum Dot Nanoprobe. Clinical Cancer Research. 2008;14(3):731–741. doi: 10.1158/1078-0432.CCR-07-1958. [DOI] [PubMed] [Google Scholar]
- 23.Guy G, Medioni G. Inferring Global Perceptual Contours from Local Features. Int Journal of Computer Vision. 1996;20(1):113–133. [Google Scholar]
- 24.Medioni G, Lee MS, Tang CK. A Computational Framework for Feature Extraction and Segmentation. Els Science. 2000 [Google Scholar]
- 25.Hough PVC. Machine Analysis of Bubble Chamber Pictures. Proc. Int. Conf. on High Energy Accelerators and Instrumentation; 1959. [Google Scholar]
- 26.Parvin B, Yang Q, Han J, Chang H, Rydberg B, Barcellos-Hoff MH. Iterative Voting for Inference of Structural Saliency and Characterization of Subcellular Events. IEEE Trans on Image Processing. 2007 doi: 10.1109/tip.2007.891154. [DOI] [PubMed] [Google Scholar]
- 27.Chang H, Andarawewa KL, Han J, Barcellos-Hoff MH, Parvin B. Perceptual Grouping of Membrane Signals in Cell-based Assays. IEEE Int Symposium on Biomedical Imaging. 2007 [Google Scholar]
- 28.Medioni G, Kang SB. Emerging Topics in Computer Vision. Chapter 5. Prentice Hall; 2004. [Google Scholar]
- 29.Lim J, Park J, Medioni G. Text Segmentation in Color Images Using Tensor Voting. Image and Vision Computing. 2007;25(5):671–685. [Google Scholar]
- 30.Duda RO, Hart PE. Use of the Hough Transformation to Detect Lines and Curves in Pictures. Comm ACM. 1972;15:11–15. [Google Scholar]
- 31.Williams L, Jacobs D. Local Parallel Computation of Stochastic Completion Fields. Neural Computation. 1997;9:859–881. doi: 10.1162/neco.1997.9.4.837. [DOI] [PubMed] [Google Scholar]
- 32.Fischer S, Bayerl P, Neumann H, Redondo R, Cristobal G. Iterated tensor voting and curvature improvement. Signal Processing. 2007;87(11):2503–2515. [Google Scholar]
- 33.Loss L, Bebis G, Nicolescu M, Skurikhin A. An iterative multi-scale tensor voting scheme for perceptual grouping of natural shapes in cluttered backgrounds. Computer Vision and Image Understanding. 2009;113(1):126–149. [Google Scholar]
- 34.Tong WS, Tang CK, Mordohai P, Medioni G. First order augmentation to tensor voting for boundary inference and multiscale analysis in 3D. IEEE Trans Pattern Analysis and Machine Intelligence. 2004;26(5):594611. doi: 10.1109/TPAMI.2004.1273934. [DOI] [PubMed] [Google Scholar]
- 35.Tong WS, Tang CK. Robust Estimation of Adaptive Tensors of Curvature by Tensor Voting. IEEE Trans Pattern Analysis and Machine Intelligence. 2005;27(3) doi: 10.1109/TPAMI.2005.62. [DOI] [PubMed] [Google Scholar]
- 36.Mahamud S, Williams L, Thornber K, Xu K. Segmentation of Multiple Salient Contours from Real Images. IEEE Trans Pattern Analysis and Machine Intelligence. 2003;25(4) [Google Scholar]
- 37.Risser L, Plouraboue F, Descombes X. Gap Filling of 3-D Microvascular Networks by Tensor Voting. IEEE Trans Medical Imaging. 2008;27(5) doi: 10.1109/TMI.2007.913248. [DOI] [PubMed] [Google Scholar]
- 38.Han J, Chang H, Andarawewa K, Yaswen P, Barcellos-Hoff MH, Parvin B. Multidimensional Profiling of Cell Surface Proteins and Nuclear Markers. IEEE Trans on Computational Biology and Bioinformatics. 2010;7(1) doi: 10.1109/TCBB.2008.134. [DOI] [PubMed] [Google Scholar]


