


Abstract
Recent studies of eukaryotic DNA replication timing profiles suggest that the time-dependent rate of origin firing, I(t), has a universal shape, which ensures a reproducible replication completion time. However, measurements of I(t) are based on population averages, which may bias the shape of the I(t) because of imperfect cell synchrony and cell-to-cell variability. Here, we measure the population-averaged I(t) profile from synchronized Saccharomyces cerevisiae cells using DNA combing and we extract the single-cell I(t) profile using numerical deconvolution. The single cell I(t) and the population-averaged I(t) extracted from DNA combing and replication timing profiles are similar, indicating a genome scale invariance of the replication process, and excluding cell-to-cell variability in replication time as an explanation for the shape of I(t). The single cell I(t) correlates with fork density in wild-type cells, which is specifically loosened in late S phase in the clb5Δ mutant. A previously proposed numerical model that reproduces the wild-type I(t) profile, could also describe the clb5Δ mutant I(t) once modified to incorporate the decline in CDK activity and the looser dependency of initiation on fork density in the absence of Clb5p. Overall, these results suggest that the replication forks emanating from early fired origins facilitate origin firing in later-replicating regions.
INTRODUCTION
Eukaryotic DNA replication starts at multiple origins that are fired at different times during S phase (1). The mechanisms that control the temporal order of origin firing through S phase are not clearly understood. A topic of recent debate is whether origins fire independently of each other with variable efficiencies that define their mean activation time (2,3), or are coordinated by some mechanism that subordinates the firing of late origins to the progression of DNA synthesis in earlier replicons (4,5). Czajkowsky et al. (6) visualized by DNA combing the replication patterns of S. cerevisae chromosome VI. Contrary to what would be expected for a strictly regulated temporal program, no two molecules exhibited the same pattern and replication of different regions of the same chromosome occurred independently of each other. Nevertheless, averaging the patterns of all examined fibres recapitulated the population-averaged replication timing profiles obtained previously (7–9). These results favour a probabilistic model for replication timing control. On the other hand, McCune et al. (10) showed that in the clb5Δ mutant, which affects the origin firing activity of Cyclin-Dependent Kinase (CDK) late in S phase, the replication timing profile is only affected in the regions that replicate late in the wild-type, which replicate even later in the mutant. Because the efficiency of early origins was not affected, McCune et al. disfavoured a purely stochastic model of origin firing.
An essential kinetic parameter of S phase is the time-dependent rate of firing, I(t). Single-molecule analysis of replication intermediates in Xenopus egg extracts have shown that I(t) increases during S phase to allow the timely completion of DNA replication (11–15). Subsequent work using both DNA combing in Xenopus and analysis of whole genome replication timing profiles in a wide range of other eukaryotes confirmed that I(t) increases during S phase but also suggested that I(t) decreases before the end of S phase in a similar manner in all these organisms (16). However, I(t) was extracted from replication timing profiles by counting peaks whose height was read as the origins firing time. As these profiles are averaged over large cell populations, which masks cell-to-cell variability, the height of peaks in fact depends on both origin firing time and origin firing efficiency (17,18). Thus, counting visible peaks as origins leads to overestimate both their firing rate and firing time. On the other hand, inefficient origins fail to trace detectable peaks. If later origins are less efficient, this may lead to underestimate the rate of origin firing late in S phase. A more sophisticated mathematical analysis of a Saccharomyces cerevisiae genome-wide replication time course profile indeed suggested that the decrease in I(t) was less prominent than initially measured (3). Finally, measurements based on population averages may particularly affect the aspect of the I(t) profile at the start and the end of S phase because of imperfect cell synchrony.
Assuming that the population-averaged I(t) is a reasonable approximation of the single cell I(t), two models have been proposed to quantitatively account for the reported profiles (19,20) (reviewed in 2 and 21). Both the models require that the amount of a replication factor increases during S phase to fully explain the increasing part of the I(t) profile (a constant amount of the replication factor would also result in an increasing I(t), but the experimental profile increases even more strongly, which the authors attribute to an increase in the replication factor). They differ in their explanation of the decreasing part. Goldar et al. (20) suggest that it results from a coupling between the density of replication forks and the probability of origin firing at unfired origins. Gauthier and Bechhoefer (19) suggest that the decreasing part of I(t) can be explained if the search process between DNA and some initiation factor is subdiffusive, without explicitly tying firing rate to fork density.
Transacting factors that control replication initiation include CDK and Dbf4-dependent kinases (22). The effect of altering CDK activity during S phase in S. cerevisiae has been analysed in detail (23–26). During a normal S phase, CDK is activated by Clb5p or a second, short-lived, cyclin Clb6p, to stimulate origin firing. The absence of Clb5p delays the replication of multiple zones that together compose over half of the genome, due to decreased origin firing and elicits activation of a Rad53-dependent checkpoint response that stabilizes replication forks (10,27). Strikingly, the delayed replication zones in the clb5Δ mutant coincide with delayed replication zones seen during replication stress in a mutant lacking the Isw2 and Ino80 chromatin remodelling complexes, which are normally enriched at replication sites (28). These results suggest that chromatin remodelling activities located at replication forks specifically promote fork progression and/or origin firing in those late-replicating regions.
In this work, we deliberately compare in a wild-type S. cerevisiae strain the I(t) obtained from combing data, where errors due to variable origin efficiency do not exist, with an I(t) derived from replication timing profiles as in previous works. We then extract from the combing data the average single-cell I(t) profile. We show that the three profiles are very similar and that the firing rate correlates with the fork density in wild-type cells. This dependency is specifically loosened in late S phase in the clb5Δ mutant. The model previously proposed by Goldar et al. (20), which accounts for the wild-type I(t) profile, could also describe the clb5Δ mutant I(t) profile once the decline in CDK activity and the looser dependency of origin firing on fork density in the absence of Clb5p were incorporated into the model. Overall, these results suggest that replication forks emanating from early-activated origins facilitate origin firing in later-replicating regions.
MATERIALS AND METHODS
The strain
The strain used in this study, MCM869 (MATa ade2−1 trp1−1 can1−100 leu2−3, his3−11,15 URA3::GPD−TK7x AuR1c::ADH−hENT1 bar1Δ::LEU2 cdc21Δ::kanMX), is a derivative of the E1000 strain (29) in which the CDC21 gene (encoding thymidylate synthase) was disrupted to increase BrdU incorporation (30). During growth, MCM869 is maintained in medium containing 100 μM thymidine. Unless indicated otherwise, cells were grown at 30°C in synthetic minimal media (31) supplemented with adenine and casamino acids (2%).
Cell cycle analysis
Approximately, 2 × 10⁹ cells were arrested in G1 phase by incubation for 4 h in the presence of 1 μM α-factor and 100 μM thymidine (Sigma), centrifuged and washed twice with fresh medium, transferred to fresh medium containing 1 μM α-factor and 100 μMBrdU for 30 min, released into S phase by washing out the α-factor by centrifugation and transferring in fresh medium containing 100 μM Brdu and 30 μg/ml nocodazole (Sigma). Samples (2 × 10⁸ cells) were collected every 15 min over a 150-min period, at which time the cells reached the G2/M phase. An aliquot (2 × 10⁴ cells) of each timed sample was removed to monitor S phase progression by flow cytometry according to Epstein and Cross (23) and the rest was centrifuged and washed twice and resuspended in fresh medium containing 30 μg/ml nocodazole and 100 μM thymidine at 30°C until the G2/M phase. Each sample was divided in two parts, one (15 × 107 cells) was analysed by DNA combing and the other (5 × 10⁷ cells) was used to quantify BrdU incorporation.
Quantitation of BrdU incorporation
Genomic DNA was prepared as described by Sambrook and Russell (32). For each time point, equal amounts of genomic DNA (100 ng) were denatured in 0.4 M NaOH (Sigma-Aldrich), spotted onto a nitrocellulose membrane (GE Healthcare) and UV-cross linked. Immunodetection was performed using a monoclonal anti-BrdU antibody (Becton-Dickinson) and a secondary IgG coupled to horseradish peroxidase (Ebioscience). Signals were detected by electrochemiluminescence and quantified with ImageJ software. Serial dilutions of BrdU-labelled DNA were systematically performed to check the linearity of the signal. The copy number of DNA y was deduced from the fraction of incorporated BrdU, xBrdU (normalized by the maximal amount of incorporated BrdU) as y = 1 + xBrdU. The fraction of replicated DNA fDNA represents the amount of replicated DNA divided by the total amount of DNA present initially. The fraction of incorporated BrdU, xBrdU, corresponds to the amount of BrdU incorporated in to the double stranded DNA divided by the total amount of DNA. Assuming that the length of the DNA is L, then the total amount of DNA is equal to L + L × fDNA. So xBrdU = 2 × fDNA/(1 + fDNA) and therefore, fDNA = xBrdU/(2 − xBrdU).
DNA combing
Silanized glass coverslips were prepared as described (33) and used to comb BrdU-labelled DNA from the 60, 90 and 105 min time points as described (34). Total and BrdU-labelled DNA was detected with fluorescent antibodies as described (34). Total DNA was stained in red using an anti-DNA antibody (Abcys) and a secondary IgG coupled to Alexafluor 532 (Invitrogen). BrdU tracks were stained in green using a monoclonal anti-BrdU antibody (Becton-Dickinson) and two secondary IgGs coupled with Alexafluor 488 (Invitrogen). Labelled fibres were imaged using a Leica epifluorescence microscope equipped with a ×100 objective and a charge-coupled device camera. The fluorescence signals were analysed using a Matlab-(Mathworks) based homemade software. Green tracks ≤6 kb were counted as recently fired origins (tracks ≤0.5 kb were excluded to avoid false positives due to background fluorescence). To construct the I(t) profile, it would seem straightforward to use the BrdU chase time. Unfortunately, there is a broad dispersion of S phase starting time in the cell population, as shown by the flow cytometry data, so it is impossible to assign to each fibre the exact time at which the cell it comes from, started replicating. On the other hand, the local time at which each fibre started replicating can be inferred relatively precisely using fDNA(t). Therefore, the combed DNA fibres were sorted according to replication extent fDNA. For each fibre, eyes 0.5–6.0 kb long (detectable initiation events that occurred over a 2-min interval, assuming that the speed of replication fork is 1.46 kb min−1 (35)) were counted and the number was divided by 2 min and by the length of unreplicated DNA, to derive the frequency of origin firing as a function of fDNA. The I(fDNA) data points were converted to I(t) using the fDNA(t) curve determined from kinetic measurements of replicating cells. This strategy implicitly assumes that the I(t) is spatially homogeneous and was posteriorly confirmed by the collapse of the local and global I(t) profiles. The fork density was obtained by counting the number of forks and dividing by the length of each combed DNA fibre. The complete characterization of all fibres analysed in this study is described in Supplementary Section 5.
Quantitative flow cytometry analysis
To extract the rate of cell DNA synthesis from the distribution of DNA content over the population we used the mathematical framework developed by Bertuzzi et al. (36). This analysis is based on two hypotheses: the uniform law of cell–DNA synthesis over the population and the absence of cell losses. The validity of the first assumption is further discussed in Supplementary Section 5. Adapting equation (14) of Bertuzzi et al. (36) to our study, we obtain for the fluorescence density normalized to unit area,  (ζ,t) at a time t:
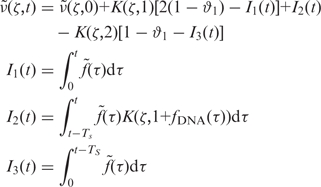 |
(1) |
where ζ is the position of the detection channel normalized by the position of the G1 peak, θ1 is the fraction of cells in G1 and the function K(ζ,1+fDNA(τ)) is the kernel function (37) representing the dispersion of propidium iodide (PI) fluorescence over the detection channels. We then extracted the fraction of cells in S phase, n(t), as follows. We first determined the population-averaged kinetics of DNA replication, fDNA(t) and the total rate of DNA synthesis,  . We then extracted from the flow cytometry profiles the S phase influx function,
  .
.  is continuous and differentiable at each of its points and therefore can be considered as a sum of continuous and differentiable functions,
  . Therefore,
  can be extracted by fitting all six flow cytometry profiles simultaneously using equation (1) and a simplex algorithm. The time-dependent distribution of cellular DNA content, n(x,t), was then calculated as
 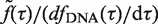 (Figure 2C). Finally, the probability for a cell to be in S phase is calculated as
 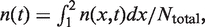 where Ntotal represents the total number of cells.
Figure 2.

Analysis of S phase parameters in the same cell population as in Figure 1. (A) Fraction of replicated DNA, fDNA(t), as a function of time. Data points were extracted by measuring the amount of incorporated BrdU as described in ‘Materials and Methods’ section (open circle). The origin of time axis was set to the starting time of the S phase, tstart, which is 30 min after G1 release (time = t−tstart). To show that fDNA(t) follows a sigmoidal shape (8), it was fitted to a Boltzmann sigmoidal function (solid black line, χ2 = 1.003 and P < 10−4). (B) Total rate of DNA synthesis as a function of average DNA content. (C) Time-dependent distribution of DNA content (time = t−tstart). Inset: variation of the distributions width as a function of time (time = t−tstart). (D) Probability, n(t), for a cell to be in S phase as a function of time (time = t−tstart) calculated as described in ‘Material and Methods’ section. The black dashed line is a guide for the eye.
Analysis of published microarray data
The time-dependent rate of origin firing I(t) in the budding yeast S. cerevisiae was constructed using the genome-wide replication profiles determined by Raghuraman et al. (7), Yabuki et al. (8) and McCune et al. (10), where the mean replication time of each studied locus is plotted against chromosomal position so that efficient origins appear as peaks. The replication profile of each chromosome was cut into 1-min slices of time. I(t) was calculated for each time point as the ratio between the number of fired origins and the amount of unreplicated DNA. The number of active replication forks at time t was detected as the intercept between the replication profile curve and a y = t horizontal line. The replication fork density was calculated as the ratio between this number and the genome length. The length of S phase of our combing experiments (synchronization using α-factor, S phase at 30°C; TS = 42 ± 15 min) was comparable with that measured by Raghuraman et al. (43 min) and McCune et al. (45 min; in both the studies double synchronization by α-factor and cdc7 mutant was used, S phase at 30°C) but longer than that measured by Yabuki et al. (8) (synchronization using α-factor, S phase at 26°C; 30 min). When the firing time for known ARSs (from OriDB database (38)) measured by Raghuraman et al. was plotted against the firing time measured by Yabuki et al., a linear relation was observed [tyabuki = 13.26 (±0.68) + 0.43(±0.03) tRaghuraman, P < 10−4]. Therefore, we used the S phase duration of Raghuraman et al. as our reference point and corrected the timing measured by Yabuki et al. by the obtained linear relation.
RESULTS
To study the dynamics of origin firing, G1-arrested cells were synchronously released into S phase in the presence of BrdU at t = 0. Every 15 min over a 150 min period, three samples were harvested from the solution. The first sample was analysed by flow cytometry, the second sample was used to measure the amount BrdU incorporated into the genomic DNA and the third sample was analysed by DNA combing (Figure 1A).
Figure 1.

Experimental workflow and flow cytometry analysis of DNA content following α-factor release. (A) Cells were synchronized in G1 with α-factor and synchronously released into S phase by washing out the α-factor and transferring in fresh medium containing BrdU and nocodazole. Samples were collected every 15 min over a 150-min period, at which time the cells reached the G2/M phase. An aliquot of each timed sample was used to monitor S phase progression by flow cytometry fluorescence-activated cell sorter. The remaining part of the timed sample was transferred to fresh medium containing nocodazole and thymidine at 30°C up to 150 min. Each sample was divided in two parts, one was analysed by DNA combing and the other part was used to quantify BrdU incorporation. (B) Experimental data (open symbols) are fitted to equation (1) using a simplex algorithm (solid line, χ2 = 1.03 and P < 10−4). (C) Linear correlation coefficient between two consecutive flow cytometry profiles. The linear correlation coefficient, R, was calculated between profiles measured at time n−1 and time n. The time n was assigned to the obtained value of R. The flow cytometry profile at time n = 0 was compared with itself and therefore R = 1. The starting time (tstart = 30 min) and the length of S phase (TS = 42 ± 15 min) were measured by interpolating the obtained profile to a Gaussian function.
S phase parameters following G1 block-and-release of S. cerevisiae cells
The progression through S phase of S. cerevisiae cells released from α-factor-mediated G1 arrest was monitored by flow cytometry (Figure 1B). The relative amount of DNA, x, was set to x = 1 in G1 cells. A broad peak of fluorescence intensity was observed at all time points because of imperfect synchrony and because the PI fluorescence follows a Gaussian dispersion whose standard deviation varies with DNA concentration as  , where C is a constant (C = 0.24 ± 1.3 × 10⁻³) (39). As the α-factor was washed out, the cells entered S phase and the DNA content increased to reach x = 2 (G2/M phase). To measure the starting and ending times of S phase, we compared the variation in the shape of two consecutive flow cytometry profiles by calculating their linear correlation coefficient (R) and the associated P value (Figure 1C). A coefficient of 1 corresponds to two identical curves. The more two curves differ, the lower their correlation coefficient. We observed (Figure 1C) that R started to decrease between 15 and 30 min (R = 0.93, P < 10−10), dropped sharply between 30 and 45 min (R = 0.4, P = 0.03) and reverted to R = 0.99 between 60 and 75 min (P < 10−10). Therefore, cells progressed through S phase between 30 and 75 min after α-factor release. The number of G1 cells decreases sharply between 30 and 45 min (Figure 1B), suggesting that the rate of S phase entry was maximum over this period. To measure the length of S phase, the correlation coefficient changes was interpolated by a Gaussian function (we used a Gaussian function because of the U shape of the curve and for sake of simplicity). As flow cytometry profiles were taken every 15 min, the maximum uncertainty of the S phase duration in our experiment is about 15 min. We estimated the mean length of S phase to 42 ± 15 min.
Using the measured fDNA(t) (Figure 2A), we calculated the rate of total DNA synthesis, as a function of DNA content (Figure 2B) by differentiating fDNA(t) as a function of time. Then, using the method as described in ‘Materials and Method’ section, we extracted the time dependent distribution of cellular DNA content, n(x,t), and the fraction of cells in S phase, n(t). The dispersion in DNA content was initially narrow but increased as S-phase progressed then decreased after 35 min (Figure 2C, inset). The fraction of cells in S phase at time t, n(t), corresponded to the ratio between the integral of n(x,t) over x and the total number of cells. The resulting n(t) profile is shown on Figure 2D. Note that the start time of S phase (t = 0 in Figure 2) was set at 30 min after G1 release.
The consistency of our analysis was further checked by showing that we can reproduce the flow cytometry profile of an exponentially growing cell population using the fDNA(t) measured by BrdU incorporation (Supplementary Section 1).
DNA combing and microarray-based I(t) profiles are similar
We used DNA combing (Figure 3) to measure the time-dependent, genome-averaged rate of replication origin firing, I(t), and density of replication forks, Nf(t). The normalized rate of firing,  , and the normalized fork density,
  , were calculated as described in the Materials and Methods section and compared with those extracted from published genome-wide replication timing profiles (7,8,10), as described previously (16). Although the yeast strains and experimental growth conditions differed between experiments, all the extracted
  and
and  profiles collapsed together without temporal rescaling (Figure 4A and B), except for the data collected by Yabuki et al. (8), where the growth temperature differs from the one used in other studies. As observed previously (16), all the profiles increased during the first two-thirds of S phase and decreased before the end of S phase.
Figure 3.

Examples of combed DNA fibres from the same cell population as in Figures 1 and 2. BrdU incorporation is revealed in green and total DNA in red. Replication extent is 7% (Early, time after G1 release = 60 min), 51% (Mid, time = 90 min) and 98% (Late, time = 105 min).
Figure 4.

Saccharomyces cerevisiae temporal profile of normalized rate of origin firing and normalized fork density. I(t) and Nf(t) were normalized by their respective maximal values. (A) Saccharomyces cerevisiae temporal profile of normalized rate of origin firing from different experimental data sets [inverted triangle, DNA combing data from this work; open circle, microarray data from Yabuki et al. (8); open triangle, microarray data from McCune et al. (10); open square, microarray data from Raghuraman et al. (7)]. (B) Saccharomyces cerevisiae temporal profile of normalized replication fork density. The symbols are the same as in panel (A). (C) open circle, Population-averaged normalized rate of origin activation extracted from DNA combing; filled circle, single-cell normalized rate of origin firing obtained by Wiener Fourier deconvolution as described in the text. The solid red line is the 5 points smoothed curve. (D) open circle, Population-averaged normalized fork density extracted from DNA combing; filled circle, single-cell normalized fork density obtained by Wiener Fourier deconvolution as described in the text. The solid red line is the five points smoothed curve. In all panels, the origin of time axis was set to the starting time of the S phase (time = t−tstart).
In the DNA combing experiments, the rate of origin firing was computed fibre by fibre, then mapped on time according to the fDNA(t) profile shown on Figure 2A (see ‘Materials and Methods’ section for details). Therefore, the time origin in the plot of these data (Figure 4A and B, blue triangles) is the local time at which each fibre started replicating. In contrast, in the case of microarray (7,8,10) experiments, the rate of origin firing was computed globally over the entire genome and mapped to the time in S phase reported in these experiments. The fact that the combing and microarray measurements of I(t) are in such a good agreement strongly suggests that the replication process is spatially homogeneous above the mean size of combed fibres (164 ± 5 kb). In other words, the rate of firing over a domain larger than this characteristic length predominantly depends on its extent of replication rather than on its absolute starting time.
The consistency of our data was further checked by showing that using a formula that links the rate of origin firing to the fraction of replicated DNA (40), we can reproduce the fDNA(t) curve measured by BrdU incorporation from the I(t) we extracted from microarray or combing data (Supplementary Section 2).
Deconvoluting a single-cell I(t) profile from population data
An important issue in interpreting the population-averaged curves shown in Figure 4A and B is that all cells do not enter and exit S phase at the same time (Figure 2D). This could blur the temporal profile of origin firing. However, as the replication process is spatially homogeneous, the observed rate of origin firing at time t, is the result of origin firing in all cells that are in the S phase for a time τ < t. In other words 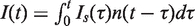 , where Is(t) represents the rate of origin firing in a single cell (assumed to be identical among cells) and n (t−τ) is the fraction of cells in S phase for a time τ (τ < t). As the kinetic of BrdU uptake by the cell is consistent with the flow cytometry profile of an exponentially growing cell population (Supplementary data), the extracted n(t) can be used to remove the contribution of temporal dispersion from the combing data using Wiener Fourier deconvolution method.
The raw data and the resulting single-cell  and
and  profiles are shown on Figure 4C and D, respectively. The raw data and deconvoluted profiles are in very good agreement. The deconvoluted profiles decrease at the end of S phase, although less markedly than in the raw data. Therefore, although the apparent drop in origin firing at the end of S phase is somewhat enhanced by the asynchrony of the cell population, it is still observed at the single-cell level.
The shape similarity of the I(t) and Nf(t) profiles, which both peak at 30 min in S phase, demonstrate a correlation between fork density and rate of origin firing. This is further exemplified by plotting the normalized rate of origin firing against the normalized replication fork density for the DNA combing experiment (Figure 5A). Removing temporal dispersion as described above strikingly improved the observed correlation (Figure 5B).
Figure 5.

Normalized rate of origin firing versus normalized fork density extracted from DNA combing data in cell populations (A) and in single cells (B). The open black squares (open square) and the open grey circles (open circle) represent the increasing and decreasing part of I(t), respectively. The solid black and dashed grey lines are the spline smoothed curves in panel A, and the five points smoothed curves in panel (B).
Modelling I(t) profiles in wild-type and clb5Δ mutant strains
To push this analysis further, we extracted and compared the rate of origin firing and fork density profiles for the wild-type strain and the clb5Δ mutant studied by McCune et al. (10) (Figure 6A and B). The rate of origin firing and the fork density in the clb5Δ mutant increased and decreased more slowly than in the wild-type and their maxima were 40% lower. Interestingly, the deletion of CLB5 drastically reduced the proportionality between rate of origin firing and fork density during late S phase but not during early S phase (Figure 6C). The crossover between the two regimes occurred when I(t) reached its maximal value. We previously demonstrated that a minimal model of stochastic origin firing could quantitatively describe the time-dependent changes in rate of origin firing and fork density observed in a wide range of eukaryotes including the yeast S. cerevisiae (16). In this model, origin firing is governed by the encounter of a recyclable replication-fork factor with a potential origin to produce an firing event with probability P(t). The amount of this factor increases during S phase at rate J and the probability P(t) increases with fork density according to a self-limiting law  , where Nfork is the time-dependent number of forks and Nc the maximum number of forks. A simulated normalized rate of origin firing (average of 1000 simulations) with J = 5 factors per calculation round and
  is shown on Figure 6D, grey dashed line. The obtained I(t) profile is similar to the experimental profile for the wild-type strain (Figure 6A, grey dashed line). We then explored how this model needs to be modified to account for the experimental I(t) profile of the clb5Δ mutant. This mutant shows a longer S phase associated with the following changes in I(t) profile: (i) the ascending part stops before reaching the maximum value of the wild-type; (ii) the peak is replaced by a plateau; (iii) the correlation between origin firing and fork density is abolished once the plateau is reached (Figure 6A and C). Therefore, we modified the model by allowing the rate J and the dependence of the firing probability P(t) on the fork density to decay exponentially:
  and
and 
 , where tsimu is the number of calculation rounds (Figure 6D). The obtained profile strikingly reproduced the observed behaviour of the rate of origin firing in the clb5Δ mutant. Importantly, the I(t) profile of the clb5Δ mutant could solely be reproduced if both J and P1 were forced to decay. Therefore, although our model is much simpler than the complexity of the underlying biochemical circuitry that controls origin firing, it can account for the behaviour of both the wild-type and clb5Δ strains. It is possible that errors on detection of replication origins and their firing time might differently affect the wild-type and clb5Δ I(t) profiles. Nevertheless, we believe that such errors are not ample enough to significantly affect our conclusions.
Figure 6.

Modelling wild-type (dashed grey) and clb5Δ (solid black) rate of origin firing and fork density. (A and B) Normalized rate of origin firing (A) and fork density (B) from wild-type (open circle) and clb5Δ (open square) strains, extracted from McCune et al. (10). All data sets were normalized to the maximal value obtained for the wild-type strain. (C) Plot of the normalized rate of origin firing versus normalized fork density in the wild-type and clb5Δ strains. The increasing and decreasing parts of I(t) are indicated by arrows. (D) Simulated normalized rate of origin activation as a function of time. The dashed grey line represents the unmodified model (wild-type [WT]) and the solid black line the modified model (clb5Δ).
DISCUSSION
It has been debated whether eukaryotic DNA replication origins fire independently of each other or whether the firing of late origins is tied to the progression of earlier assembled forks. Two important kinetic parameters of S phase that are relevant to this question are the genome-averaged, time-dependent rate of origin firing, I(t) and replication fork density, Nf(t). Recent studies suggest that I(t) has a universal shape among eukaryotes. A model that explicitly ties I(t) to Nf(t) has been proposed to explain this shape. However, some measurements of I(t) and Nf(t) were based on population averages, which may introduce errors due to imperfect cell synchrony and cell-to-cell variability. Here, we have computed population-averaged I(t) and Nf(t) profiles from microarray data and from DNA combing data, and we have extracted single-cell Is(t) and Nsf(t) profiles, by deconvoluting from the combing data the fraction of cells n(t) in S phase at time t in the same cell population. We find that all three I(t) profiles and all three Nf(t) profiles are in good agreement.
The similarity of the profiles computed from the combing or from the microarray data indicates that errors specifically associated with interpretation of each dataset are unlikely to strongly affect the shape of these profiles.
The combing I(t) and Nf(t) profiles were obtained by computing the firing rate I(fDNA) and fork density Nf(fDNA) as a function of replication fraction fDNA and by converting to time using the fDNA(t) curve determined by analysis of BrdU incorporation in the same cell population. This strategy implicitly assumes that I(t) and Nf(t) are spatially homogeneous. As combing is done on short DNA fragments (165 kb on average) and is consistent with genome-averaged results obtained from microarray data, we conclude that it is unlikely that I(t) and Nf(t) widely vary over the genome, and that the spatial homogeneity assumption is valid. This does not argue against the existence of domains of the genome that are preferentially replicated early or late during the S phase (10). However, our results suggest that in a general manner the rate of origin firing and the density of forks in a particular locus of the genome strongly depends on the local degree of replication of this locus.
By deconvoluting n(t) from I(t) and Nf(t) the population distribution contribution is removed from the profiles. The similarity of the raw and deconvoluted profiles argues that they are an intrinsic property of the DNA replication process and are only mildly affected by the imperfect synchrony and cell-to-cell variability of the cell population. The deconvoluted profiles do decrease at the end of S phase, although less markedly than in the raw data. This indicates that population averaging exaggerates, but does not artefactually create, the drop in I(t) and Nf(t) at the end of S phase.
We demonstrated a linear correlation between I(t) and Nf(t). Although it is trivial to have I(t) ~Nf(t) at the beginning of S phase, as each initiation creates two forks, it is not trivial to have such a correlation at the end of S phase, because termination reduces Nf(t) and a priori does not affect initiation. In principle, it is possible that both Nf(t) and I(t) are controlled by a third function. But as Nf(t) can only be affected by initiation and termination, this third function would have to regulate termination by acting on fork velocity, which is difficult to reconcile with the reported uniformity of fork progression through the genome (35). Therefore, we propose that Nf(t) controls I(t).
This proposal is based on late S-phase DNA combing data. A potential concern with DNA combing is that an origin that fired close to a fork will generate a small eye that can quickly merge with the neighbouring eye and escape detection. This bias will increase through S phase as there are more and more eyes to merge with. To address this concern, we ran a set of simulations that show that the linear relation between I(t) and Nf(t) is independent of the resolution with which we can detect replication eyes and is only observed when Nf(t) controls I(t) (Supplementary Section 3).
Interestingly, the linear correlation between Nf(t) and I(t) is drastically reduced in late S phase, but not in early S phase, in the clb5Δ mutant. The correlation is lost once I(t) reaches its maximal value. While in the wild-type I(t) reaches a maximum, in the mutant I(t) reaches a plateau, at 60% of the wild-type maximum, that reflects a limitation of initiation over a longer period of time. It has already been reported (27) that in the clb5Δ mutant late origins fire less efficiently, thus, inducing the lengthening of S phase.
We previously proposed a minimal model of stochastic origin firing that could quantitatively describe the Nf(t) and I(t) profiles observed in a wide range of eukaryotes. In this model, I(t) is governed by the encounter of a recyclable replication-fork factor with a potential origin to produce an firing event with probability P(t). The amount of this factor increases during S phase at rate J and the probability P(t) increases with Nf(t) in a self-limiting manner. We found that the difference in wild-type and clb5Δ mutant Nf(t) and I(t) profiles can be reproduced if both J and the coupling factor P1 between Nf(t) and P(t) decrease exponentially as the simulation progresses.
The need to make J decay is straightforward to interpret. During a normal S phase, CDK activated by Clb5p or by Clb6p stimulates origin firing. The amount of Clb5p protein is stable during S phase but Clb6p is gradually degraded at the beginning of S phase (24,25) so that in the absence of Clb5p the S phase is lengthened due to a decay in CDK activity. CDK activity is required to promote the assembly of replication forks from multiple protein factors including some that are limiting for origin firing.
The need to make P1 decay exponentially is justified by the looser dependency of I(t) on Nf(t) in the clb5Δ mutant (Figure 6C). Interestingly, late replicating regions that are affected in the clb5Δ mutant are affected as well in mutants deficient in the chromatin remodelling factors Isw2 and Ino80, which are enriched in replicating regions in a similar manner to Pol α (28). Therefore, we speculate that fork-associated chromatin remodellers may be specifically required to promote origin firing. In other words, fork-stimulated origin firing would become predominant in late-replicating regions and would be inefficient in the clb5Δ mutant due to the decreased affinity of limiting initiation factors for potential origins in the presence of lower CDK activity. Therefore, our results suggest that any modifications in chromatin state (structure or chemical state) would influence the dynamics of DNA replication and particularly the position and firing time of replication origins. This hypothesis is consistent with a direct link between epigenetic modification of chromatin and replication timing.
SUPPLEMENTARY DATA
Supplementary Data are available at NAR Online: Supplementary Data, Supplementary Figures 1–4, Supplementary References (7,8,10,20,29,35,40–43).
FUNDING
Commissariat à l’Énergie Atomique (CEA); ARC (OH lab); the Ligue and the FRM. Funding for open access charge: Commissariat à l’Énergie Atomique (CEA).
Conflict of interest statement. None declared.
Supplementary Material
ACKNOWLEDGEMENTS
Authors would like to thank Marie-Claude Marsolier-Kergoat for useful discussions and critical readings of this article.
REFERENCES
- 1.Huberman JA, Riggs AD. On the mechanism of DNA replication in mammalian chromosomes. J. Mol. Biol. 1968;32:327–341. doi: 10.1016/0022-2836(68)90013-2. [DOI] [PubMed] [Google Scholar]
- 2.Rhind N, Yang SC-H, Bechhoefer J. Reconciling stochastic origin firing with defined replication timing. Chromosome Res. 2010;18:35–43. doi: 10.1007/s10577-009-9093-3. [DOI] [PMC free article] [PubMed] [Google Scholar]
- 3.Yang SC-H, Rhind N, Bechhoefer J. Modeling genome-wide replication kinetics reveals a mechanism for regulation of replication timing. Mol. Syst. Biol. 2010;6:404. doi: 10.1038/msb.2010.61. [DOI] [PMC free article] [PubMed] [Google Scholar]
- 4.Maya-Mendoza A, Olivares-Chauvet P, Shaw A, Jackson DA. S phase progression in human cells is dictated by the genetic continuity of DNA foci. PLoS Genet. 2010;6:e1000900. doi: 10.1371/journal.pgen.1000900. [DOI] [PMC free article] [PubMed] [Google Scholar]
- 5.Chagin VO, Stear JH, Cardoso MC. Organization of DNA replication. Cold Spring Harb. Perspect. Biol. 2010;2:a000737. doi: 10.1101/cshperspect.a000737. [DOI] [PMC free article] [PubMed] [Google Scholar]
- 6.Czajkowsky DM, Liu J, Hamlin JL, Shao Z. DNA combing reveals intrinsic temporal disorder in the replication of yeast chromosome VI. J. Mol. Biol. 2008;375:12–19. doi: 10.1016/j.jmb.2007.10.046. [DOI] [PMC free article] [PubMed] [Google Scholar]
- 7.Raghuraman MK, Winzeler EA, Collingwood D, Hunt S, Wodicka L, Conway A, Lockhart DJ, Davis RW, Brewer BJ, Fangman WL. Replication dynamics of the yeast genome. Science. 2001;294:115–121. doi: 10.1126/science.294.5540.115. [DOI] [PubMed] [Google Scholar]
- 8.Yabuki N, Terashima H, Kitada K. Mapping of early firing origins on a replication profile of budding yeast. Genes Cells. 2002;7:781–789. doi: 10.1046/j.1365-2443.2002.00559.x. [DOI] [PubMed] [Google Scholar]
- 9.Alvino GM, Collingwood D, Murphy JM, Delrow J, Brewer BJ, Raghuraman MK. Replication in hydroxyurea: it's a matter of time. Mol. Cell. Bio. 2007;27:6396–6406. doi: 10.1128/MCB.00719-07. [DOI] [PMC free article] [PubMed] [Google Scholar]
- 10.McCune HJ, Danielson LS, Alvino GM, Collingwood D, Delrow JJ, Fangman WL, Brewer BJ, Raghuraman MK. The temporal program of chromosome replication: genomewide replication in clb5Δ Saccharomyces cerevisiae. Genetics. 2008;180:1833–1847. doi: 10.1534/genetics.108.094359. [DOI] [PMC free article] [PubMed] [Google Scholar]
- 11.Yang SC-H, Bechhoefer J. How Xenopus laevis embryos replicate reliably: investigating the random-completion problem. Phys. Rev. E Stat. Nonlin. Soft Matter Phys. 2008;78(4 Pt 1):041917. doi: 10.1103/PhysRevE.78.041917. [DOI] [PubMed] [Google Scholar]
- 12.Herrick J, Stanislawski P, Hyrien O, Bensimon A. Replication fork density increases during DNA synthesis in X. laevis egg extracts. J. Mol. Biol. 2000;300:1133–1142. doi: 10.1006/jmbi.2000.3930. [DOI] [PubMed] [Google Scholar]
- 13.Hyrien O, Marheineke K, Goldar A. Paradoxes of eukaryotic DNA replication: MCM proteins and the random completion problem. Bioessays. 2003;25:116–125. doi: 10.1002/bies.10208. [DOI] [PubMed] [Google Scholar]
- 14.Lucas I, Chevrier-Miller M, Sogo JM, Hyrien O. Mechanisms ensuring rapid and complete DNA replication despite random initiation in Xenopus early embryos. J. Mol. Biol. 2000;296:769–786. doi: 10.1006/jmbi.2000.3500. [DOI] [PubMed] [Google Scholar]
- 15.Marheineke K, Hyrien O. Aphidicolin triggers a block to replication origin firing in Xenopus egg extracts. J. Biol. Chem. 2001;276:17092–17100. doi: 10.1074/jbc.M100271200. [DOI] [PubMed] [Google Scholar]
- 16.Goldar A, Marsolier-Kergoat M-C, Hyrien O. Universal temporal profile of replication origin activation in eukaryotes. PLoS One. 2009;4:e5899. doi: 10.1371/journal.pone.0005899. [DOI] [PMC free article] [PubMed] [Google Scholar]
- 17.de Moura APS, Retkute R, Hawkins M, Nieduszynski CA. Mathematical modelling of whole chromosome replication. Nucleic Acids Res. 2010;38:5623–5633. doi: 10.1093/nar/gkq343. [DOI] [PMC free article] [PubMed] [Google Scholar]
- 18.Retkute R, Nieduszynski CA, de Moura A. Dynamics of DNA replication in yeast. Phys. Rev. Lett. 2011;107:068103. doi: 10.1103/PhysRevLett.107.068103. [DOI] [PMC free article] [PubMed] [Google Scholar]
- 19.Gauthier MG, Bechhoefer J. Control of DNA replication by anomalous reaction-diffusion kinetics. Phys. Rev. Lett. 2009;102:158104. doi: 10.1103/PhysRevLett.102.158104. [DOI] [PubMed] [Google Scholar]
- 20.Goldar A, Labit H, Marheineke K, Hyrien O. A dynamic stochastic model for DNA replication initiation in early embryos. PLoS One. 2008;3:e2919. doi: 10.1371/journal.pone.0002919. [DOI] [PMC free article] [PubMed] [Google Scholar]
- 21.Hyrien O, Goldar A. Mathematical modelling of eukaryotic DNA replication. Chromosome Res. 2010;18:147–161. doi: 10.1007/s10577-009-9092-4. [DOI] [PubMed] [Google Scholar]
- 22.Labib K. How do Cdc7 and cyclin-dependent kinases trigger the initiation of chromosome replication in eukaryotic cells? Genes Dev. 2010;24:1208–1219. doi: 10.1101/gad.1933010. [DOI] [PMC free article] [PubMed] [Google Scholar]
- 23.Epstein CB, Cross FR. CLB5: a novel B cyclin from budding yeast with a role in S phase. Genes Dev. 1992;6:1695–1706. doi: 10.1101/gad.6.9.1695. [DOI] [PubMed] [Google Scholar]
- 24.Jackson LP, Reed SI, Haase SB. Distinct mechanisms control the stability of the related S-phase cyclins Clb5 and Clb6. Mol. Cell. Biol. 2006;26:2456–2466. doi: 10.1128/MCB.26.6.2456-2466.2006. [DOI] [PMC free article] [PubMed] [Google Scholar]
- 25.Schwob E, Nasmyth K. CLB5 and CLB6, a new pair of B cyclins involved in DNA replication in Saccharomyces cerevisiae. Genes Dev. 1993;7:1160–1175. doi: 10.1101/gad.7.7a.1160. [DOI] [PubMed] [Google Scholar]
- 26.Gibson DG, Aparicio JG, Hu F, Aparicio OM. Diminished S-phase cyclin-dependent kinase function elicits vital Rad53-dependent checkpoint responses in Saccharomyces cerevisiae. Mol. Cell. Biol. 2004;24:10208–10222. doi: 10.1128/MCB.24.23.10208-10222.2004. [DOI] [PMC free article] [PubMed] [Google Scholar]
- 27.Donaldson AD, Raghuraman MK, Friedman KL, Cross FR, Brewer BJ, Fangman WL. CLB5-dependent activation of late replication origins in S. cerevisiae. Mol. Cell. 1998;2:173–182. doi: 10.1016/s1097-2765(00)80127-6. [DOI] [PubMed] [Google Scholar]
- 28.Vincent JA, Kwong TJ, Tsukiyama T. ATP- dependent chromatin remodeling shapes the DNA replication landscape. Nat. Struct. Mol. Biol. 2008;15:477–484. doi: 10.1038/nsmb.1419. [DOI] [PMC free article] [PubMed] [Google Scholar]
- 29.Lengronne A, Pasero PA, Bensimon A, Schwob E. Monitoring S phase progression globally and locally using BrdU incorporation in TK(+) yeast strains. Nucleic Acids Res. 2001;29:1433–1442. doi: 10.1093/nar/29.7.1433. [DOI] [PMC free article] [PubMed] [Google Scholar]
- 30.Vernis L, Piskur J, Diffley JFX. Reconstitution of an efficient thymidine salvage pathway in Saccharomyces cerevisiae. Nucleic Acids Res. 2003;31:e120. doi: 10.1093/nar/gng121. [DOI] [PMC free article] [PubMed] [Google Scholar]
- 31.Sherman F. Getting started with yeast. Methods Enzymol. 1991;194:3–21. doi: 10.1016/0076-6879(91)94004-v. [DOI] [PubMed] [Google Scholar]
- 32.Sambrook J, Russell DW. Molecular Cloning. A Laboratory Manual. 3rd edn. New York: Cold Spring Harbor Laboratory Press; 2001. pp. 6–31. [Google Scholar]
- 33.Labit H, Goldar A, Guilbaud G, Douarche C, Hyrien O, Marheineke K. A simple and optimized method of producing silanized surfaces for FISH and replication mapping on combed DNA fibers. Biotechniques. 2008;45:649–52, 654, 656–8. doi: 10.2144/000113002. [DOI] [PubMed] [Google Scholar]
- 34.Marheineke K, Goldar A, Krude T, Hyrien O. Use of DNA combing to study DNA replication in Xenopus and human cell-free systems. Methods Mo.l Biol. 2009;521:575–603. doi: 10.1007/978-1-60327-815-7_33. [DOI] [PubMed] [Google Scholar]
- 35.Sekedat MD, Fenyö D, Rogers RS, Tackett AJ, Aitchison JD, Chait BT. GINS motion reveals replication fork progression is remarkably uniform throughout the yeast genome. Mol. Syst. Biol. 2010;6:353. doi: 10.1038/msb.2010.8. [DOI] [PMC free article] [PubMed] [Google Scholar]
- 36.Bertuzzi A, Gandolfi A, Germani A, Vitelli R. A general expression for sequential DNA-fluorescence histograms. J. Theor. Biol. 1983;102:55–67. doi: 10.1016/0022-5193(83)90262-x. [DOI] [PubMed] [Google Scholar]
- 37.Zietz S, Nicolini C. Biomathematics and Cell Kinetics. Amsterdam: Elsevier/North-Holland Biomedical Press; 1978. pp. 357–394. [Google Scholar]
- 38.Nieduszynski CA, ichiro Hiraga S, Ak P, Benham CJ, Donaldson AD. OriDB: a DNA replication origin database. Nucleic Acids Res. 2007;35(Database issue):D40–D46. doi: 10.1093/nar/gkl758. [DOI] [PMC free article] [PubMed] [Google Scholar]
- 39.Bruni C, Koch G, Rossi C. On the inverse problem in flow cytometry recovering DNA distribution from FMF data. Cell Biophys. 1983;5:5–19. doi: 10.1007/BF02788583. [DOI] [PubMed] [Google Scholar]
- 40.Yang SCH, Gauthier MG, Bechhoefer J. Computational methods to study kinetics of DNA replication. Methods Mol. Biol. 2009;521:555–573. doi: 10.1007/978-1-60327-815-7_32. [DOI] [PubMed] [Google Scholar]
- 41.Bertuzzi A, Gandolfi A, Germani A, Vitelli R. A general expression for sequential DNA-fluorescence histograms. J. Theor. Biol. 1983;102:55–67. doi: 10.1016/0022-5193(83)90262-x. [DOI] [PubMed] [Google Scholar]
- 42.Bell GI, Anderson EC. Cell growth and division. I. A mathematical model with applications to cell volume distributions in mammalian suspension cultures. Biophys. J. 1967;7:329–351. doi: 10.1016/S0006-3495(67)86592-5. [DOI] [PMC free article] [PubMed] [Google Scholar]
- 43.Bruni C, Koch G, Rossi C. On the inverse problem in flow cytometry recovering DNA distribution from FMF data. Cell Biophys. 1983;5:5–19. doi: 10.1007/BF02788583. [DOI] [PubMed] [Google Scholar]
Associated Data
This section collects any data citations, data availability statements, or supplementary materials included in this article.