

Abstract
Bax is a member of the Bcl-2 protein family that participates in mitochondrion-mediated apoptosis. In the early stages of the apoptotic pathway, this protein migrates from the cytosol to the outer mitochondrial membrane, where it is inserted and usually oligomerizes, making cytochrome c-compatible pores. Although several cellular and structural studies have been reported, a description of the stability of Bax at the molecular level remains elusive. This article reports molecular dynamics simulations of monomeric Bax at 300, 400, and 500 K, focusing on the most relevant structural changes and relating them to biological experimental results. Bax gradually loses its α-helices when it is submitted to high temperatures, yet it maintains its globular conformation. The resistance of Bax to adopt an extended conformation could be due to several interactions that were found to be responsible for maintaining the structural stability of this protein. Among these interactions, we found salt bridges, hydrophobic interactions, and hydrogen bonds. Remarkably, salt bridges were the most relevant to prevent the elongation of the structure. In addition, the analysis of our results suggests which conformational movements are implicated in the activation/oligomerization of Bax. This atomistic description might have important implications for understanding the functionality and stability of Bax in vitro as well as within the cellular environment.
Keywords: Bax, Bcl-2 family, thermal unfolding, MD simulations, apoptosis, protein stability, electrostatic interactions
Introduction
The rigorous regulation of proliferation and programmed cell death (apoptosis) is crucial for preserving the survival of multicellular organisms and preventing pathological conditions.1–4 The physical and dynamical behavior of a large family of proteins (Bcl-2 family) is of fundamental importance in apoptosis control by regulating mitochondrial permeability and also the release of Ca2+ from the endoplasmic reticulum. Interestingly, some members of this family promote apoptosis, whereas the rest have antiapoptotic properties.5–7 Furthermore, recently reported clinical strategies targeting the Bcl-2 family have yielded promising results in cancer treatment.8,9 Bcl-2 family proteins have one to four Bcl-2 Homology (BH) domains and can be grouped into three subfamilies: (a) the proapoptotic multidomain proteins with three BH domains (BH1-3); (b) the antiapoptotic members, with either BH1-3 or BH1-4; and (c) the proapoptotic BH3 only proteins.9 Antiapoptotic members perform their function by sequestering those who are proapoptotic.10 Proapoptotic multidomain members promote the mitochondrial apoptotic pathway,10 whereas BH3 only members can either activate multidomain proapoptotic members11 or inactivate antiapoptotic members.12 Other biomolecules have been shown to interact with the Bcl-2 family members and regulate their activity, such as the antiapoptotic viral protein M11L,13 ceramide,14 and cardiolipin.15
Human Bax (Bcl-2-associated X, 192 amino acids) belongs to the proapoptotic multidomain subfamily (BH1-3), shows a large N-terminal loop (M1-T14), and contains a hydrophobic C-terminal helix (Q171-W188). Native Bax is a monomer located in the cytosol and plays an important role in apoptosis. For example, during apoptosis, Bax expression is upregulated16,17 and its structure is activated,18 which results in its migration toward the mitochondrial outer membrane (MOM).19 Afterward, Bax is inserted in the MOM and is capable of making oligomers2,20,21 to permeabilize the MOM.22 The three-dimensional (3D) structure of Bax has been determined by nuclear magnetic resonance, identifying nine alpha helices (αH1-9), joined by loops (Lp1-2, Lp2-3, Lp3-4, Lp4-5, Lp5-6, Lp6-7, Lp7-8, and Lp8-9) with some turns. With this 3D structure for Bax, it is possible to identify the characteristic functional domains BH1, BH2, and BH3, which are formed by residues F100-V121, W151-F165, and L59-D71, respectively (Fig. 1).23
Figure 1.
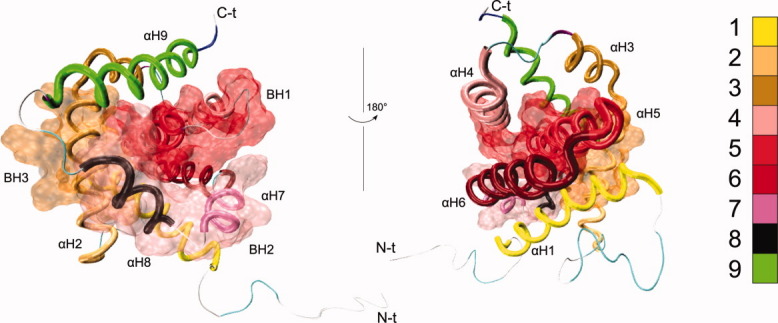
Bax 3D structure (PDB ID: 1F16). The nine α-helices are shown as tubes. The location of BH1-3 is indicated by the transparent surfaces. Labels indicate the N-terminal (N-t) and C-terminal (C-t) ends of the protein. [Color figure can be viewed in the online issue, which is available at wileyonlinelibrary.com.]
Several details in the structure of Bax have been recognized as being important for the functionality and stability of this protein. For instance, a computational effort has predicted that the amino acid sequence of human Bax has a highly conserved region formed by 10 relevant residues in BH1 (G103, N106, G108, R109, V111, and A112) and BH2 domains (W151, G157, and W158), as well as outside of them (V95). Interestingly, the structural analysis showed that many of these residues are protected by the C-terminus of αH9 (I175-W188) which could act as a regulating gate for the access to this region.24 Also, the N-terminal domain of Bax might be implicated in mitochondrial targeting. The first 20 N-terminal residues, that form a loop with a turn (M1-T14; LpNt), and the first turn in αH1 (S15-M20) might hinder exposure of a mitochondrial targeting sequence (M20-R37).25,26 Previous studies determined that residues G12-A24 are exposed when Bax is treated with detergents, unfolded at high temperature and when it is activated.27–29 Also, the C-terminal regions of αH1 as well as αH2 (which contains the BH3 domain) and αH5, should be exposed during Bax activation.23,25 There are other Bax residues, namely K64, I66 and L70 (αH2) and S184 (αH9) that are associated with a function that would imply their location on the surface in active or oligomeric Bax. In particular, S184 determines the interaction of Bax with the mitochondria as a part of the activation mechanism.29 Thus, there are residues that have been suggested to be close to the Bax homo-oligomer interface, such as A24 (αH1), R37, L47 (Lp1-2), D68, E69 (αH2), N73 (Lp2-3), M79 (αH3), A82 (Lp3-4), R134, R145 (αH6), and K189 or K190 (αH9).27
Interactions of Bax with Bcl-2 family members are primarily mediated via their BH3 domain and a hydrophobic groove formed by BH1-3.30–32 Ding et al. found that the interface of the Bcl-2/Bax heterodimer is likely to be formed by the BH3 region of Bax and the BH1-3 groove of Bcl-2.33 The hydrophobic C-terminal helix (αH9) is located in this groove in the native conformation of Bax. Moreover, Lalier et al. identified D68, E69, and D71 as the residues involved in the binding of Bax to Bcl-2 and Bcl-xL.29 Other reports propose that Bax posesses an additional site to interact with the BH3 domains of other proteins. This site includes the residues K21, Q28, Q32 (αH1), and E131, R134 (αH6).11,34 There are several proposed models for the molecular interactions of Bax with other proteins and the MOM.11,27–29,34–36
Regarding the stability of Bax, several interactions have been detected that contribute to strengthening the conformation of this protein.28,29 Lalier et al. described a motif in Lp1-2 (E44-A46) that seems to establish bonds with residues in αH6 (I133 and M137). They also reported that the disruption of the native electrostatic interaction between D33 and K64 leads to exposure of normally hidden epitopes (BH3 and the C-terminal part of αH1 constituted by residues 24-33).29 Additionally, Bax has been submitted to proteolysis at different experimental conditions.28 At 4°C, this proteolysis yielded a fragment lacking 16 C-terminal residues as the major cleavage product, but fragments lacking 18, 19, and 21 C-terminal residues were also observed. This data led the authors to propose that αH9 is not tightly attached to the protein, at least at the cleavage points, whereas the N-terminus was resistant to proteolysis. Furthermore, they were not able to find any C-terminus proteolytic cleavage sites in the case of detergent-induced oligomers, but they observed cleavage after S4, M38, L45, and less frequently after A81 and A82. Moreover, they identified a similar degradation pattern at 70°C, whereas at 80°C, a mixture of N-terminal (cleaved after A46) and C-terminal (mainly cleaved after F176) truncated Bax was identified. The authors also reported that preincubation at 90°C led to a completely inaccessible C-terminus, but the region of 45 N-terminal amino acids was cleaved and Bax was no longer monomeric. These results indicate that Bax shows remarkable structural stability at high temperatures.28 Another member of the Bcl-2 family (Bcl-xL) has also shown important structural stability.37
Molecular dynamics (MD) simulations are a powerful theoretical approach that can successfully complement and extend the experimental results and reproduce them with reasonable accuracy.38,39 In particular, MD simulations at high temperature conditions have been widely and successfully used to study the unfolding of several proteins.40–46 A recent work published in this fine journal used MD simulations at temperatures up to 600 K to study the stability of an important protein, focusing on the role of glycosylation therein.47
Bax has been the object of several biophysical, chemical, and computational studies. Nevertheless, the atomic-level description of Bax stability remains to be fully explored. In this work, we use MD simulations at different temperatures to study the conformational space of monomeric human Bax at 300, 400, and 500 K. Several important interactions for Bax stability (and possibly function) are described. Hydrophobic and electrostatic interactions, as well as hydrogen bonds were detected contributing to the stability of Bax under thermal stress. Our findings might contribute to advance our understanding of the functionality and stability of Bax.
Results and Discusion
Overall stability
The time course evolution of several Bax structural features at 300, 400, and 500 K during 20 ns is shown in Figure 2. Figure 2(a) depicts α-carbons root mean square deviation (RMSD), which is a measure of backbone conformational movement; LpNt contributes to the difference between initial and final structures at 300 K and, albeit to a lesser extent, Lp1-2 also contributes.
Figure 2.

Measurements from the MD simulations. Time evolution of (a) α-carbons RMSD, (b) radius of gyration, and (c) solvent accessible surface area of the protein at different temperatures. (d) The root mean square fluctiations of α-carbons coordinates are shown as a function of residue number at different temperatures; a representation of the secondary structure with labels for the main domains is included. The color coding defined in (a) is the same in all plots. [Color figure can be viewed in the online issue, which is available at wileyonlinelibrary.com.]
Equilibration for 300 and 400 K is observed after 10 ns of MD simulation. Initially, RMSD values increase in the MD simulations during the heating of the system. The values were approximately bounded between 0.3 and 0.6 nm at 300 and 400 K. RMSD values at 500 K show two stages: the first from 5 to 11 ns (RMSD between 0.8 and 1.0 nm) and the second from 11 to 20 ns (RMSD between 1.0 and 1.2 nm). Regarding the radius of gyration (Rg) values [Fig. 2(b)], the starting value is about 1.8 nm, which reflects an expanded polypeptide, mainly due to the initial elongation of LpNt (Fig. 1). During the MD simulations at the three different temperatures studied, the Rg values decrease during the equilibration period. The curves at 300 and 400 K reach values around 1.6 nm after 5 ns, whereas the Rg values at 500 K fluctuate from 1.6 to 1.8 nm. The Rg values of Bax decrease at 300 and 400 K during the equilibration stage mainly due to LpNt movement toward the globule, but the compactness of the conformation is maintained from 5 to 20 ns. In this sense, at 500 K, the Rg fluctuating values are evidence of movements of the LpNt toward and away from the globule, as well as conformational variation of the whole protein. The solvent accessible surface area (SASA) values start close to 170 nm2 and decrease to values around 146 nm2, showing small fluctuations at 300 and 400 K after 5 ns. In both curves, an increase in SASA is observed: at 300 K, this increase is of no more than 20 nm2 (17–19 ns), whereas at 400 K, the value of SASA reaches more than 160 nm2 (16–18 ns). In both cases, SASA recovers its original value by the end of the MD simulations. At 500 K, the SASA values display two phases. In the first one (5–11 ns), the SASA values do not vary noticeably (around 160 nm2), whereas a second phase involves large increases in the SASA values, showing four peaks: 195.9 nm2 (11.2 ns), 236.3 nm2 (13.0 ns), 250.1 nm2 (15.5 ns), and 277.7 nm2 (16.5 ns). After 16.5 ns, the SASA values decrease to about 185.9 nm2 [Fig. 2(c)]. Concerning RMSF values, they are smaller at all temperatures in those regions that belong to α-helices, and larger in loops and turns. It also is evident that LpNt is the most mobile protein region. At 300 and 400 K, RMSF oscillates around 0.2 nm, whereas at 500 K, the RMSF values increase from 0.4 to 1.1 nm, showing seven peaks larger than 0.8 nm. Interestingly, one of these peaks is located at the C-terminus of Bax, which reflects an important conformational change in this region. It is important to mention that RMSF values from BH3 remain low compared with those of the rest of the protein in all MD simulations. The curves obtained follow closely those published by other groups, despite their using of a Bax from a different species,40 or performing the MD simulations with a different force field than the one employed in this work.44
Secondary structure evolution
Secondary structure changes in Bax were evaluated by means of the MD simulation results. Figure 3(a) depicts the secondary structure content in the first 2 ns at 300 K. The last conformation obtained after these 2 ns was considered as the starting point for the next 18 ns of thermal unfolding evaluations. Figure 3(b) shows that at 300 K most of the α-helices are maintained, with a slight reduction of helicity in αH1, αH8, and αH9. Moreover, the protein loses some α-helices at 400 K, particularly αH2 and αH8 [Fig. 3(c)]. However, the α-helix structure reduction is more noticeable at 500 K, where almost all α-helices are absent, except for αH5, which forms the hydrophobic core and appears to be remarkably stable against thermal unfolding. It is worth mentioning that at 500 K, αH6 remains curled, adopting the less stable 310-helix conformation intermittently [Fig. 3(d)]. Additionally, throughout the MD simulations, the hydrogen bond network is reorganized (data not shown), preventing the elongation of the polypetide under heating conditions. These results are correlated with the evolution of Rg values [Fig. 2(b)]; these findings indicate that the structure tends to remain compact.
Figure 3.

Time evolution of the secondary structural elements of the protein in the MD simulations. The representation of the secondary structure from Figure 2(d) is reproduced on the right. [Color figure can be viewed in the online issue, which is available at wileyonlinelibrary.com.]
Electrostatic interactions keep Lp1-2 close to Lp5-6
It is known that electrostatic interactions are important for mantaining 3D structure of proteins both in vitro48 and in MD simulations.49 In the native structure of Bax, there is an electrostatic interaction between R134 (αH6) and E41 (Lp1-2). After 5 ns at 300 K [Fig. 4(a-i)], these two residues move away from each other, making a new electrostatic interaction between E44 (Lp1-2) and K128 (Lp5-6). Figure 4(b-i–iv) and (c-i–iv) show these four residues (E41, E44, K128, and R134) at small distances from each other [Fig. 4(b-i), inset], which helps to keep Lp1-2 close to Lp5-6. This proximity is also observed in all NMR models obtained by Suzuki et al., despite the large mobility shown by E41 (Supporting Information Fig. S1), and the electrostatic interactions between these residues seem to be favored at high temperatures. An interaction of one or both of the acidic residues in Lp1-2 with one or both of the basic residues close to Lp5-6 appears constantly in all the MD simulations, where the minimum distance between the elements of one of these pairs is below 0.2 nm and is close to the van der Waals distance (0.16 nm) 80% of the time at 300 K, 90% of the time at 400 K, and 70% of the time at 500 K (Supporting Information Fig. S2). The persistence of these electrostatic interactions is remarkable at the end of the MD simulation at 500 K, when most of the helicity is lost [Fig. 4(c-iv), left inset]. These interactions appear even at 600 and 700 K (results to be published); these findings suggest that they play an important role in keeping Lp1-2 close to Lp5-6 and therefore contribute to the structural stability of Bax at high temperatures.
Figure 4.

Snapshots of the protein structure at different time points at different temperatures. Important residues and hydrogen bonds are shown where they are involved. The insets show distances in nm. [Color figure can be viewed in the online issue, which is available at wileyonlinelibrary.com.]
Residue D33 remains close to BH3
Cartron et al. found that point-mutated Bax (D33A) was unable to interact with tBid, which suggests that D33 (αH1) is an important residue for Bax function.25 Our MD simulation results show that D33 is close to two basic residues in BH3 (K64 and R65). The minimum distance between D33 and either K64 or R65 is close to the van der Waals distance (0.16 nm) 15% of the time at 300 K and 30% of the time at 400 and 500 K (Supporting Information Fig. S3). These electrostatic interactions contribute to the proximity of αH1 and αH2 and hence to the structural stability of Bax. The disruption of a similar “ionic lock” has been identified as important in the activation process of a protein with transmembrane helices.50 The previously mentioned residues involved in these electrostatic interactions are shown in Figure 4. Figure 4(b-iii) shows that at 15 ns in the MD simulation at 400 K, αH1 and αH2 have a tendency to move away from each other. The electrostatic interactions between D33 and K64, R65 or both help to prevent this separation [Fig. 4(b-iii), inset]. These interactions are also observed in the MD simulation at 500 K [Fig. 4(c-iv), right inset].
Unfolding of αH4 protects the hydrophobic core
During the first 4 ns of the MD simulation at 500 K, all α-helices tend to unfold, as can be seen in Figure 3(d). There is a large jump in the RMSD plot for this MD simulation [Fig. 2(a), 11–12 ns], which may be related to the loss of the great majority of helicity, as can be seen in the snapshot at 15 ns [Fig. 4(c-iii)]. When αH4 unfolds and becomes an unstructured coil (15 ns), it remains close to the core of the protein and protects αH5, and this domain folds back into a helix. Likewise, unfolded αH4 prevents αH7 from moving away from the core of the protein [Fig. 4(c-iii)]. With the refolding of αH5 and the holding of αH7 close to the core, αH6 regains helicity [20 ns, Fig. 4(c-iv)]. After becoming a coil, αH4 protects the hydrophobic core. This concerted mechanism helps BH1, BH2, and BH3 to remain close to each other. These conformational changes are depicted in Figure 4(c) and can also be followed in Figure 3(d), where the loss of αH4 at 500 K is closely followed by a significant recovery of αH5 and a small recovery of αH6. The changes in the trend in SASA at 500 K can also be related to this mechanism, where a growing trend starting after 10 ns, which could be caused by the unfolding, is replaced by a decreasing trend after reaching 16 ns, which could be explained by the recovery of structure [Fig. 2(c)].
Exposure of region immunodetected by antibody 6A7 (residues 12–24) at high temperatures
There is evidence that Bax activation exposes an epitope (G12-A24).27–29 The SASA values for these residues in the MD simulations show little change, as they are around 8 nm2 at 300 K and remain below 11.2 nm2 even at 500 K (Supporting Information Fig. S4). Searching for structural changes involved in the exposure of these residues, it was observed that the GGG motif close to the N-terminus of αH1 (G10-G12) is very flexible and allows M1-G10 (LpNt) to interact with αH6. In the MD simulations performed, favorable electrostatic interactions were detected between D2 (LpNt) and R145 (αH6) at 300 and 500 K. In addition, electrostatic interactions between D2 and R9 (both LpNt) at 300 and 500 K and between D6 and R9 at 400 K were found to help to bend LpNt (Supporting Information Figs. S5 and S6). These D2 interactions explain its local RMSF minima at 300 K and at 500 K [Fig. 2(d)].
Other groups have proposed that residues M1-M20 (LpNt) play an inhibitory role for Bax mitochondrial localization.26,29 Our results show that LpNt protects the 6A7 epitope on one side during the course of the MD simulations. On the opposite side, we found that residues P49-S60 and the 6A7 epitope make a cavity that allows the latter to be in contact with the solvent in the native conformation and during the MD simulation at 300 K; the small size of this cavity shown during the MD simulations might prevent the corresponding antibody from reaching the epitope. This access to solvent but not to larger molecules explains the small change in SASA for this domain in the MD simulations. These residues (P49-S60) start in Lp1-2 and include the N-terminal part of αH2 (Fig. 5). Their proximity to the epitope [Fig. 5(a)] is partially stabilized by the electrostatic interaction between K21 (epitope) and Q52 (Lp1-2). This interaction is lost at 400 K and the 6A7 epitope is exposed [Fig. 5(b)]. At 300 K, Lp1-2 shows some mobility but remains close to the core for most of the MD simulation [Fig. 5(a)]. At 400 K, Lp1-2 adopts a different conformation and points away from the core [Fig. 5(b)]. These movements allow the residues P49-S60 to move away from the epitope, leaving it exposed. At 500 K, the epitope is uncovered by P49-S60 moving away from the core early in the MD simulation. It is known that the free energy of antigen–antibody complex formation represents a balance between enthalpic and entropic forces. Analyzing only the 6A7 epitope, a period ranging from 12 to 18 ns exhibited a robust increase in SAS up to 50% at 400 K. As expected, free energy solvation showed a sustained decrease (from −15 to 38 kJ/M) starting at 12 ns until 17 ns approximately, followed by a recovery. These patterns were presented at 300 K but modest and shifted in time scale (Data not shown). Therefore, an apoptosis-compatible energetic barrier should be overcome at physiological temperature.
Figure 5.

Exposure of the epitope 6A7 under heating conditions. Final structures for the MD simulations at 300 K (a) and 400 K (b) are shown. Residues K21, Q52, D2, and R145 are shown in CPK. The epitope is shown in green; it starts in LpNt and includes the first residues in αH1, and the rest of αH1 is shown in yellow. The side chains of the region that interacts with the antibody 6A7 (T14-I19) are shown in Licorice. Residues P49-S60 are shown with transparent surfaces in green. αH6 is shown in red. [Color figure can be viewed in the online issue, which is available at wileyonlinelibrary.com.]
Another factor that prevents αH1 from moving away from the core of the protein is the formation of several hydrogen bonds between LpNt (residues M1-T14) and the core of the protein. The structural analysis also shows an increment in the number of residue pairs closer than 0.35 nm. These pairs are likely to have a favorable interaction, which contributes to keep these residues close to the core (Supporting Information Fig. S7).
These MD simulations results reveal that Bax can show the 6A7 antibody epitope at high temperatures. This finding is in agreement with the experimental results in the literature.28
Hydrophobic groove covering by αH9
The hydrophobic groove formed by BH1-3, which is occupied by αH9 in the native conformation, has been shown to be important in the interaction of Bax with other members of the Bcl-2 family.30,31 Therefore, the exposure of this groove could be involved in the oligomerization process of Bax. This hydrophobic groove is protected constantly by αH9 despite the great conformational changes induced by heating conditions in the MD simulations.
These MD simulations provide evidence that electrostatic interactions involving K189 and K190 are important for protecting the hydrophobic groove by αH9 under heating conditions. K189 and K190 tend to point in opposite directions due to steric hindrance effects and their equal positive charges. With this spatial disposition, these residues form a positively charged “anchor” that is trapped in an ionic “cage” formed by four negatively charged residues (E69, D86, E90, and D98) in the MD simulations at high temperatures. For example, at 400 K, D98 interacts with K190 [Fig. 6(a)], whereas at 500 K, K190 is close to D86 [5 ns, Fig. 6(b)] and such interactions continue to arise. At 10 ns, K189 replaces K190 in the proximity of D86 and also interacts with E90 [Fig. 6(c)]. At 15 ns, another combination emerges with K190 interacting with D98 and K189 with E69 [Fig. 6(d)]. The electrostatic interactions involving K189 and K190 could account for their local RMSF minima at 400 and 500 K [Fig. 2(d)], and they seem to contribute to the structural stability of Bax at high temperatures (Supporting Information Fig. S1).
Figure 6.

Electrostatic interactions that prevent αH9 from moving away from the protein core. K189 is shown in Licorice and K190 in CPK. αH9 is shown in green. Acidic residues that form the ionic “cage” are depicted in the VDW representation. In all cases, the minimum distance between the lysines and the acid residues is close to 1.6 Å, which is the van der Waals distance for a nonbonded O–H pair. [Color figure can be viewed in the online issue, which is available at wileyonlinelibrary.com.]
Moreover, there is evidence that hydrogen bonds involving the sidechain of S184 contribute to protect the hydrophobic groove by αH9.23 In the native structure, S184 forms a hydrogen bond with the backbone carbonyl of V95. In the MD simulation at 300 K, the sidechain of S184 forms a hydrogen bond with the sidechain of D98, which keeps the rotamer of S184 pointing to the core of the protein. At 400 K, within the first 5 ns, the hydrogen bond of S184 with V95 is reformed, whereas D98 contributes to the stability of Bax in a diferent manner, by interacting with K190 as described above. At 10 ns, S184 forms a hydrogen bond with N106 (Lp4-5), but the helix turn of αH9 that contains S184 partially unfolds and leaves S184 exposed to the solvent. Furthermore, the electrostatic interaction between D98 and K190 is maintained and a hydrogen bond appears between D98 and T186. At 15 ns, S184 is still exposed to the solvent, but it forms a hydrogen bond with the backbone carbonyl of V180. D98 remains close to either K190 or T186 for the rest of the MD simulation. At 20 ns, S184 is close to R109 but is mostly accessible to the solvent (data not shown). At 500 K, S184 is completely exposed, thus no longer forming hydrogen bonds with other residues (Supporting Information Fig. S8). The exposure of S184 could be the cause of a large increase in the mobility of αH9 at 500 K [Fig. 2(d)], but it is not enough to separate this helix from the hydrophobic groove.
Brock et al. found that the release of αH9 is essential for the activation of Bax51; thus, the interactions reported in this section that help to maintain the helix tucked into the hydrophobic groove at high temperatures would contribute to the structural stability of Bax.
Hydrophobic interaction between W107 and BH2 residues
W107 belongs to BH1 (F100-V121) and is close to BH2 (W151-F165) in the native conformation. BH2 includes most of αH7, Lp7-8, and αH8. In the MD simulation at 300 K, an aromatic–aromatic interaction between W107 and Y164 is suggested. This kind of interaction has been reported as a mechanism of tertiary structure stabilization.52 Also, in this MD simulation, W107 buries itself in the core, approaching W158 in Lp7-8, which helps to keep BH1 close to BH2 [Fig. 7(a)]. The SASA value for W107 increases in the MD simulations under heating conditions (Supporting Information Fig. S9). At 400 K, W107 is partially exposed and the hydrophobic and aromatic residues in BH2 are not as close as they were at 300 K because BH2 and Lp7-8 elongate, although they remain close to BH1 [Fig. 7(b)]. At 500 K, W107 is mostly exposed, although it is close to Y164 and F165, which favors aromatic–aromatic interactions; however, BH2 shows a loss of helicity during this MD simulation [Fig. 7(c)]. W107 is at the beginning of the RMSF valley that corresponds to αH5 in all the MD simulations [Fig. 2(d)]. The observed hydrophobic and aromatic–aromatic interactions of W107 with residues in αH7 (W151, I152), Lp7-8 (W158), and αH8 (L161, L162, Y164, and F165) are in agreement with structural studies reported elsewhere.53
Figure 7.

Exposure of W107. Final structures (20 ns) are shown from the MD simulations at 300 K (left), 400 K (middle), and 500 K (right). W107 is shown in VDW and the SASA of the region formed by residues L148-F165 in transparent gray. The color code for the helices is the same as in Figure 1. At 300 K, W107 remains buried and its aromatic rings are perpendicular to Lp7-8. At 400 K, W107 is more exposed, and its aromatic rings are almost parallel to Lp7-8. At 500 K, W107 is mostly exposed. The hydrophobic and aromatic residues in BH2 (W151, I152, W158, L161, L161, Y164, and F165) are shown in Licorice. [Color figure can be viewed in the online issue, which is available at wileyonlinelibrary.com.]
Normal mode analysis
Normal mode analysis (NMA) identifies potential conformational changes in proteins.54 In this work, NMA was performed with the Elastic Network Model, which is implemented with the “rotation-translation-block” approximation in the web interface ElNémo.55 Previous reports in the literature suggest that the consideration of the first 10 nontrivial modes should be suficient for a reasonable analysis of a protein with a number of degrees of freedom similar to Bax.56,57 NMA was performed on the native structure of Bax and the final structures of each MD simulation at different temperatures. A common pattern among the modes considered was an important mobility in the loops, particularly in LpNt and Lp1-2 as well as in αH9. Modes with low collectivity are likely to suggest domains that would have significant mobility in a conformational change. For the native structure, modes 9 and 11 show little collectivity; this finding is explained by the large mobility of LpNt. The same is true for the three low collectivity modes in the NMA of the final structure at 300 K (modes 7–9), whereas the rest of the modes show high mobility in Lp1-2 and Lp5-6, as does the low collectivity mode obtained at 400 K (mode 9). Modes 14–16 at 400 K also show a high mobility of BH2. The NMA of the final structure at 500 K shows one low collectivity mode with a huge displacement of E41 and the residues around it in Lp1-2. Several of the other modes for this structure show increased mobility levels for αH4, which can be explained by its unfolding at 500 K [Fig. 4(c)]. Also, a large mobility observed in Lp1-2 and Lp5-6 in the NMA suggests a coherent motion of Lp1-2 and H5-6 which could favor the separation of these domains. This would lead to a major conformational change and expose the transmembrane domain, which would be important for the functionality of Bax (Supporting Information Fig. S10).
Other relevant residues
Mancinelli and coworkers performed 10 ns of MD simulation at 300 K and 5 ns at 400 K using a united-atom force field. Their analysis aimed to identify the protein regions and the motions of Bax that are involved in the conformational change that targets Bax into the MOM.44 However, the specific interactions that contribute to the stability of Bax and their nature are not investigated as is attempted in this work.
There are other residues that have been proposed to be close to the Bax surface when it forms a complex with a member of the Bcl-2 family, such as A24, Q28, Q32, R37, L47, I66, D68, L70, N73, M79, A82, and E131.27,29,34 The behavior of these residues is briefly discussed below. Because Q32 and I66 remain hidden in these MD simulations, their exposure might be important in the activation mechanism of Bax. R37, L47, D68, and E131 remain exposed, and A24 remains close to the surface in our MD simulations. The exposure of R37 seems to be stabilized by electrostatic interactions. N73, M79, and A82 are part of the surface of Bax, but their SASA values increase at 400 and 500 K. Q28 is fully exposed until αH1 starts to unfold, when it faces toward the core; however, when αH1 is fully unfolded, Q28 is exposed again. L70 approaches the surface at 10 ns in the MD simulation at 500 K (data not shown).
A putative functional region of Bax was also predicted, and it includes several residues (V95, G103, N106, G108, R109, V111, A112, W151, G157, and W158).24 Among these residues, Gurudutta et al. suggested that G108, R109, and W151 are important in the oligomerization of Bcl-2 family proteins by interacting with the BH3 domain of another Bcl-2 family member.58 Although we find that G108 is fully exposed in these MD simulations, R109 is found to be partially covered by αH4 when this α-helix unfolds at 500 K, whereas W151 switches from exposed to hidden at 500 K. The hiding of R109 and W151 at high temperatures as observed in these MD simulations would hinder the oligomerization of Bax and thus contribute to its structural stability. As for V111 and A112 (both in αH5), they are hidden in all the MD simulations and have hydrophobic interactions with V180 (αH9) and I66 (αH2) in the final MD simulation structure at 400 K and additionally with A183 (αH9) in the final MD simulation structure at 500 K (data not shown). These residues are located in the transmembrane domain of Bax,23 and the hydrophobic interactions that hinder their exposure might prevent Bax from activating. G103, N106 (both Lp4-5), and G157 (Lp7-8) are exposed in these MD simulations, interacting mostly with the solvent. Their contribution to the structural stability of Bax seems to be limited to the hydrogen bonds involving their backbone atoms. To the best of our knowledge, the roles of these particular residues in the function or stability of Bax have not been addressed in the literature. The contributions of V95 and W158 to the structural stability of Bax were discussed above.
Conclusions
Stable conformations for Bax are reached in all MD simulations treated at different temperatures, and most of the original α-helices are lost at high temperatures. The stability of the 3D structure is preserved by electrostatic interactions under heating conditions. Hydrophobic interactions and hydrogen bonds are also found to play a role in maintaining the 3D structure of Bax in the MD simulations. There are some domains hidden in the native structure that become exposed at high temperatures, such as the 6A7 epitope (G12-A24).
The 3D structure of Bax appears to have several recovery mechanisms to prevent its domains from moving away from each other when subjected to high temperatures to maintain the protein compactness. Electrostatic interactions arise between acidic residues in Lp1-2 (E41 and E44) and basic residues in αH5 (K128) and αH6 (R134) and are important to keep Lp1-2, αH5, and αH6 together when Bax is subjected to high temperatures. At 500 K, αH4 unfolds into a coil but remains close to the globule and has interactions with BH1, BH2, and BH3 that help to keep these domains close to each other. Electrostatic interactions of K189 and K190 with acidic residues in other domains emerge and are important to keep αH9 covering the hydrophobic groove under heating conditions. The contributions of several electrostatic interactions to the stability of Bax under thermal stress might have their evolutionary origin in the importance of preventing this protein from aimlessly activating and thus triggering apoptosis.
Materials and Methods
The starting structure (native) for MD simulations of the Bax monomer was obtained from the first NMR model located it the Protein Data Bank (PDB) by Suzuki et al. (PDB ID: 1F16).23 All MD simulations were performed with GROMACS 4,59 using the OPLS-AA force field.60 The leap-frog algorithm for integrating Newton equations was used, and periodic boundary conditions were applied. The protein was solvated in a rectangular box of modified SPC,61 with a minimum distance of 1 nm from the protein to the edge of the box. To obtain a neutral total charge in the system, 3 Na+ counterions were added. The total size of the system was of 38,647 atoms, including 11,889 water molecules. All bonds were constrained using LINCS.62 During energy minimization, the steepest descents algorithm was used and the convergence was reached in 200 steps. Further equilibration of the system was accomplished in 5000 steps (10 ps) of MD with restricted protein atoms and NVT conditions with a box size of 9.44551 × 7.45274 × 7.68113 nm. Afterward, 2 ns of MD were performed at 300 K without any atom fixing and under NPT conditions, which were used for the following MD simulations as well, so that the size of the box could fluctuate to keep the pressure at a constant value. Using the latter trajectory as a starting point, another 18 ns of production MD were obtained at 300, 400, and 500 K. MD simulations were performed with a time step of 2 fs, and the coordinates for the whole system were saved every 250 steps. For all MD simulations, neighbor lists were updated every 10 steps. The PME algorithm63–65 was used for the electrostatic interactions with a cut-off of 1 nm, and a reciprocal grid of 54 × 42 × 44 cells was used with 4th order B-spline interpolation. A single cut-off of 1 nm was used for the calculation of van der Waals interactions. Temperature and pressure coupling were performed with the Nosé-Hoover algorithm66,67 and the Parrinello-Rahman algorithm,68,69 respectively. After stabilization of the system, in all cases, the potential energy was conserved during the MD simulations. The analysis tools included in GROMACS were used to calculate the RMSD, RMSF, Rg, and SASA. The evolution of the secondary structure was followed using the DSSP program.70 Normal mode analysis was performed using the web-server ElNémo,55 where the only change with respect to default settings was in the number of lowest frequency normal modes to be computed which was set to 10 (default = 5). The minimum perturbation (DQMIN), maximum perturbation (DQMAX), and step size between DQMIN and DQMAX were left at their default values of −100, 100, and 20, respectively. The advanced options were also left in their default settings (NRBL = auto and CUTOFF = 8). Graphical representations of the protein were obtained using VMD.71
Supplementary material
References
- 1.Zhivotovsky B, Orrenius S. Cell death mechanisms: cross-talk and role in disease. Exp Cell Res. 2010;316:1374–1383. doi: 10.1016/j.yexcr.2010.02.037. [DOI] [PubMed] [Google Scholar]
- 2.Brenner D, Mak TW. Mitochondrial cell death effectors. Curr Opin Cell Biol. 2009;21:871–877. doi: 10.1016/j.ceb.2009.09.004. [DOI] [PubMed] [Google Scholar]
- 3.Droin NM, Green DR. Role of Bcl-2 family members in immunity and disease. Biochim Biophys Acta. 2004;1644:179–188. doi: 10.1016/j.bbamcr.2003.10.011. [DOI] [PubMed] [Google Scholar]
- 4.Sorenson CM. Bcl-2 family members and disease. Biochim Biophys Acta. 2004;1644:169–177. doi: 10.1016/j.bbamcr.2003.08.010. [DOI] [PubMed] [Google Scholar]
- 5.Wang C, Youle RJ. The role of mitochondria in apoptosis. Annu Rev Genet. 2009;43:95–118. doi: 10.1146/annurev-genet-102108-134850. [DOI] [PMC free article] [PubMed] [Google Scholar]
- 6.Chipuk JE, Moldoveanu T, Llambi F, Parsons MJ, Green DR. The BCL-2 family reunion. Mol Cell. 2010;37:299–310. doi: 10.1016/j.molcel.2010.01.025. [DOI] [PMC free article] [PubMed] [Google Scholar]
- 7.Szegezdi E, MacDonald DC, Chonghaile TN, Gupta S, Samali A. Bcl-2 family on guard at the ER. Am J Physiol Cell Physiol. 2009;296:C941–C953. doi: 10.1152/ajpcell.00612.2008. [DOI] [PubMed] [Google Scholar]
- 8.Muilenburg DJ, Coates JM, Virudachalam S, Bold RJ. Targeting Bcl-2-mediated cell death as a novel therapy in pancreatic cancer. J Surg Res. 2010;163:276–281. doi: 10.1016/j.jss.2010.02.021. [DOI] [PMC free article] [PubMed] [Google Scholar]
- 9.Brunelle JK, Letai A. Control of mitochondrial apoptosis by the Bcl-2 family. J Cell Sci. 2009;122:437. doi: 10.1242/jcs.031682. [DOI] [PMC free article] [PubMed] [Google Scholar]
- 10.Dewson G, Kluck RM. Bcl-2 family-regulated apoptosis in health and disease. Cell Health Cytoskelet. 2010;2:9–22. [Google Scholar]
- 11.Czabotar PE, Colman PM, Huang DC. Bax activation by Bim? Cell Death Differ. 2009;16:1187–1191. doi: 10.1038/cdd.2009.83. [DOI] [PubMed] [Google Scholar]
- 12.Willis SN, Fletcher JI, Kaufmann T, van Delft MF, Chen L, Czabotar PE, Ierino H, Lee EF, Fairlie WD, P Bouillet AS, Kluck RM, Adams JM, Huang DC. Apoptosis initiated when BH3 ligands engage multiple Bcl-2 homologs, not Bax or Bak. Science. 2007;315:856–859. doi: 10.1126/science.1133289. [DOI] [PubMed] [Google Scholar]
- 13.Douglas AE, Corbett KD, Berger JM, McFadden G, Handel TM. Structure of M11L: a myxoma virus structural homolog of the apoptosis inhibitor, Bcl-2. Protein Sci. 2007;16:695–703. doi: 10.1110/ps.062720107. [DOI] [PMC free article] [PubMed] [Google Scholar]
- 14.Ganesan V, Perera MN, Colombini D, Datskovskiy D, Chadha K, Colombini M. Ceramide and activated Bax act synergistically to permeabilize the mitochondrial outer membrane. Apoptosis. 2010;15:553–562. doi: 10.1007/s10495-009-0449-0. [DOI] [PubMed] [Google Scholar]
- 15.Schug ZT, Gottlieb E. Cardiolipin acts as a mitochondrial signalling platform to launch apoptosis. Biochim Biophys Acta. 2009;1788:2022–2031. doi: 10.1016/j.bbamem.2009.05.004. [DOI] [PubMed] [Google Scholar]
- 16.Vaseva AV, Moll UM. The mitochondrial p53 pathway. Biochim Biophys Acta. 2009;1787:414–420. doi: 10.1016/j.bbabio.2008.10.005. [DOI] [PMC free article] [PubMed] [Google Scholar]
- 17.Lee WT, Chang CW. Bax is upregulated by p53 signal pathway in the SPE B-induced apoptosis. Mol Cell Biochem. 2010;343:271–279. doi: 10.1007/s11010-010-0522-6. [DOI] [PubMed] [Google Scholar]
- 18.Sun T, Lin X, Wei Y, Xu Y, Shen P. Evaluating bistability of Bax activation switch. FEBS Lett. 2010;584:954–960. doi: 10.1016/j.febslet.2010.01.034. [DOI] [PubMed] [Google Scholar]
- 19.Hsu YT, Wolter KG, Youle RJ. Cytosol-to-membrane redistribution of Bax and Bcl-X(L) during apoptosis. Proc Natl Acad Sci USA. 1997;94:3668–3672. doi: 10.1073/pnas.94.8.3668. [DOI] [PMC free article] [PubMed] [Google Scholar]
- 20.Jourdain A, Martinou JC. Mitochondrial outer-membrane permeabilization and remodelling in apoptosis. Int J Biochem Cell Biol. 2009;41:1884–1889. doi: 10.1016/j.biocel.2009.05.001. [DOI] [PubMed] [Google Scholar]
- 21.Schlesinger PH, Saito M. The Bax pore in liposomes, biophysics. Cell Death Differ. 2006;13:1403–1408. doi: 10.1038/sj.cdd.4401991. [DOI] [PubMed] [Google Scholar]
- 22.Qian S, Wang W, Yang L, Huang HW. Structure of transmembrane pore induced by Bax-derived peptide: evidence for lipidic pores. Proc Natl Acad Sci USA. 2008;105:17379–17383. doi: 10.1073/pnas.0807764105. [DOI] [PMC free article] [PubMed] [Google Scholar]
- 23.Suzuki M, Youle RJ, Tjandra N. Structure of Bax: coregulation of dimer formation and intracellular localization. Cell. 2000;103:645–654. doi: 10.1016/s0092-8674(00)00167-7. [DOI] [PubMed] [Google Scholar]
- 24.Sánchez-Aguilar M, Marchat LA, Zamorano A. Prediction of a Putative functional region in the human Bax protein by computational analysis. Am J Infect Dis. 2007;3:68–75. [Google Scholar]
- 25.Cartron PF, Gallenne T, Bougras G, Gautier F, Manero F, Vusio P, Meah K, Vallette FM, Juin P. The First α-helix of Bax plays a necessary role in its ligand-induced activation by the BH3-only proteins bid and PUMA. Mol Cell. 2004;16:807–818. doi: 10.1016/j.molcel.2004.10.028. [DOI] [PubMed] [Google Scholar]
- 26.Goping IS, Gross A, Lavoie JN, Nguyen M, Jemmerson R, Roth K, Korsmeyer SJ, Shore GC. Regulated targeting of BAX to mitochondria. J Cell Biol. 1998;143:207–215. doi: 10.1083/jcb.143.1.207. [DOI] [PMC free article] [PubMed] [Google Scholar]
- 27.Zhang Z, Zhu W, Lapolla SM, Miao Y, Shao Y, Falcone M, Boreham D, McFarlane N, Ding J, Johnson AE, Zhang XC, Andrews DW, Lin J. Bax forms an oligomer via separate, yet interdependent, surfaces. J Biol Chem. 2010;285:17614–17627. doi: 10.1074/jbc.M110.113456. [DOI] [PMC free article] [PubMed] [Google Scholar]
- 28.Bleicken S, Zeth K. Conformational changes and protein stability of the pro-apoptotic protein Bax. J Bioenerg Biomembr. 2009;41:29–40. doi: 10.1007/s10863-009-9202-1. [DOI] [PMC free article] [PubMed] [Google Scholar]
- 29.Lalier L, Cartron PF, Juin P, Nedelkina S, Manon S, Bechinger B, Vallette FM. Bax activation and mitochondrial insertion during apoptosis. Apoptosis. 2007;12:887–896. doi: 10.1007/s10495-007-0749-1. [DOI] [PubMed] [Google Scholar]
- 30.Oh KJ, Barbuto S, Pitter K, Morash J, Walensky LD, Korsmeyer SJ. A membrane-targeted BID BCL-2 homology 3 peptide is sufficient for high potency activation of BAX in vitro. J Biol Chem. 2006;281:36999–37008. doi: 10.1074/jbc.M602341200. [DOI] [PubMed] [Google Scholar]
- 31.Lama D, Sankararamakrishnan R. Anti-apoptotic Bcl-XL protein in complex with BH3 peptides of pro-apoptotic Bak, Bad, and Bim proteins: comparative molecular dynamics simulations. Proteins: Struct Funct Bioinf. 2008;73:492–514. doi: 10.1002/prot.22075. [DOI] [PubMed] [Google Scholar]
- 32.Fire E, Gullá SV, Grant RA, Keating AE. Mcl-1-Bim complexes accommodate surprising point mutations via minor structural changes. Protein Sci. 2010;19:507–519. doi: 10.1002/pro.329. [DOI] [PMC free article] [PubMed] [Google Scholar]
- 33.Ding J, Zhang Z, Roberts GJ, Falcone M, Miao Y, Shao Y, Zhang XC, Andrews DW, Lin J. Bcl-2 and Bax interact via the BH1-3 Groove-BH3 motif interface and a novel interface involving the BH4 motif. J Biol Chem. 2010;285:28749–28763. doi: 10.1074/jbc.M110.148361. [DOI] [PMC free article] [PubMed] [Google Scholar]
- 34.Gavathiotis E, Suzuki M, Davis ML, Pitter K, Bird GH, Katz SG, Tu HC, Kim H, Cheng EH, Tjandra N, Walensky LD. BAX activation is initiated at a novel interaction site. Nature. 2008;455:1076–1081. doi: 10.1038/nature07396. [DOI] [PMC free article] [PubMed] [Google Scholar]
- 35.Bleicken S, Classen M, Padmavathi PVL, Ishikawa T, Zeth K, Steinho HJ, Bordignon E. Molecular details of Bax activation, oligomerization, and membrane insertion. J Biol Chem. 2010;285:6636–6647. doi: 10.1074/jbc.M109.081539. [DOI] [PMC free article] [PubMed] [Google Scholar]
- 36.Veresov VG, Davidovskii AI. Activation of Bax by joint action of tBid and mitochondrial outer membrane: Monte Carlo simulations. Eur Biophys J. 2009;38:941–960. doi: 10.1007/s00249-009-0475-4. [DOI] [PubMed] [Google Scholar]
- 37.Thuduppathy GR, Hill RB. Acid destabilization of the solution conformation of Bcl-XL does not drive its pH-dependent insertion into membranes. Protein Sci. 2006;15:248–257. doi: 10.1110/ps.051807706. [DOI] [PMC free article] [PubMed] [Google Scholar]
- 38.Daggett V. Protein folding-simulation. Chem Rev. 2006;106:1898–1916. doi: 10.1021/cr0404242. [DOI] [PubMed] [Google Scholar]
- 39.Day R, Paschek D, Garcia AE. Microsecond simulations of the folding/unfolding thermodynamics of the Trp-cage miniprotein. Proteins. 2010;78:1889–1899. doi: 10.1002/prot.22702. [DOI] [PMC free article] [PubMed] [Google Scholar]
- 40.Koshy C, Parthiban M, Sowdhamini R. 100 ns molecular dynamics simulations to study intramolecular conformational changes in Bax. J Biomol Struct Dyn. 2010;28:71–83. doi: 10.1080/07391102.2010.10507344. [DOI] [PubMed] [Google Scholar]
- 41.Yan C, Pattani V, Tunnell JW, Ren P. Temperature-induced unfolding of epidermal growth factor (EGF): insight from molecular dynamics simulation. J Mol Graph Model. 2010;29:2–12. doi: 10.1016/j.jmgm.2010.03.011. [DOI] [PMC free article] [PubMed] [Google Scholar]
- 42.Lin YW, Ni FY, Ying TL. Early events in thermal unfolding of apocytochrome b562 and its double-cysteine mutant as revealed by molecular dynamics simulation. Theochem. 2009;898:82–89. [Google Scholar]
- 43.Chng CP, Kitao A. Thermal unfolding simulations of bacterial agellinsight into its refolding before assembly. Biophys J. 2008;94:3858–3871. doi: 10.1529/biophysj.107.123927. [DOI] [PMC free article] [PubMed] [Google Scholar]
- 44.Mancinelli F, Caraglia M, Budillon A, Abbruzzese A, Bismuto E. Molecular dynamics simulation and automated docking of the pro-apoptotic Bax protein and its complex with a peptide designed from the Bax-binding domain of anti-apoptotic Ku70. J Cell Biochem. 2006;99:305–318. doi: 10.1002/jcb.20893. [DOI] [PubMed] [Google Scholar]
- 45.Paschek D, Hempel S, García AE. Computing the stability diagram of the Trp-cage miniprotein. Proc Natl Acad Sci USA. 2008;105:17754–17759. doi: 10.1073/pnas.0804775105. [DOI] [PMC free article] [PubMed] [Google Scholar]
- 46.Wang L, Duan Y, Shortle R, Imperiali B, Kollman PA. Study of the stability and unfolding mechanism of BBA1 by molecular dynamics simulations at different temperatures. Protein Sci. 1999;8:1292–1304. doi: 10.1110/ps.8.6.1292. [DOI] [PMC free article] [PubMed] [Google Scholar]
- 47.Kaushik S, Mohanty D, Surolia A. Role of glycosylation in structure and stability of Erythrina corallodendron lectin (EcorL): a molecular dynamics study. Protein Sci. 2011;20:465–481. doi: 10.1002/pro.578. [DOI] [PMC free article] [PubMed] [Google Scholar]
- 48.Pace CN, Alston RW, Shaw KL. Charge–charge interactions influence the denatured state ensemble and contribute to protein stability. Protein Sci. 2000;9:1395–1398. doi: 10.1110/ps.9.7.1395. [DOI] [PMC free article] [PubMed] [Google Scholar]
- 49.Shen JK. Uncovering specific electrostatic interactions in the denatured states of proteins. Biophys J. 2010;99:924–932. doi: 10.1016/j.bpj.2010.05.009. [DOI] [PMC free article] [PubMed] [Google Scholar]
- 50.Ballesteros JA, Jensen AD, Liapakis G, Rasmussen SGF, Shi L, Gether U, Javitch JA. Activation of the β2-adrenergic receptor involves disruption of an ionic lock between the cytoplasmic ends of transmembrane segments 3 and 6. J Biol Chem. 2001;276:29171–29177. doi: 10.1074/jbc.M103747200. [DOI] [PubMed] [Google Scholar]
- 51.Brock SE, Li C, Wattenberg BW. The Bax carboxy-terminal helix does not determine organelle-specific targeting but is essential for maintaining Bax in an inactive state and for stable mitochondrial membrane insertion. Apoptosis. 2010;15:14–27. doi: 10.1007/s10495-009-0410-2. [DOI] [PubMed] [Google Scholar]
- 52.Burley SK, Petsko GA. Aromatic-aromatic interaction: a mechanism of protein structure stabilization. Science. 1985;229:23–28. doi: 10.1126/science.3892686. [DOI] [PubMed] [Google Scholar]
- 53.Petros AM, Olejniczak ET, Fesik SW. Structural biology of the Bcl-2 family of proteins. Biochim Biophys Acta. 2004;1644:83–94. doi: 10.1016/j.bbamcr.2003.08.012. [DOI] [PubMed] [Google Scholar]
- 54.Tama F, Sanejouand YH. Conformational change of proteins arising from normal mode calculations. Protein Eng. 2001;14:1–6. doi: 10.1093/protein/14.1.1. [DOI] [PubMed] [Google Scholar]
- 55.Suhre K, Sanejouand YH. ElNemo: a normal mode web-server for protein movement analysis and the generation of templates for molecular replacement. Nucleic Acids Research. 2004;32:W610–W614. doi: 10.1093/nar/gkh368. [DOI] [PMC free article] [PubMed] [Google Scholar]
- 56.Krebs WG, Alexandrov V, Wilson CA, Echols N, Yu H, Gerstein M. Normal mode analysis of macromolecular motions in a database framework: developing mode concentration as a useful classifying statistic. Proteins. 2002;48:682–695. doi: 10.1002/prot.10168. [DOI] [PubMed] [Google Scholar]
- 57.Levy RM, Perahia D, Karplus M. Molecular dynamics of an alpha-helical polypeptide: temperature dependence and deviation from harmonic behavior. Proc Natl Acad Sci USA. 1982;79:1346–1350. doi: 10.1073/pnas.79.4.1346. [DOI] [PMC free article] [PubMed] [Google Scholar]
- 58.Gurudutta GU, Verma YK, Singh VK, Gupta P, Raj HG, Sharma RK, Chandra R. Structural conservation of residues in BH1 and BH2 domains of Bcl-2 family proteins. FEBS Lett. 2005;579:3503–3507. doi: 10.1016/j.febslet.2005.05.015. [DOI] [PubMed] [Google Scholar]
- 59.Hess B, Kutzner C, van der Spoel D, Lindahl E. GROMACS 4: algorithms for Highly E_cient, Load-Balanced, and Scalable Molecular Simulation. J Chem Theory Comput. 2008;4:435–447. doi: 10.1021/ct700301q. [DOI] [PubMed] [Google Scholar]
- 60.Jorgensen WL, Tirado-Rives J. The OPLS potential functions for proteins, energy minimizations for crystals of cyclic peptides and crambin. J Am Chem Soc. 1998;110:1657–1666. doi: 10.1021/ja00214a001. [DOI] [PubMed] [Google Scholar]
- 61.Ferguson DM. Parametrization and evaluation of a flexible water model. J Comp Chem. 1995;16:501–511. [Google Scholar]
- 62.Hess B, Bekker H, Berendsen HJC, Fraaije JGEM. LINCS: a linear constraint solver for molecular simulations. J Comp Chem. 1997;18:1463–1472. [Google Scholar]
- 63.Ewald PP. Die Berechnung optischer und elektrostatischer Gitterpotentiale. Ann Phys. 1921;64:253–287. [Google Scholar]
- 64.Darden T, York D, Pedersen L. Particle mesh Ewald: an N-log(N) method for Ewald sums in large systems. J Chem Phys. 1993;98:10089–10092. [Google Scholar]
- 65.Essmann U, Perera L, Berkowitz ML, Darden T, Lee H, Pedersen LG. A smooth particle mesh ewald potential. J Chem Phys. 1995;103:8577–8592. [Google Scholar]
- 66.Nosé S. A molecular dynamics method for simulations in the canonical ensemble. Mol Phys. 1984;52:255–268. [Google Scholar]
- 67.Hoover WG. Canonical dynamics: equilibrium phase-space distributions. Phys Rev A. 1985;31:1695–1697. doi: 10.1103/physreva.31.1695. [DOI] [PubMed] [Google Scholar]
- 68.Parrinello M, Rahman A. Polymorphic transitions in single crystals: a new molecular dynamics method. J Appl Phys. 1981;52:7182–7190. [Google Scholar]
- 69.Nosé S, Klein ML. Constant pressure molecular dynamics for molecular systems. Mol Phys. 1983;50:1055–1076. [Google Scholar]
- 70.Kabsch W, Sander C. Dictionary of protein secondary structure: pattern recognition of hydrogen-bonded and geometrical features. Biopolymers. 1983;22:2577–2637. doi: 10.1002/bip.360221211. [DOI] [PubMed] [Google Scholar]
- 71.Humphrey W, Dalke A, Schulten K. VMD-visual molecular dynamics. J Mol Graphics. 1996;14:33–38. doi: 10.1016/0263-7855(96)00018-5. [DOI] [PubMed] [Google Scholar]
Associated Data
This section collects any data citations, data availability statements, or supplementary materials included in this article.