

Abstract
Despite widespread use of silk, it remains a significant challenge to fabricate fibers with properties similar to native silk. It has recently been recognized that the key to tuning silk fiber properties lies in controlling internal structure of assembled β-sheets. We report an advance in the precise control of silk fiber formation with control of properties via microfluidic solution spinning. We use an experimental approach combined with modeling to accurately predict and independently tune fiber properties including Young’s modulus and diameter to customize fibers. This is the first reported microfluidic approach capable of fabricating functional fibers with predictable properties and provides new insight into the structural transformations responsible for the unique properties of silk. Unlike bulk processes, our method facilitates the rapid and inexpensive fabrication of fibers from small volumes (50 μL) that can be characterized to investigate sequence-structure-property relationships to optimize recombinant silk technology to match and exceed natural silk properties.
Keywords: Microfluidics, silk fibroin, fibers, biomimetic
Introduction
The extraordinary properties of silk1-8 make it an attractive candidate for many versatile applications.9,10 Silk, with a Young’s modulus as high as 20 GPa, is as strong as steel but six times lighter,11 and is used as lightweight insulation and textiles. Additionally, silk is biocompatible9 and biodegradable,12 and is also used for medical sutures9 and tissue engineering scaffolds.9,13 In nature, silkworms and spiders produce silk to fabricate their cocoons and webs,11,14 and the fiber properties differ among species. While natural silk spinning suits these silkworm and spider applications, there are significant limitations, namely that the processing parameters cannot be externally controlled or altered and harvesting these products is both difficult and expensive. As a result, recent steps have been taken3,9,15,16 to synthetically produce silk fibers from regenerated13,14,17 and recombinant1,18-22,23 silk fibroin. Regenerated silk is derived from Bombyx mori cocoons and recombinant silk is produced via genetic engineering. Advances in recombinant silk technology allow for synthetic changes to be made to the primary silk sequence, providing the potential for optimization of the material for specific use in biomedicine.22 Despite these advances in silk technology there is no current synthetic fabrication technique that can replicate the unique properties of native silk.
Silk fabrication methods include electrospinning13,17 and wet-spinning,4,24,25 which often require the silk dope to be blended with other materials13 or involve harsh compounds such as lithium bromide and hexafluoroisopropanol (HFIP).5,10,15,25-28 These processes also utilize lengthy coagulation times ranging from 1 hr to overnight,4,10 while offering limited control over fiber properties or versatility in collection methods. Neither wet-spinning nor electrospinning can align silk fibroin molecules in a manner that is similar to native spinning4,17 or reproduce silk’s unique secondary structure,10,13,17,25 which is a significant drawback since it has recently been recognized that the key to the properties of silk lies within this secondary structure.5,6,10-12,14,29,30 Thus determining the structure-property relationships of silk fabricated in a reproducible manner would be a significant advancement in materials processing.10,31
There is also a need for a fabrication method that would enable rapid silk fiber fabrication to facilitate inexpensive and systematic screening of recombinant silk sequences. Recombinant silk has been produced by utilizing organisms ranging from E. coli32,23 to goats22 and offers the ability to alter the primary silk protein sequence. Changes to this sequence will result in the formation of different structures within the silk and thus different fiber properties which can be optimized for specific applications. However, it is difficult to manufacture large quantities of these silk solutions, and current silk processing techniques cannot facilitate rapid fiber production from small amounts of solution in order to investigate the sequence-structure-property relationships of the recombinant silk variants.
While natural silk processing is not fully understood,1,2,21,33,34 certain aspects have been well-characterized. Fiber formation is accompanied by the transition of a globular protein (silk I) to a fiber rich in highly ordered β-sheets arranged between globular regions (silk I and silk II).1,2,11,13,17,33-38 This combination of strong β-sheet networks between extensible globular regions forms the unique secondary structure of silk that gives rise to both its strength and toughness.1,2,9,12,38 In B. mori silkworms, the silk sol-gel transition is believed to be induced by the combination11 of the elongational flow caused by the decrease in the cross-sectional area of the lumen of the spinning gland1,31 which aligns the silk fibroin in the direction of the flow,2,16,17,35 as well as the significant drop in pH1,16,21 along the gland, which results in the protonation of certain side groups.1 Together, structure and chemistry promote the formation of strong hydrogen bonds.33 Given the nature of native silk spinning, microfluidics is an excellent choice to recreate this process in a controlled manner while requiring only small amounts of silk solution.
The current article describes the use of microfluidic fluid focusing techniques to fabricate silkworm fibroin fibers with predictable and controllable properties. Microfluidic approaches have been used to investigate the molecular transitions of silk fibroin during fiber formation,21,34 but have focused primarily on investigating silk molecular assembly and not on developing a microfluidic fiber fabrication method. This tunable fabrication process can customize fiber properties and broaden potential applications while providing novel insight into how processing factors are related to structural outcomes. Importantly, via the scaling involved, the process is also amenable to rapid or high throughput screening of processing variables related to fiber properties.
Experimental Section
Materials and Synthesis
Regenerated silk fibroin (RSF) aqueous solution of 8% w/v and pH 6.6 is prepared from Bombyx mori cocoons according to a previously published protocol.13 Poly(ethylene oxide) (PEO) aqueous solution of 3% w/v is prepared from 900,000 MW PEO (Sigma Aldrich, St. Louis, MO). Hydrochloric acid solution (1M) (Sigma Aldrich, St. Louis, MO) is added to adjust the pH of the PEO solution to 1.5. The microfluidic devices are fabricated from poly(dimethylsiloxane) (PDMS) (Sylgard 184, Dow Corning Corp., Midland, MI). Standard soft lithography is used to fabricate patterned relief structures on silicon wafers as molds for device production. A multilayer technique is used to produce the three-dimensional device structure. Briefly, each mold is composed of two aligned layers. The bottom is symmetric and contains all three inlets and one outlet. The top layer, however, only contains one inlet and one outlet, providing for a second tier that results in an asymmetric channel design (figure 1a). The PDMS is mixed in a 10:1 base to curing agent ratio, poured in to the silicon mold, degassed for 1 hr, and cured for 1 hr at 65°C. After being cleaned with ethanol (Sigma Aldrich, St. Louis, MO), two identical patterned PDMS pieces are aligned and sealed face to face to enclose the asymmetric microfluidic channel. To form this seal, the surfaces are treated in a plasma etcher (PDC-32G Plasma Cleaner/Sterilizer, Harrick Scientific, Ossining, NY) on medium RF level for 30 seconds. Each assembled channel is 400 μm wide. The silk inlet is 80 μm high, each PEO inlet is 155 μm high, and the outlet is 230 μm high. Polyethylene tubing (PE 50, Beckton, Dickinson and Company, Franklin Lakes, NJ) is attached at the three device inlets (Figure 1b). In preparation for use, the device is submerged in a methanol (Sigma Aldrich, St. Louis, MO) bath in a Petri dish.
Figure 1. Device Design and Fiber Fabrication.
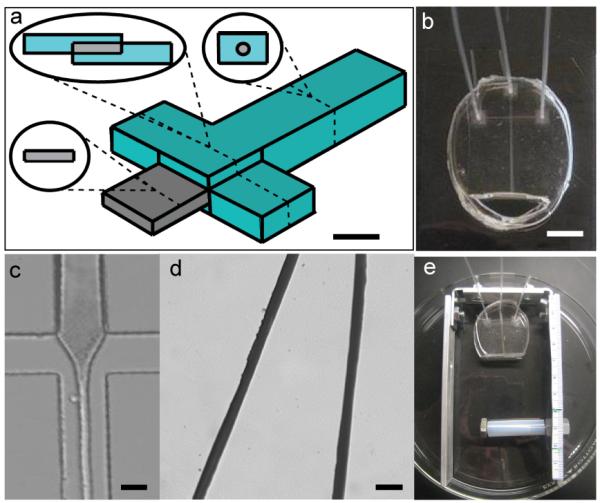
The microfluidic device is designed to mimic the silkworm silk gland. (a) Schematic of the channel with selected cross sections illustrates 3-D multilayer design (scale bar 400 μm). (b) The device, fabricated from poly(dimethylsiloxane) (PDMS), has three inlets (tubing attached for fluid transfer) and one outlet into a reservoir (scale bar 1 cm). (c) Flow in the device during use illustrates the hydrodynamic focusing of the silk solution stream at the cross intersection (scale bar 200 μm). (d) Regenerated silk fibroin (RSF) fibers fabricated in the device have smooth surfaces and consistent diameters (scale bar 100 μm). (e) A frame with an adjustable rod is used to aid in fiber collection.
Device Design and Flow Conditions
The microfluidic device presented here is designed to mimic certain aspects of natural silk processing in a controlled manner. The cross-shaped channel is fabricated from PDMS39 and consists of three inlets and one outlet (Figure 1b). Regenerated silk fibroin (RSF) aqueous solution from B. mori cocoons flows through the main (central) inlet, and reaches the cross intersection where it interacts with two outer streams of poly(ethylene oxide) (PEO) solution.34 Unlike basic microfluidic channels, the device is tiered in this area (Figure 1a). For traditional hydrodynamic focusing, a main solution stream is focused from either side by two outer streams. This tiered design facilitates focusing from all directions to prevent clogging due to adsorption of proteins to the channel walls and maximize the interface between the solutions. PEO is used for the outer streams at a concentration chosen to match the viscosity of the silk solution to avoid pearling instabilities that arise with the use of water or other lower viscosity solutions. Laminar flow dominates within the channel preventing any PEO diffusion into the fiber and residual PEO can easily be rinsed from the fiber surface. The PEO solution is of low pH compared to the silk, mimicking the pH drop found in B. mori silkworms.1 This pH drop initiates the structural transformations necessary for fiber formation. The interaction of the solutions at the cross region causes elongational flow,40,41 where the silk stream is hydrodynamically focused by the outer PEO solution streams (Figure 1c). This mimics the decrease in cross-section seen in the B. mori spinning gland, causing alignment of the globular fibroin protein and acting in conjunction with the pH drop to initiate the sol-gel transition. Structural transformations continue along the length of the outlet channel and the silk fibers exit into a surrounding methanol bath. This reservoir acts as a coagulation bath, further strengthening the associations formed between the silk fibroin molecules within the device. Any residual methanol on the fiber surface is removed by a washing step, and no harsh materials remain in the fiber. The result of this process is a smooth silk fiber with consistent cross section, as shown in Figure 1d. These fibers are stable in water and easy to handle and collect.
Modeling Flow and Fiber Fabrication
Fluid flow in the device is controlled by a customized servo motor controlled syringe pump designed at the Max Planck Institute for Dynamics and Self-Organization (Göttingen, Germany). We developed an estimate to describe and predict the flow behavior in the device based on changes in channel dimensions and input flow rates which predicts the width of the silk stream in the outlet (details in supporting information). Additional approximations are utilized to determine the effect of methanol treatment on the final fiber diameter. Fibers of various diameters are fabricated via silk-to-PEO flow rate ratios ranging from 0 to 1. Fibers are collected from the outlet, soaked in water to remove residual methanol or PEO, and allowed to dry. The diameter of the dry fibers is measured from bright field images. Each fiber is then exposed to water for 10 min, and the wet fiber diameter is measured.
To produce drawn fibers, the silk and PEO solutions are maintained at control channel speeds of 0.22 mm/s and 0.62 mm/s, respectively. Fibers exit the device outlet and pass through a methanol reservoir under a freely rotating Teflon rod and exit the reservoir vertically into the air for collection by a motorized stage. A custom frame with an adjustable rod is used to hold the device in place and maintain the duration of methanol treatment at 30 seconds regardless of flow rates or drawing speed (Figure 1e). Undrawn fibers are collected with the motorized stage moving vertically at the same speed at which the fibers exit the channel (0.89 mm/s, calculated from input flow rates and channel dimensions). Drawn fibers are collected three times as fast as they are fabricated and exit the channel. To ensure uniform methanol treatment, the distance between the outlet and rod is tripled for drawn fibers compared to undrawn fibers. All fibers are stored in water for at least 24 hr prior to use or characterization. Bright-field images of fibers and flow are acquired with an Axiovert S25 inverted microscope (Carl Zeiss, Inc., Thornwood, NY).
Mechanical Characterization
Mechanical testing is carried out with an Instron 5848 Microtester (Instron, Norwood, MA) with a 5N load cell in a protocol adapted from Perez-Rigueiro et al.42 Single fibers are mounted by attaching both ends of the fiber to a paper frame with epoxy to provide stability during handling. Once loaded, the frame is cut to remove its support and the fiber is extended at a strain rate of 0.01 s−1 until failure. Force and extension measurements are taken throughout testing. Initial sample length is used to calculate strain. Initial cross-sectional area (measured from bright field images of the fibers) is used to calculate engineered stress. Mechanical properties are calculated from the resulting stress-strain plot. Failure stress and failure strain are defined as the maximum stress value reached prior to failure and the strain value at failure, respectively. Young’s modulus is calculated by fitting a straight line to the linear elastic region of the stress-strain plot and determining its slope. Native Bombyx mori fibers (kindly provided by M. Tsukada, Institute of Sericulture, Tsukuba, Japan) are first characterized to validate the chosen testing techniques, and then RSF fibers are tested.
Fourier Transform Infrared (FTIR) Spectroscopy
FTIR is used to characterize silk secondary structure. The PEO solution is dried into thin films for this analysis. RSF silk is analyzed in aqueous solution form. Native and RSF fibers are bundled into small flat pellets for analysis. Absorbance spectra from 4000-400 cm−1 are acquired with a JASCO FTIR 6200 spectrometer (JASCO, Toyko, Japan) and 256 scans are averaged for each sample, with overall resolution of 4 cm−1. A background spectrum is collected prior to each sample spectrum. Emphasis is placed on the amide-I band (1720-1580 cm−1) which has been well-studied for silk fibroin and is indicative of secondary protein structure. Fourier self deconvolution (FSD) is performed by a method adapted from Hu et al.38. Briefly, a linear baseline is subtracted from the region of interest and a nine-point smoothing filter is applied. FSD is performed with the Happ-Genzel apodization scheme, a bandwidth of 25 cm−1 and an enhancement factor of 3.0. Gaussian shape profiles are fit to the baseline corrected deconvoluted spectra using floating parameters. In each case, the spectrum is processed so that the resolved peaks align with the minima of the second derivative, a widely accepted criterion for appropriate deconvolution.29,38,43 Peak assignments are made according to Hu et al.(38) and in agreement with other published results.(39,42) To estimate total β-sheet content, the area of β-sheet peaks is normalized by total band area. Parameter variation has little effect on total β-sheet content values.
Wide Angle X-ray Scattering (WAXS)
WAXS experiments of the silk fibers are performed using a Bruker AXS Nanostar (Karlsruhe, Germany). Both native B. mori and RSF fibers are dried and mounted with kapton tape. The WAXS instrument accommodates a q-range from 1 to 33 nm−1. The setup includes a rotating anode x-ray source for CuKα radiation (wavelength λ=0.154 nm) at a generator power of 4.05 kW and a virtually noise-free, real-time 2D Hi-Star detector with photon counting ability. All 2D detector images are taken at ambient temperatures with exposure times of 7200 seconds per sample and azimuthally averaged using Fit2D software to produce 1D intensity profiles.
Results and Discussion
An inherent advantage of microfluidics is the flexibility it provides for controlled flow in the device allowing for the optimization of processing parameters as well as tuning of fiber properties such as diameter. Variation of the flow speeds in the channel allows for control of fiber diameter based on the fluid hydrodynamics in the elongational flow region within the channel. The degree of focusing of the silk solution stream is highly dependent on the relative silk and PEO solution flow rates. For an estimate of the silk solution stream diameter, the flow in the main channel is approximated by a parabolic profile and the channel is approximated as cylindrical, giving the diameter of the silk stream in the outlet, d,
| (1) |
where Vsilk is the volumetric flow rate at the silk inlet, Voutlet is the volumetric flow rate at the outlet, and Qoutlet is the cross-sectional area of the outlet. Details of this derivation can be found in supporting information.
The resulting predictions for the silk stream width in the main channel outlet match very well with experimental data for various silk/PEO flow rate ratios between 0 and 1 (Figure 2). Note that the solid line is not a fit but is directly derived from equation (1). This prediction demonstrates the broad range of fiber diameters that can be easily fabricated in the same device by varying the input flow rates.
Figure 2. Prediction of Silk Stream Diameter.

The prediction of the silk stream diameter, based on flow behavior in the device, is dependent on the relative flow rates of the incoming silk and PEO solution streams. The solid line represents diameter prediction and points show observed diameters. Experimental measurements match well with predictions as shown. Error bars show standard error.
As the fiber passes through the methanol reservoir, the treatment strengthens the fibers and causes additional dehydration, resulting in a decrease in cross-sectional area. The addition of a hydrophilic alcohol causes the molecular chains of the silk fibroin to quickly and strongly interact with one another.14 Silk dehydration in methanol increases nonlinearly with time to a plateau region, and has been studied previously for other forms of silk,15,36 including thin films.24 The time dependence of diameter reduction was quantified for this system (data not shown) and the length of methanol treatment used (30 seconds) is within the plateau region where maximum coagulation occurs. Regardless of the flow rate ratio, the dry fiber diameter is approximately 32% of the predicted silk stream diameter. Additionally, when dry fibers are exposed to water again, they swell by 36% of their dry diameter. Interestingly, this reduction and swelling does not depend on initial silk stream diameter. Using a 400 μm wide channel, fibers ranging from 20 to 45 μm were easily fabricated by varying silk and PEO flow rates. Additional variations of flow rates or alternative device dimensions can be used to broaden this range.
Equation (1) predicts the pre-methanol diameter for a given set of device dimensions and input flow rates, and diameter reduction from methanol exposure is considered in conjunction with these predictions to calculate the final fiber diameter for either dry or wet applications. Working backwards, the flow parameters necessary to fabricate a fiber with a carefully controlled diameter can be easily determined. This fabrication method is advantageous because fibers of different diameters can be fabricated from the same device without any additional equipment or set-up time. Also, a fiber could be tailored with a gradient or other variation of diameter along its length for unique applications.
Fiber diameter can also be tuned by post-spin drawing which is used for many other materials and has been shown to alter resulting mechanical properties. Inspired by an integral step in many forms of spider silk spinning,44 an optional drawing step is used to strengthen the fibers, while also reducing their diameters. To investigate the effects of varying flow rates and fiber drawing on silk properties and structure, a 400 μm wide channel is used to fabricate fibers of constant diameter. Flow rates were varied to control the diameter in the range of 20 to 45 μm. Drawn fibers were fabricated with control flow velocities of vsilk = 0.22 mm/s and vPEO = 0.62 mm/s, chosen from within the range previously investigated, and collected three times as fast as undrawn fibers as described in the experimental section. Drawing results in diameters as small as 10 μm which is on par with native silk. The qualitative differences in mechanical behavior can be seen from representative stress-strain plots for undrawn RSF fibers, drawn RSF fibers and native fibers (Figure 3 a-c). Note the different y-axis scales. The native fiber illustrates typical silk behavior with an initial elastic region, a deformation region, and finally an uncoiling region prior to failure. The uncoiling region is also seen in drawn fibers but is missing from undrawn fibers.
Figure 3. Mechanical Characterization of RSF Fibers.

Representative stress-strain plots are shown for undrawn RSF fibers (a), drawn RSF fibers (b), and native silk fibers (c). Young’s modulus (d), failure stress (e) and failure strain (f) are calculated from these plots and grouped by fiber diameter for undrawn, variable flow rate RSF fibers (black boxes) and drawn RSF fibers (white boxes). N=3; Error bars show standard error.
Mechanical characterization of the silk fibers illustrates the range of potential properties that can be achieved. Single fiber uniaxial tensile testing of native B. mori silk shows a Young’s modulus of 13 GPa, failure stress of 590 MPa, failure strain of 11% and average as-spun diameter of 12 μm. These results fit well within the range of previously reported values,9,12,17,24,42 thus validating the chosen testing technique. The regenerated silk fibroin (RSF) fibers fabricated in this device are easy to handle, but they are not as strong as their native counterparts. The results of mechanical testing are summarized in Figure 3 d-f. Fibers are grouped by diameter with drawn fibers represented by black boxes and undrawn fibers from various flow rates represented by white boxes. Each 5 μm grouping has minimum N=3 and error bars represent standard error.
Figure 3 illustrates the reproducibility of mechanical properties for fibers between 20 and 45 μm in diameter. Mechanical properties including Young’s modulus, failure stress and failure strain remain fairly constant across various flow rate ratios. Thus this fabrication technique allows us to decouple properties and diameter for independent variable control.
Drawing the RSF fibers leads to a significant and expected increase in Young’s modulus24 along with a decrease in diameter, and brings both values closer to those for native B. mori fibers. Drawing also increases the failure strain to match or exceed that of native silk. This can be attributed to the large uncoiling region that partially mimics the mechanical behavior of native silk and is not present for undrawn fibers. This may be due to the uncoiling of intra-molecular β-sheets that plays a large role in natural silk, especially in the strain hardening of spider silks.45 Undrawn and drawn fibers can be viewed as both extremes of a spectrum of potential properties, presenting a broad range of possible Young’s moduli, failure stresses, and failure strains that can be tuned for tailored applications. Additionally the ability to tune properties and diameter independently is an important advantage of this fabrication system, allowing for precise single-variable control.
Despite these property changes due to fiber drawing, the RSF fibers still do not rival native silk properties. The fundamental step in natural silk fiber formation is the transformation of the protein solution into the β-sheet rich secondary structure responsible for the unique properties of silk. Therefore, we are interested in comparing the secondary structure and organization of our fibers with native silk, particularly β-sheet content and alignment; we use Fourier transform infrared spectroscopy (FTIR) and wide angle x-ray scattering (WAXS) to investigate the secondary structure of the RSF fibers fabricated with our device.
Silk fibroin is composed of a long repetitive chain of amino acids with many amide bonds11,12,36,38 and FTIR absorption spectra illustrate the organization of these bonds in avariety of secondary structures (i.e., α-helix, β-sheet).24,43 The amide-I band of the FTIR spectra (from 1720 to 1580 cm−1) contains numerous overlapping absorbance peaks, each corresponding to a specific secondary structure.15,29,46 There is a shift in the composite amide-I peak for native and both drawn and undrawn RSF fibers to lower wavenumbers compared to 8% w/v RSF solution, which is indicative of an increase in β-sheet content within the fibers (Figure 4a). Interestingly, the overall shape of the peak for drawn fibers is different from that of native and undrawn fibers. This characteristic shape indicates that while there is a significant β-sheet content in the sample, there is also a large contribution to the signal from silk-I conformations. Silk I, a hydrated type II β-turn structure, is the key intermediate structure for forming mechanically robust natural silk fibers.47
Figure 4. Structural Characterization of Silk Fibers via Fourier Transform Infrared Spectroscopy (FTIR).

FTIR spectra for 8% RSF solution, undrawn RSF fibers, drawn RSF fibers and native B. mori fibers illustrate the secondary structures present. (a) The shift of the peak of the amide I band (1580 to 1720 cm−1) to lower wavenumbers indicates higher β-sheet content in both native and RSF fibers compared to 8% RSF solution. The characteristic shape of the drawn RSF fibers indicates silk I content that is absent from undrawn fibers. (b) Full FTIR spectrum for PEO film. (c) Full FTIR spectra for undrawn and drawn RSF fibers and native silk illustrate that PEO is not present in any of the fibers.
Fourier self deconvolution (FSD) results further clarify the structural differences by resolving the component peaks for each structure type within the band.29,38,46 Variation of the parameters of the FSD (including bandwidth and enhancement factor) further validates these findings. The assignment of each peak to its corresponding structure type are based on previous work.38,48 Because the area of each peak is proportional to the amount of that structure in the sample, normalized area provides a direct measure of structural content.48 The native fibers are found to be 54% β-sheets, which matches well with previous work.13,36 FTIR measurements show of 8% RSF solution contains 20% β-sheets. Additionally, the β-sheet content for all undrawn fibers remains approximately 49% with no significant differences between flow rates, indicating similar internal structure for fibers of various sizes. This large increase from the 8% solution confirms the formation of ordered structures within the device and methanol bath. Methanol coagulation alone cannot cause the formation of the silk-II β-sheet structure,37 but rather acts in conjunction with assembly within the device and further strengthens the β-sheet structures. FTIR experiments confirm the transition from silk solution to β-sheet-rich structure in the undrawn RSF fibers, which contain almost as many β-sheet structures as B. mori fibers.
Interestingly, drawn RSF fibers contain 42% β-sheets, slightly less than their undrawn and native counterparts. It should be noted that the fibers are drawn as they are fabricated, and the lower β-sheet content does not necessarily indicate that β-sheets are formed and then disrupted via drawing. This is likely due to the inclusion of the silk I structural elements which are present in these fibers and act in conjunction with the β-sheets to provide the increased failure stress and failure strain seen in mechanical testing. Previously published work has shown that water has a significant influence on the formation of silk I structure47 and we believe drawing the fibers in the wet stage is a fundamental aspect of achieving this structure combination and could be further utilized to optimized mechanical properties.
The 3% w/v PEO solution was chosen for the outer stream solution to meet certain design criteria, including to match the viscosity of the silk solution to simplify the flow in the device and also because it is inexpensive, readily available, and its pH can be easily altered. Unlike seracin, the material used by B. mori silkworms to spin their fibers that has been implicated in unfavorable immune responses,49 PEO is a biocompatible material so it is an excellent choice for fabricating materials that may be used in vivo. While the presence of PEO would not be harmful, it may affect mechanical and surface properties and steps were taken to ensure that PEO was not present in the final fibers. Laminar flow dominates within the microfluidic channel, preventing the diffusion of the large molecule into the silk stream. Additionally, a washing step is including in the fabrication process to remove any residual PEO from the fiber surface. To demonstrate the absence of PEO in our fibers, full FTIR spectra are shown in Figure 4. The spectrum for our PEO solution shown in Figure 4b matches the well characterized and previously published PEO spectrum, with dominant peaks at 2900 cm−1, 1460 cm−1, 1104 cm−1 and 850 cm−1.50,51 Figure 4c shows full FTIR spectra for undrawn RSF, drawn RSF and native silk fibers. The characteristic PEO peaks are not present and there are only slight differences between the three spectra due to the differences in the secondary structure and organization of the silk fibroin, not due to the presence of PEO.
To augment these FTIR results, wide angle x-ray scattering (WAXS) was used to investigate the organization of the secondary elements within the fiber which can significantly affect the mechanical properties. The WAXS results further reveal the secondary structures present and their organization within native and RSF fibers. The WAXS profiles for native, undrawn and drawn RSF fibers produced in microfluidic devices are similar, with the predominant peaks for all three types of fibers found at q=14.5 nm−1 and q=17.25 nm−1 (Figure 5a-c). WAXS profiles can be used to determine the characteristic distances in ordered materials. This spacing is different for each type of secondary structure found in silk, and various d-spacing values have been attributed to the common structures in silk-I (α-helices, random coils and globular proteins) and silk-II (rich in highly ordered β-sheets) conformations. The peaks present at q=14.5 nm−1 and q=17.25 nm−1 correspond to d-spacing values of 0.36 nm and 0.43 nm, respectively. Both of these values have been attributed to β-sheet content and silk-II conformations2,4,14,36,37 and are inherent to native silk fibers. These results complement the FTIR findings and further validate that the predominance of silk II structure within all three fiber types.
Figure 5. Structural Characterization of Silk Fibers via Wide Angle X-ray Scattering (WAXS).

WAXS profiles for undrawn RSF fibers (a), drawn RSF fibers (b) and native Bombyx mori silk fibers (c) are very similar, with both main peaks at q=14.5 nm−1 and q=17.25 nm−1 corresponding to large β-sheet content. Intensity plots (q=14.5 nm−1) vs. the azimuthal angle for undrawn RSF fibers (d), drawn RSF fibers (e) and native Bombyx mori silk fibers (f) illustrate differences in fiber orientation that are partially responsible for different mechanical properties. 2D diffraction patterns for each sample type are shown in (g-i).
WAXS also provides information about the alignment of elements within the fiber. The peak intensity at q=14.5 nm−1 of the 2D x-ray patterns is plotted versus the azimuthal angle to illustrate β-sheet orientation. A fiber lacking preferential orientation will have isotropic intensity in all directions and the plot of intensity vs. azimuthal angle will be relatively constant. However, an aligned fiber will have peaks in the intensity vs. azimuthal angle plot that indicate the direction of orientation within the fiber. Alignment along the fiber axis will result in intensity peaks 180° from each other. Figure 5d-f shows intensity profiles for the dominant silk-II peak for undrawn RSF, drawn RSF and native fibers. Undrawn fibers show no β-sheet alignment, whereas drawn fibers show some alignment in the direction of the fiber drawing. Native fibers also have a large degree of alignment along the fiber axis. These results suggest that alignment of β-sheets within the fiber is responsible for the enhanced strength of drawn fibers, but this alignment is not as strongly oriented as in native fibers, and these structural differences contribute to the remaining disparities in the properties of the two fiber types. The effects of drawing can be attributed in part to additional alignment of fibroin molecules along the fiber axis.10,12,22,24 Overall, slight differences in structural content that arise from drawing fibers in the wet-state, including the presence of silk-I structure, contribute to enhanced failure strain of drawn RSF fibers and alignment of β-sheet crystals is induced during drawing enhancing the failure stress of these fibers.
Conclusions
The microfluidic fabrication technique presented here offers control over processing parameters, while also providing versatility for fiber customization. The diameter of the fibers produced depends on the dimensions of the channel and the extent of hydrodynamic focusing at the microfluidic device cross region. Additionally, the fiber can be drawn to alter mechanical properties and increase Young’s modulus.24 Fibers for different applications require unique properties such as failure strength, failure strain and Young’s modulus. For example, fibers with load bearing functions will need to withstand high stresses without failure; fibers for applications such as components within a synthetic blood vessel under pulsatile flow will need to be highly extensible; and fibers for tissue engineering scaffold fabrication require a specific Young’s modulus for the appropriate cellular response.52 Fiber diameter will also affect cellular response in tissue engineering applications and may be critical for other uses, including textiles.
Simple changes in the processing parameters allow for the straightforward customization of fiber diameter, while a variable drawing process can tune the fiber mechanical properties across a range from low density polyethylene and poly(tetrafluoroethylene)53 up to values close to native silk. These fibers can be easily collected with a variety of methods to facilitate the fabrication of two- and three-dimensional constructs for applications from tissue engineering scaffolds to low weight insulation. The ability to tune diameter and modulus across a large range also enables the independent variation of these parameters. Additionally, by varying the flow rates in the channel, fibers of many different diameters can be fabricated from the same device without any additional equipment or set-up time. Very long continuous fibers can be fabricated with varying diameters along their lengths to create diameter gradients or other patterns for tailored material applications.
The fundamental step in native silk fiber fabrication is the transformation of globular silk solution to a highly organized structure that is rich in β-sheets between amorphous regions. Current processing techniques cannot rival native silk properties because without a complete understanding of how natural silk spinning occurs it is impossible to replicate this unique structure. Silk I is known to be the key intermediate structure for forming mechanically robust natural fibers47 and we have identified a process capable of inducing this structure, along with the important β-sheet content, in a controlled and versatile silk fabrication system. This method provides an important step towards mimicking native silk structure and with the addition of the proper follow up processing it may be possible to complete the process of transforming the silk solution to the native fiber structure by way of this wet-drawn RSF intermediate material. While we still have not matched native properties, we have gained a much clearer picture of the structural transformations occurring in the silk fiber and we can use this insight to relate processing, structure and properties to move forward towards achieving this goal.
Additionally, the small volumes required for this spinning process make it a useful tool for the investigation of the fiber forming capabilities of various recombinant silk sequences in the future. Fibers can easily be fabricated from as little as 50 μL of aqueous silk solution and fully characterized mechanically and structurally as described, making this system a potential, complete and inexpensive screening tool for synthetic silk engineering. The technique eliminates the need to produce bulk quantities of each potential sequence, greatly reducing the cost and time required to investigate recombinant sequences and facilitating the understanding of how varying the sequence will affect the structure and the resulting properties. These sequence-structure-property relationships can be utilized to determine the slight changes in the protein sequence necessary to redirect silk assembly to more closely mimic or even exceed the properties of native silk.
This microfluidic device is not limited to fiber fabrication, and can also provide a means to investigate conformational changes in numerous biopolymers of interest, including collagen and elastin. The optical transparency of the PDMS surfaces allows the investigation of processes occurring within the channel by various techniques such as polarized light microscopy.38,41 Additionally, PDMS channels fabricated with Kapton covers are ideal for the real-time study of fibrillogenesis using synchrotron microfocused beams at various positions within the channel to monitor structural transitions.40,54 Such studies would further clarify silk fibroin and other protein molecular transitions.
Supplementary Material
Acknowledgements
This work was supported by NIH R01 HL72900 (JYW), NIH P41 Tissue Engineering Resource Center EB002520 (DLK), AFOSR (DLK), DFG PF 375/2, SNF 206021_128747, Max Planck Society (TP), the Alexander von Humboldt Foundation (HME) and the NSF Graduate Research Fellowship Program (MEK).
Thanks to the Wong Lab and to the Kaplan lab, including Carmen Preda and Xianyan Wang. Thanks to Costas Karatzas for his helpful advice and discussions. We also thank Udo Krafft for his excellent technical assistance, and the Boston University Biointerface Core Facility and Whitaker Microfabrication Center.
Footnotes
Supporting Information Available. The complete derivation of the equation developed to predict silk stream diameter within the device is available. This material is available free of charge via the internet at http://pubs.acs.org.
References
- (1).Po Foo C. Wong, Bini E, Hensman J, Knight DP, Lewis RV, Kaplan DL. Appl. Phys. A: Mater. Sci. Process. 2006;82:223–233. [Google Scholar]
- (2).Jin HJ, Kaplan DL. Nature. 2003;424:1057–1061. doi: 10.1038/nature01809. [DOI] [PubMed] [Google Scholar]
- (3).Guanqiang Z, Xin C, Zhengzhong S. Huaxue Jinzhan. 2006;18:933–938. [Google Scholar]
- (4).Phillips DM, Drummy LF, Naik RR, De Long HC, Fox DM, Trulove PC, Mantz RA. J. Mater. Chem. 2005;15:4206–4208. [Google Scholar]
- (5).Zhu ZH, Ohgo K, Asakura T. eXPRESS Polym. Lett. 2008;2:885–889. [Google Scholar]
- (6).Glisovic A, Vehoff T, Davies RJ, Salditt T. Macromolecules. 2008;41:390–398. [Google Scholar]
- (7).Schafer A, Vehoff T, Glisovic A, Salditt T. Eur. Biophys. J. 2008;37:197–204. doi: 10.1007/s00249-007-0216-5. [DOI] [PubMed] [Google Scholar]
- (8).Gosline JM, DeMont ME, Denn MW. Endeavour. 1986;10:37–43. [Google Scholar]
- (9).Altman GH, Diaz F, Jakuba C, Calabro T, Horan RL, Chen J, Lu H, Richmond J, Kaplan DL. Biomaterials. 2003;24:401–416. doi: 10.1016/s0142-9612(02)00353-8. [DOI] [PubMed] [Google Scholar]
- (10).Seidel A, Liivak O, Calve S, Adaska J, Ji G, Yang Z, Grubb D, Zax DB, Jelinski LW. Macromolecules. 2000;33:775–780. [Google Scholar]
- (11).Vollrath F, Knight DP. Nature. 2001;410:541–548. doi: 10.1038/35069000. [DOI] [PubMed] [Google Scholar]
- (12).Jelinski L. Curr. Opin. Solid State Mater. Sci. 1998;3:237–245. [Google Scholar]
- (13).Jin HJ, Fridrikh SV, Rutledge GC, Kaplan DL. Biomacromolecules. 2002;3:1233–1239. doi: 10.1021/bm025581u. [DOI] [PubMed] [Google Scholar]
- (14).Nam J, Park YH. J. Appl. Polym. Sci. 2001;81:3008–3021. [Google Scholar]
- (15).Zuo B, Leigen L, Zhengyu W. J. Appl. Polym. Sci. 2007;106:53–59. [Google Scholar]
- (16).Holland C, Terry AE, Porter D, Vollrath F. Polymer. 2007;48:3388–3392. [Google Scholar]
- (17).Wang M, Jin H-J, Kaplan DL, Rutledge GC. Macromolecules. 2004;37:6856–6864. [Google Scholar]
- (18).Prince JT, McGrath KP, DiGirolamo CM, Kaplan DL. Biochemistry. 1995;34:10879–10885. doi: 10.1021/bi00034a022. [DOI] [PubMed] [Google Scholar]
- (19).Winkler S, Kaplan DL. J. Biotechnol. 2000;74:85–93. doi: 10.1016/s1389-0352(00)00005-2. [DOI] [PubMed] [Google Scholar]
- (20).Guerette PA, Ginzinger DG, Weber BH, Gosline JM. Science. 1996;272:112–115. doi: 10.1126/science.272.5258.112. [DOI] [PubMed] [Google Scholar]
- (21).Rammensee S, Slotta U, Scheibel T, Bausch AR. Proc. Natl. Acad. Sci. USA. 2008;105:6590–6595. doi: 10.1073/pnas.0709246105. [DOI] [PMC free article] [PubMed] [Google Scholar]
- (22).Lazaris A, Arcidiacono S, Huang Y, Zhou JF, Duguay F, Chretien N, Welsh EA, Soares JW, Karatzas CN. Science. 2002;295:472–476. doi: 10.1126/science.1065780. [DOI] [PubMed] [Google Scholar]
- (23).Stark M, Grip S, Rising A, Hedhammar M, Engström W, Göran H, Johansson J. Biomacromolecules. 2007;8:1695–1701. doi: 10.1021/bm070049y. [DOI] [PubMed] [Google Scholar]
- (24).Matsumoto K, Uejima H, Iwasaki T, Sano Y, Sumino H. J. Appl. Polym. Sci. 1996;60:503–511. [Google Scholar]
- (25).Liivak O, Blye A, Shah N, Jelinski LW. Macromolecules. 1998;31:2947–2951. [Google Scholar]
- (26).Min BM, Lee G, Kim SH, Nam YS, Lee TS, Park WH. Biomaterials. 2004;25:1289–1297. doi: 10.1016/j.biomaterials.2003.08.045. [DOI] [PubMed] [Google Scholar]
- (27).Zarkoob S, Eby RK, Reneker DH, Hudson SD, Ertley D, Adams WW. Polymer. 2004;45:3973–3977. [Google Scholar]
- (28).Sukigara S, Ganghi M, Ayutsede J, Micklus M, Ko F. Polymer. 2003;44:5721–5727. [Google Scholar]
- (29).Byler DM, Susi H. Biopolymers. 1986;25:469–487. doi: 10.1002/bip.360250307. [DOI] [PubMed] [Google Scholar]
- (30).Termonia Y. Macromolecules. 1994;27:7378–7381. [Google Scholar]
- (31).Asakura T, Yao J, Yang M, Zhu Z, Hirose H. Polymer. 2007;48:2064–2070. [Google Scholar]
- (32).Winkler S, Szela S, Avtges P, Valluzzi R, Kirschner DA, Kaplan D. Int. J. Biol. Macromol. 1999;24:265–270. doi: 10.1016/s0141-8130(98)00088-9. [DOI] [PubMed] [Google Scholar]
- (33).Li G, Zhou P, Shao Z, Xie X, Chen X, Wang H, Chunyu L, Yu T. Eur. J. Biochem. 2001;268:6600–6606. doi: 10.1046/j.0014-2956.2001.02614.x. [DOI] [PubMed] [Google Scholar]
- (34).Martel A, Burghammer M, Davies RJ, Di Cola E, Vendrely C, Riekel C. J. Am. Chem. Soc. 2008;130:17070–17074. doi: 10.1021/ja806654t. [DOI] [PubMed] [Google Scholar]
- (35).Trabbic KA, Yager P. Macromolecules. 1998;31:462–471. [Google Scholar]
- (36).Sashina ES, Bochek AM, Novoselov NP, Kirichenko DA. Russ. J. Appl. Chem. 2006;79:869–876. [Google Scholar]
- (37).Rossle M, Panine P, Urban VS, Riekel C. Biopolymers. 2004;74:316–327. doi: 10.1002/bip.20083. [DOI] [PubMed] [Google Scholar]
- (38).Hu X, Kaplan D, Cebe P. Macromolecules. 2006;39:6161–6170. [Google Scholar]
- (39).McDonald JC, Whitesides GM. Acc. Chem. Res. 2002;35:491–499. doi: 10.1021/ar010110q. [DOI] [PubMed] [Google Scholar]
- (40).Köster S, Evans HM, Wong JY, Pfohl T. Biomacromolecules. 2008;9:199–207. doi: 10.1021/bm700973t. [DOI] [PMC free article] [PubMed] [Google Scholar]
- (41).Köster S, Leach JB, Struth B, Pfohl T, Wong JY. Langmuir. 2007;23:357–359. doi: 10.1021/la062473a. [DOI] [PubMed] [Google Scholar]
- (42).Perez-Rigueiro J, Viney C, Llorca J, Elices M. J. Appl. Polym. Sci. 1998;70:2439–2447. [Google Scholar]
- (43).Jung C. J. Mol. Recognit. 2000;13:325–351. doi: 10.1002/1099-1352(200011/12)13:6<325::AID-JMR507>3.0.CO;2-C. [DOI] [PubMed] [Google Scholar]
- (44).Vollrath F, Knight DP. Int. J. Biol. Macromol. 1999;24:243–249. doi: 10.1016/s0141-8130(98)00095-6. [DOI] [PubMed] [Google Scholar]
- (45).Du N, Yang Z, Liu X, Li Y, Xu HY. Adv. Funct. Mater. 2011;21:772–778. [Google Scholar]
- (46).Surewicz WK, Mantsch HH, Chapman D. Biochemistry. 1993;32:389–394. doi: 10.1021/bi00053a001. [DOI] [PubMed] [Google Scholar]
- (47).Lu Q, Hu X, Wang X, Kluge JA, Lu S, Cebe P, Kaplan DL. Acta Biomater. 2010;6:1380–1387. doi: 10.1016/j.actbio.2009.10.041. [DOI] [PMC free article] [PubMed] [Google Scholar]
- (48).Wilson D, Valluzzi R, Kaplan D. Biophys. J. 2000;78:2690–2701. doi: 10.1016/S0006-3495(00)76813-5. [DOI] [PMC free article] [PubMed] [Google Scholar]
- (49).Panilaitis B, Altman GH, Chen J, Jin H-J, Karageorgiou V, Kaplan DL. Biomaterials. 2003;24:3079–3085. doi: 10.1016/s0142-9612(03)00158-3. [DOI] [PubMed] [Google Scholar]
- (50).Wen SJ, Richardson TJ, Ghantous DI, Striebel KA, Ross PN, Cairns EJ. J. Electroanal. Chem. 1996;408:113–118. [Google Scholar]
- (51).Yoshihara T, Tadokoro H, Mukahashi S. J. Chem. Phys. 1964;41:2902–2911. [Google Scholar]
- (52).Discher DE, Janmey P, Wang YL. Science. 2005;310:1139–1143. doi: 10.1126/science.1116995. [DOI] [PubMed] [Google Scholar]
- (53).Ratner BD, Hoffman AS, Schoen FJ, Lemons JE. Biomaterials Science. 2nd ed Elsevier Academic Press; San Diego, CA: 2004. [Google Scholar]
- (54).Dootz R, Evans H, Köster S, Pfohl T. Small. 2007;3:96–100. doi: 10.1002/smll.200600288. [DOI] [PubMed] [Google Scholar]
Associated Data
This section collects any data citations, data availability statements, or supplementary materials included in this article.