

Abstract
APOBEC3G is a single-stranded DNA cytosine deaminase that comprises part of the innate immune response to viruses and transposons. Although APOBEC3G is the prototype for understanding the larger mammalian polynucleotide deaminase family, no specific chemical inhibitors exist to modulate its activity. High-throughput screening identified 34 compounds that inhibit APOBEC3G catalytic activity. 20/34 small molecules contained catechol moieties, which are known to be sulfhydryl reactive following oxidation to the orthoquinone. Located proximal to the active site, C321 was identified as the binding site for the inhibitors by a combination of mutational screening, structural analysis, and mass spectrometry. Bulkier substitutions C321-to-L, F, Y, or W mimicked chemical inhibition. A strong specificity for APOBEC3G was evident, as most compounds failed to inhibit the related APOBEC3A enzyme or the unrelated enzymes E. coli uracil DNA glycosylase, HIV-1 RNase H, or HIV-1 integrase. Partial, but not complete, sensitivity could be conferred to APOBEC3A by introducing the entire C321 loop from APOBEC3G. Thus, a structural model is presented in which the mechanism of inhibition is both specific and competitive, by binding a pocket adjacent to the APOBEC3G active site, reacting with C321, and blocking access substrate DNA cytosines.
Apobec3g (apolipoprotein B mRNA editing enzyme, catalytic polypeptide-like 3G; A3G) is a single-strand (ss)DNA cytosine to uracil (C-to-U) deaminase, which belongs to a larger family of polynucleotide DNA and RNA editing enzymes with a variety adaptive and innate immune functions [recent reviews (1-3)]. A3G has become the prototype for understanding the retrovirus and retrotransposon restriction activity of several family members, in large part because it potently inhibits Vif-deficient HIV-1 replication. Current working models posit that A3G packages into assembling viral particles through a RNA-Gag interaction, travels with the particle until a new target cell becomes infected, and then interferes with viral cDNA synthesis by deamination-independent mechanisms (4) (likely by binding viral genomic RNA and impeding reverse transcriptase progression) and deamination-dependent mechanisms (5-7). The hallmark of A3G restriction is minus strand ssDNA C-to-U deamination events that become immortalized as plus (genomic) strand G-to-A hypermutations. The predominant means by which HIV-1 can replicate in A3G-expressing cells is by expressing its accessory protein Vif, a natural antagonist of A3G that recruits an E3-ubiquitin ligation complex to promote A3G degradation (8). The host-pathogen conflict between APOBEC3s and Vif is not specific to HIV-1, as strong evidence supports its existence in every other mammal that is infected with a HIV-related lentivirus [e.g., many types of non-human primates, carnivores such as cats, and agricultural animals such as sheep and cattle (9-12)].
A3G is also the prototype for polynucleotide cytosine deaminase structure-function studies, because it is the only catalytically active family member to yield high resolution NMR and crystal structures (13-17) (and this study). A3G is a two-domain deaminase, with the first half of the protein comprising the pseudo-catalytic domain (residues 1-196) and the second half of the protein making-up the catalytic domain (residues 197-384), despite the fact that both domains have conserved catalytic and zinc-coordinating residues (H-X-E-X23-28-C-X2/4-C where X can be nearly any residue)(18). Multiple structures, including ones determined in this study, of the catalytic domain have shown that this is a globular protein consisting of a hydrophobic β-sheet core surrounded by six α-helices (13-17). Strong similarities with A3G’s own pseudo-catalytic domain and other APOBECs have enabled development of useful molecular models.
The potent anti-HIV-1 activity of A3G has sparked numerous searches for small molecules that will antagonize Vif function or boost A3G activity (19-22). These strategies can be broadly grouped as ‘therapy by hypermutation’ (23). However, a good argument can be made that A3G is being exploited by HIV-1 and regulated by Vif in such a way that the virus may actually benefit from sublethal levels of A3G-dependent mutation (23-25). Such A3G-dependent genetic variation may contribute to the overall high HIV-1 mutation rate and the virus’ ability to escape immune responses and evolve resistance to anti-retroviral drugs. In the most extreme form of this hypothesis, one may even posit that HIV-1 has become reliant on the pro-mutagenic activity of A3G. Thus, current vaccination approaches and therapies may benefit from near total inhibition of A3G with small molecules (effectively agonizing Vif function). This strategy can be classified as ‘therapy by hypomutation’ (23).
Here, we report our initial steps toward testing the hypomutation hypothesis in vivo by identifying the first chemical inhibitors of A3G. We used a modified version of a fluorescence-based DNA cytosine deaminase assay (26) in a high-throughput screen (HTS) for small molecule inhibitors of A3G catalytic activity. Counterscreens with the related APOBEC3A (A3A) protein and three unrelated enzymes, E. coli uracil DNA glycosylase (UDG), HIV-1 RNaseH, and HIV-1 integrase, helped demonstrate the specificity of these compounds for A3G. A class of structurally similar compounds containing catechol moieties that react with an A3G catalytic domain cysteine were identified. These compounds most likely inhibit DNA deamination by a competitive steric inhibition mechanism. These compounds have potential utility as molecular probes and, with further development, they may also facilitate critical tests of the hypomutation hypothesis.
RESULTS AND DISCUSSION
Specific APOBEC3G Inhibitors Identified by HTS and Sub-screening Against the Related DNA Deaminase APOBEC3A
To screen for small molecule A3G inhibitors, we first optimized and miniaturized a fluorescence-based DNA deamination assay (26-28) (Fig 1a). Full-length human A3G was purified from HEK293T cells as a myc-His6 epitope-tagged protein (Fig S1). Recombinant enzyme is incubated with a single-stranded DNA (ssDNA) oligonucleotide containing a target cytosine, a 6-FAM fluorophore at the 5’ end, and TAMRA quenching molecule at the 3’ terminus. Deamination of the target cytosine to uracil (C-to-U) is followed by uracil excision by E. coli UDG and subsequent phosphodiester backbone cleavage by hydroxide, which releases the 6-FAM fluorophore from the TAMRA quench. Deaminase activity is quantified directly with a fluorescence plate reader. Using DMSO as a negative control and the non-specific inhibitor aurintricarboxylic acid (ATA) found in preliminary screens as a positive control, the average Z-score in 384 well plates was 0.85 indicating that the assay is robust and reproducible (Supplementary Figure S2 and Table S1).
Figure 1. APOBEC3G inhibitors identified by high throughput screening.
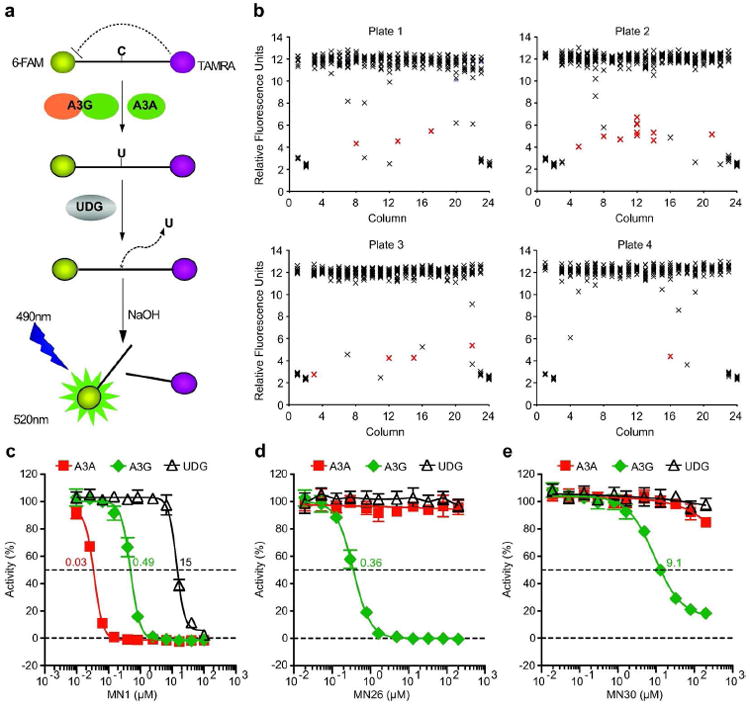
a) Schematic of the fluorescence-based ssDNA cytosine deamination assay. A3G or A3A deaminates C-to-U, UDG excises the U, NaOH breaks the phosphodiester backbone, and the 5’ fluorophore 6-FAM releases from the 3’ quench TAMRA. The resulting fluorescent read-out directly reports DNA deaminase activity because UDG and NaOH are not rate limiting.
b) Representative HTS data. Each X represents a single data point and the red-shaded X’s signify confirmed inhibitors. The first and last two columns of each LOPAC 384 well plate contain non-inhibitory (DMSO) or inhibitory (MN1) controls.
c, d, e) Representative A3G inhibitor dose response assays. The indicated concentrations of MN1, MN26, or MN30 were incubated with A3G (green symbols) or A3A (red symbols) in triplicate, and deaminase activity was quantified as above. UDG reactions lacked deaminase protein and used ssDNA substrate with a single uracil. Standard deviations and IC50 values are indicated.
The 1280 compound library of pharmacologically active compounds (LOPAC, Sigma) was used to screen for chemical inhibitors of A3G. A total of 34 small molecules inhibited ssDNA deaminase activity by at least 40% in two independent experiments (raw data in Fig 1b). Dose response curves were generated to re-confirm inhibitors and determine IC50 values, which mostly ranged from low- to mid-micromolar levels (representative data in Figure 1c, d, e; complete dose response set in Supplementary Figure S3). Compound structures are shown in Figure 2, and a summary of the 34 compounds relevant to this study can be found in Table 1.
Figure 2. APOBEC3G inhibitor structures.
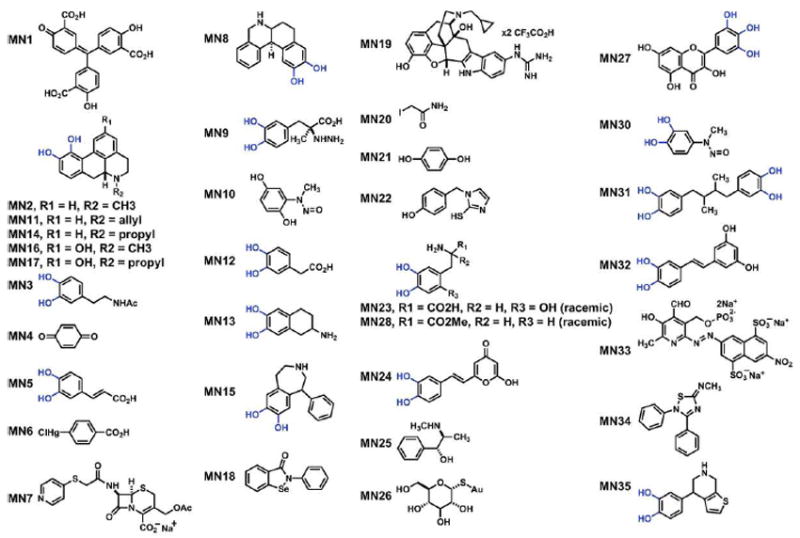
MN series identifiers and chemical structures for A3G inhibitors identified by HTS. Ortho-dihydroxy groups are depicted in blue.
Table 1.
APOBEC3G inhibitor summary.
| Entry | Common Name | PubChem CID | IC50 Values (μM)
|
||
|---|---|---|---|---|---|
| A3A | A3G | UDG | |||
| MN1 | Aurintricarboxylic acid | 2259 | 0.03 | 0.49 | 15 |
| MN2 | R-(−)-Apomorphine hydrochloride hemihydrate | 107882 | >200 | 1.3 | >200 |
| MN3 | N-Acetyldopamine monohydrate | 100526 | >200 | 0.45 | ND* |
| MN4 | p-Benzoquinone | 4650 | >200 | 0.17 | ND |
| MN5 | Caffeic acid | 689043 | >200 | 85 | >200 |
| MN6 | 4-Chloromercuribenzoic acid | 1730 | 0.26 | 0.13 | ND |
| MN7 | Cephapirin sodium salt | 23675312 | 12 | 7.5 | ND |
| MN8 | Dihydrexidine hydrochloride | 11957519 | >200 | 0.59 | >200 |
| MN9 | S-(−)-Carbidopa | 34359 | >200 | 5.3 | ND |
| MN10 | Dephostatin | 5353574 | 150 | 0.43 | >200 |
| MN11 | R(−)-N-Allylnorapomorphine hydrobromide | 11857524 | >200 | 2.9 | ND |
| MN12 | 3,4-Dihydroxyphenylacetic acid | 547 | >200 | 19 | >200 |
| MN13 | (±)-2-Amino-6,7-dihydroxy-1,2,3,4-tetrahydronaphthalene hydrobromide | 11957526 | >200 | 0.70 | >200 |
| MN14 | R(−)-Propylnorapomorphine hydrochloride | 11957529 | >200 | 6.4 | ND |
| MN15 | (±)-SKF-38393 hydrochloride | 147514 | >200 | 27 | >200 |
| MN16 | R(−)-2,10,11-Trihydroxyaporphine hydrobromide | 11957531 | >200 | 1.7 | >200 |
| MN17 | R(−)-2,10,11-Trihydroxy-N-propylnoraporphine hydrobromide hydrate | 10069059 | >200 | 13 | ND |
| MN18 | Ebselen | 3194 | 31 | 2.8 | >200 |
| MN19 | 5′-Guanidinonaltrindole di(trifluoroacetate) salt hydrate | 9853099 | 0.42 | 6.4 | >200 |
| MN20 | Iodoacetamide | 3727 | 6.1 | 3.0 | ND |
| MN21 | Hydroquinone | 785 | >200 | 2.6 | ND |
| MN22 | 1-(4-Hydroxybenzyl)imidazole-2-thio | 3035523 | >200 | 3.5 | >200 |
| MN23 | 6-Hydroxy-DL-DOPA | 107794 | 0.30 | 4.0 | >200 |
| MN24 | Hispidin | 5353671 | >200 | 2.0 | >200 |
| MN25 | (1R,2S)-(−)-Ephedrine | 9294 | 54 | 1.3 | ND |
| MN26 | Aurothioglucose hydrate | 6194 | >200 | 0.36 | >200 |
| MN27 | Myricetin | 5281672 | 0.60 | 3.4 | >200 |
| MN28 | (±)–3-(3,4-Dihydroxyphenyl)-2- methyl-DL-alanine | 38853 | >200 | 13 | >200 |
| MN30 | Methyl-3,4-dephostatin | 5353329 | >200 | 9.1 | >200 |
| MN31 | Nordihydroguaiaretic acid | 4534 | >200 | 8.8 | ND |
| MN32 | Piceatannol | 667639 | 200 | 1.8 | >200 |
| MN33 | PPNDS tetrasodium | 6324655 | 3.3 | 5.6 | ND |
| MN34 | SCH-202676 hydrobromide | 682802 | 310 | 29 | >200 |
| MN35 | SKF-89626 hydrobromide | 11957695 | >200 | 1.3 | >200 |
ND, not determined
By analogy to kinase inhibitor studies, which often use related enzymes to gauge compound specificities (29-32), we performed secondary dose response screens using A3A, which is 65% identical (73% similar) at the amino acid level to the C-terminal catalytic domain of A3G (Supplementary Figure S1). Surprisingly, the majority (24/34) of compounds failed to inhibit A3A, indicating a strong specificity for A3G (Figure 1d, e and Table 1). As an additional specificity test, the most candidate active compounds were tested against the second essential enzyme in our HTS reactions, UDG, by substituting uracil for the normal target cytosine in the ssDNA substrate (Figure 1a, c, d, e, Table 1 and Supplementary Figure S3). Only ATA (MN1) blocked UDG activity, concordant with prior studies showing that this compound is a non-specific nucleic acid enzyme inhibitor (33-35) (Figure 1c, Table 1 and Supplementary Figure S3).
A total of 24 A3G-specific inhibitors were identified in LOPAC screens. One major chemical trend emerged with 20/24 of these small molecules containing a common catechol (ortho-dihydroxyphenyl) or catechol-like structure (Figure 2). Approximately 1% of all known drugs possess a catechol pharmacophore, including at least 17 FDA-approved compounds (36). Two prominent members of this family, apomorphine (MN2) and carbidopa (MN9), were identified as A3G inhibitors in our screen. Based on this conserved structural feature and the established clinical relevance of catechol pharmacophores, we focused additional studies on this class of small molecule inhibitors with emphasis on methyl-3,4-dephostatin (MN30), which re-confirmed through commercial sources and de novo synthesis (Fig 1e, Fig 2, Table 1, Scheme S1 and Supplementary Figure S3).
DNA Binding Assays Suggest at Least Two Mechanisms of APOBEC3G Inhibition
To functionally group the A3G inhibitors, a series of ssDNA binding experiments using electrophoretic mobility shift assays (EMSAs) were performed. Prior studies have shown that the A3G holoenzyme binds ssDNA with affinities ranging from 50 μM to 70 μM and that this activity mostly emanates from the N-terminal pseudocatalytic domain, rather than the C-terminal catalytic domain (37-39). The ssDNA binding activity of A3G is evident by several higher mass ssDNA-protein complexes visible in native gels (37, 40, 41). Interestingly, a 80-fold molar excess of inhibitor (50μM) enabled a rough partition of all molecules into one of two general classes, those that block A3G from binding ssDNA and those that do not (Figure 3a). Compounds representative of each class re-confirmed in dose response EMSAs (Figure 3b). All but two of the repurchased catechol analogues showed no inhibition of A3G’s ssDNA binding activity suggesting that they function by binding within the C-terminal catalytic domain (e.g., MN30). The only exceptions, MN10 and MN35, might also bind within the N-terminal domain. However, these and the other molecules that may function by inhibiting ssDNA binding were not further considered at this point for technical reasons.
Figure 3. Most catechol class inhibitors do not interfere with A3G-ssDNA complex formation.
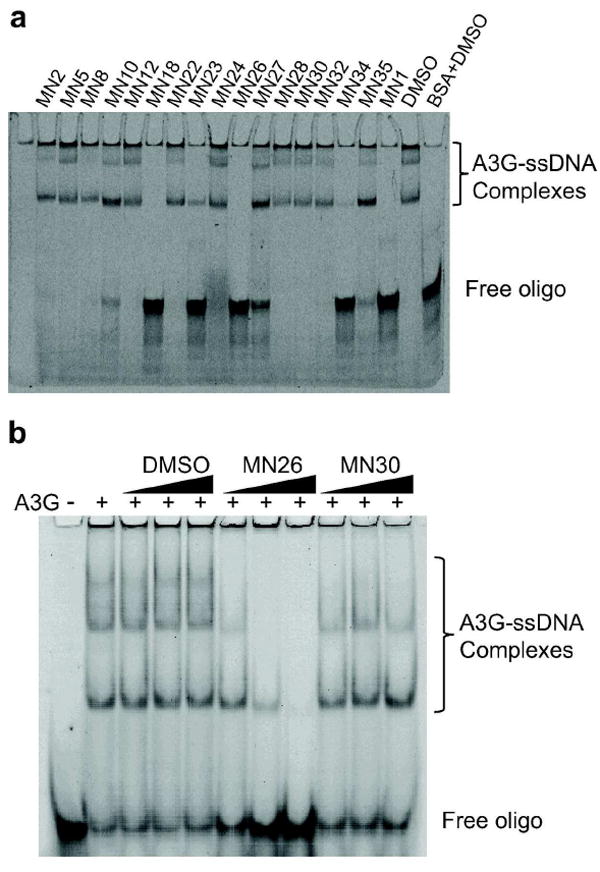
a) A3G-ssDNA complex formation is differentially affected by the indicated small molecules (0.64 μM A3G, 0.08 μM ssDNA, 50 μM compound). As controls, DMSO did not interfere with complex formation, and BSA did not cause complex formation.
b) Representative EMSAs with A3G, ssDNA, and 2, 5, and 10 μM of MN26 or MN30. Most catechol containing compounds such as MN30 do not influence A3G-ssDNA complex formation.
Crystal Structure Indicates Covalent Binding of MN30 to APOBEC3G
As we and others have successfully performed structural studies by NMR spectroscopy and X-ray crystallography on A3G (13-17), several of the inhibitors indentified above were used for co-crystallization experiments with A3G-191-384-2K3A (L234K, C243A, F310K, C321A and C356A) (15, 17). A3G-191-384-2K3A crystals were soaked with inhibitors and diffraction data obtained to 2.5Å. Positive electron density was observed in the Fo-Fc map adjacent to C308 for MN30-soaked crystals (Figure 4a, b and Table 2). The refinement statistics and electron density maps were improved by modeling the MN30 chemical structure onto the C308 region (Figure 4b). The electron density and the 1.7 Å estimated distance between the sulfhydryl group of C308 and the 5-position carbon of MN30 indicated a covalent linkage. The ability of MN30 to form a covalent protein adduct is supported by previous studies with a different catechol 1,2-dihydroxybenzene (42). Oxidation of catechol to the orthoquinone yields a reactive electrophile that can be covalently modified by protein nucleophiles, such as cysteine sulfhydryl groups. MN30 likely undergoes autooxidation to the orthoquinone in solution, yielding an analogous electrophile that can target the A3G-191-384-2K3A protein. However, the A3G-C308A mutant enzyme still showed wildtype susceptibility to MN30 inhibition in biochemical experiments (Figure 4c), strongly suggesting that this crystal structure identified a secondary MN30 binding site.
Figure 4. MN30 can bind A3G-191-384-2K3A at C308.
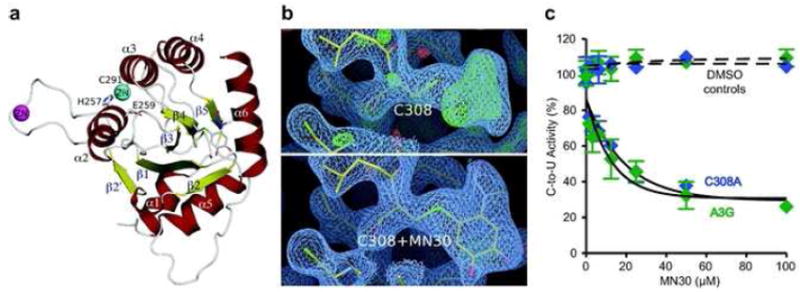
a) A ribbon diagram of the A3G-191-384-2K3A crystal structure showing the MN30 binding region. C308 and MN30 are displayed as ball-and-stick representations with the C308 thiol sulfur colored green. α-helices are colored red, β-sheets are colored yellow and the active site Zn & intermolecular Zn atoms are represented as cyan and magenta spheres, respectively. Active site Zn coordinating residues and the catalytic E259 are also indicated by ball-and-stick representations.
b) The 2Fo-Fc electron density map (blue mesh, contoured at sigma level 1.0) of the A3G region containing C308 without and with MN30. Atoms and bonds are represented as sticks, with the C308 thiol sulfur colored green.
c) MN30 still inhibits the DNA cytosine deaminase activity of a full-length A3G variant with the C308 binding site mutated to alanine. A3G- and A3G-C308A-mycHis proteins were purified as described in the methods and Supplementary Figure S1 and assayed in parallel with varying concentrations of MN30. Data from triplicate assays were normalized to the DMSO controls, and the relative mean activities are presented with SD.
Table 2.
Crystallographic statistics for the A3G-191-384-2K3A (MN30 + CYS308) and A3G191-380-2K2A (apo) crystal structures.
| A3G191-384-2K3A (MN30 bound) | A3G191-380-2K2A (apo) | |
|---|---|---|
| PDB ID | ---- | ---- |
| Resolution | 2.04 Å | 1.38 Å |
| Temperature | Cryogenic (-80° C) | Cryogenic (-80° C) |
| Space group | P1211 | P212121 |
| Cell dimensions : | ||
| a | 53.08 Å | 68.19 Å |
| b | 67.76 Å | 72.17 Å |
| c | 64.47 Å | 96.81 Å |
| α | 90.0° | 90.0° |
| β | 107.38° | 90.0° |
| γ | 90.0° | 90.0° |
| Molecules in AU | 2 | 2 |
| Completeness | 96.5% (94.3%) (Last shell 2.04 – 2.11) | 93.7% (92.6%) (Last shell 1.38 – 1.41) |
| Total reflections | 26969 | 280403 |
| Unique reflections | 28034 25587 (working) | 99113 86726 (working) |
| I/σ | 13.6 | 12.3 |
| Ave. redundancy | 5.0 | 3.0 |
| Rmerge | 5.6% | 4.8% |
| RMSD in: | 3.3% | |
| Bonds | 0.0096 Å | 0.0095 Å |
| Angles | 1.337° | 1.409° |
| Rfactor % | 23.11 | 18.26 |
| Rfree % | 28.37 | 21.47 |
Systematic Alanine Mutagenesis Revealed C321 as the APOBEC3G Inhibitor Binding Site
The A3G catalytic domain has four surface cysteines C243, C308, C321 and C356, in addition to partially exposed C288 and C291 that coordinate the active site zinc. The A3G catalytic domain variant used above for our initial studies, A3G-191-384-2K3A, has three cysteine to alanine substitutions, C243A, C321A and C356A. In the context of the full-length A3G protein, these three substitutions have no discernable effect on localization, deamination, oligomerization, or Vif-deficient HIV-1 restriction activities (15, 17). This full-length construct was purified and tested in parallel with wildtype enzyme against MN30 to ask whether any of these cysteines interacted with the A3G inhibitors. This mutant enzyme was fully resistant to MN30 and all other catechol-based inhibitors obtained from commercial sources (MN2, 5, 8, 10, 12, 13, 15, 16, 24, 28, 30, 32 and 35; MN3, 9, 11, 14, 17 and 31 were not tested) (Figure 5a). Thus, one of the three cysteines mutated in the 2K3A construct was very likely the biological target of this class of A3G inhibitors.
Figure 5. Genetic evidence that MN30 inactivates A3G by binding C321.
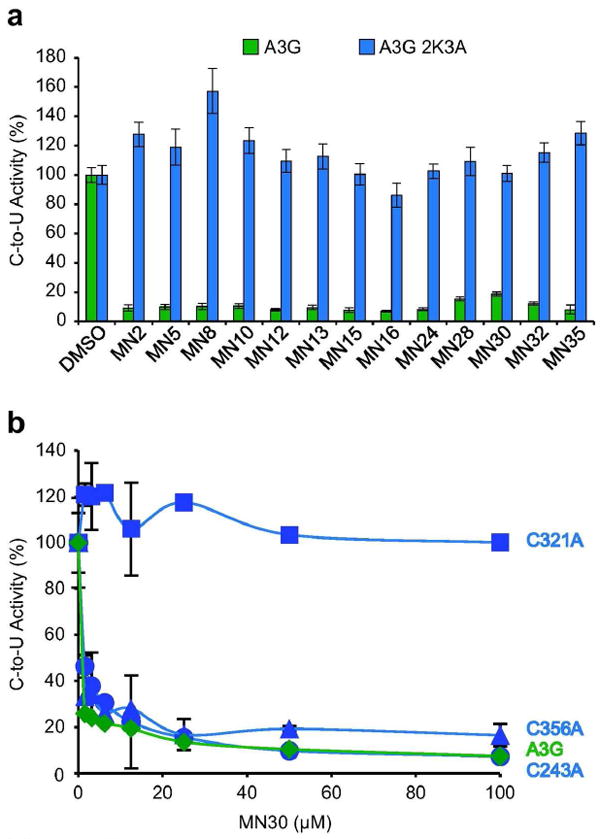
a) Full-length A3G-2K3A completely resists inhibition by all tested catechol series inhibitors. The mean and SD of triplicate deaminase assays with 50 μM compound, 0.0675 μM A3G, 0.33 μM ssDNA, and excess UDG are shown relative to the DMSO only controls.
b) A single amino acid substitution C321A defines the binding site in A3G for catechol series inhibitors. Wildtype A3G and the indicated single alanine derivatives were purified as described in the methods and Supplementary Figure S1 and assayed in parallel with varying concentrations of MN30. Data from triplicate assays were normalized to the DMSO only controls, and the relative mean activities are presented with SD.
To identify the inhibitor binding site, a series of three single cysteine to alanine mutants was constructed, purified to >80% homogeneity from HEK293T cells as myc-His tagged proteins, and tested against representative inhibitors in the fluorescence-based ssDNA C-to-U activity assay. Dose response data clearly revealed a single cysteine, C321, as the site targeted by MN30 and related catechol-type inhibitors, as this single amino acid substitution was alone sufficient to render A3G fully resistant to chemical inhibition (e.g., MN30 data in Figure 4b). Although the C321A mutant showed nearly the same level of catalytic activity as wildtype A3G, variants with bulkier amino acid substitutions in place of C321 (to L, F, Y, and W) showed significantly diminished ssDNA deaminase activity, effectively mimicking MN30 inhibition and further demonstrating that this amino acid position can impact catalytic activity (Supplementary Figure S4).
Mass Spectrometry Demonstrates that MN30 Forms a Covalent Bond with APOBEC3G Cys321
To directly probe whether MN30 forms a covalent bond with Cys321 in full-length A3G, we incubated MN30 with purified A3G, performed in-gel digestion with trypsin, and analyzed the resulting peptides by mass spectrometry. The C321 containing tryptic peptide C*QEGLRTLAEAGAK showed a 167.11 Da addition demonstrating covalent modification by MN30 (Supplementary Figure S5). Both 2+ and 3+ charge states of the peptide were detected and fragmented; the MS/MS spectra for both charge states resulted in highest-scoring identification that corresponded to the C*QGELRTLAEAGAK peptide. The dominant b-ion series observed in the MS/MS spectrum of the 3+ peptide suggests that MN30 is protonated in the gas phase, and the 167.11 Da mass reflects this inference. Similar LC-MS/MS results were obtained after incubating MN30 with A3G191-380-2K2A (data not shown).
A Structural Model for Competitive Active Site Inhibition
To further understand the mechanism of MN30 action, a new A3G C-terminal domain construct was generated with C321 restored (A3G-191-380-2K2A). The “apo” crystal structure of A3G-191-380-2K2A was solved to a resolution of 1.38Å (Figure 6a and Table 2). This is the highest resolution crystal structure to date for the A3G catalytic domain enabling full resolution of most amino acid side chains. As described previously, the enzyme is globular with a hydrophobic β-sheet core surrounded by six α-helices. Numerous attempts were also made to co-crystallize or soak MN30 into existing A3G-191-380-2K2A crystals, but these were unsuccessful. Upon binding C321, MN30 potentially induces a conformational change that is incompatible with the current crystal forms.
Figure 6. A3G-2K2A crystal structure and model of MN30 binding C321.
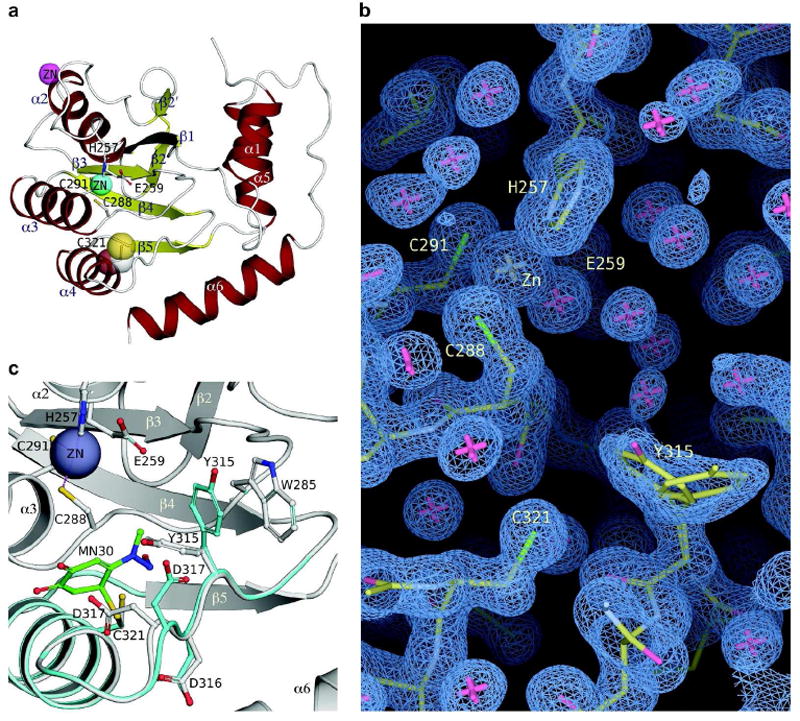
a) Crystal structure of A3G-191-380-2K2A showing the location and orientation of C321, displayed in ball-and-stick & transparent CPK representations. α-helices are colored red, β-sheets are colored yellow and the active site Zn & intermolecular Zn atoms are represented as cyan and magenta spheres, respectively. Active site Zn coordinating residues and the catalytic E259 are shown in ball-and-stick representations.
b) The 2Fo-Fc electron density map (blue mesh, contoured at sigma level 1.0) for the C321 region in the A3G-191-380-2K2A crystal structure. Atoms and bonds are represented as sticks.
c) A model for A3G inhibition by MN30 binding covalently to C321. The model is displayed as cyan colored ribbons and ball-and-stick, with MN30 colored green, superimposed onto the A3G-191-380-2K2A crystal structure (grayish colored ribbons). Critical residues are displayed in both the model and the crystal structure and labeled accordingly.
Nevertheless, with the new high-resolution crystal structure, an energy-minimized model of MN30 covalently bound to C321 was determined (Figure 6b, c). This model suggested a mechanism of competitive inhibition through steric hindrance. The ring structure of MN30 is predicted to be oriented toward the catalytic residues and cause Y315 to flip such that it contacts W285, which lines the active site (13). Both of these residues are conserved and essential for DNA deaminase activity (13). The net result is a model in which MN30 causes partial active site occupation by Y315, which in turn is likely to prevent ssDNA cytosine from being bound and/or positioning appropriately for catalysis. This model is consistent with our mutagenesis data indicating that modest amino acid substitutions at C321 are tolerated (C321A), but bulkier amino acid substitutions (C321L, -F, -Y, or -W) are not (Supplementary Figure S4).
To further test this model, a cysteine was introduced into the analogous loop region of A3A to determine whether a single cysteine adjacent to the active site would be sufficient to render an active DNA deaminase susceptible to inhibition (wildtype A3A does not normally have a cysteine in this area) (Figures 7a). However, in contrast to wildtype A3G, which is fully susceptible to inhibition, A3A-Y136C was fully resistant or modestly susceptible to a panel of 11 catechol-type inhibitors (compare Figure 5a and Figure 7b; summarized in Table 3). This was subsequently followed by swapping the entire C321 loop region from A3G into A3A. Although the resulting A3A-loop 6 construct had enzymatic activity comparable to wildtype A3A, the swapped variant became susceptible to inhibition with five compounds showing intermediate and five compounds showing strong levels of inhibition at 50 μM. The only exception was MN32, which caused very little inhibition at 50 μM. These data demonstrated that a single cysteine is not sufficient to sensitize A3A to inhibition, rather the entire loop is required for to confer the major determinants of specificity and contribute to inhibitor binding.
Figure 7. The entire C321 loop from APOBEC3G is required to sensitize APOBEC3A to chemical inhibition.
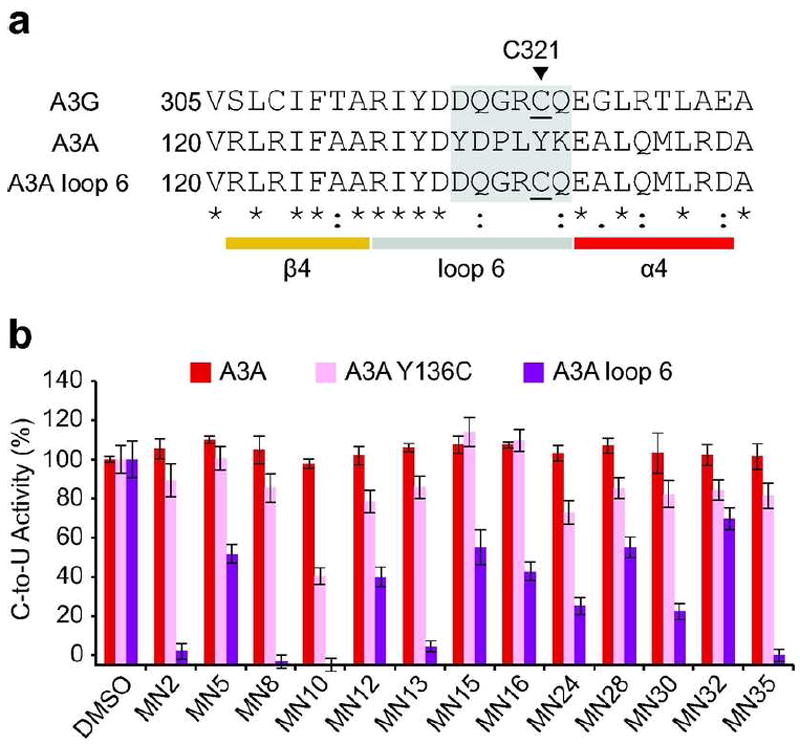
a) Alignment of the loop 6 regions of A3G (NP_068594.1), A3A (NP_663745.1) and A3A loop6 swap mutant by ClustalW2. The loop 6 region is shaded light gray and C321 is underlined. The secondary structure is derived from the A3G catalytic domain crystal structure (PDB ID: 3IR2) (17).
b) DNA deaminase activity data of the indicated recombinant proteins. The activity in the presence of DMSO carrier was set to 100% for each protein to facilitate comparison, and the relative mean activities are presented with SD.
Table 3.
APOBEC3G inhibitor specificity profiles.
| Inhibitor Class | Compound | IC50 Values (μM) a |
Reference | ||
|---|---|---|---|---|---|
| A3G | RNase H | Integrase b | |||
| Human A3G | MN8 | 0.59 | >25 | >25 | This study |
| MN13 | 0.70 | >25 | >25 | This study | |
| MN2 | 1.3 | >25 | >25 | This study | |
| MN35 | 1.3 | 2.2 | >25 | This study | |
| MN16 | 1.7 | >25 | >25 | This study | |
| MN32 | 1.8 | <0.39 | >25 | This study | |
| MN24 | 2.0 | 5.0 | >25 | This study | |
| MN30 | 9.1 | >25 | >25 | This study | |
| MN28 | 13 | >25 | >25 | This study | |
| MN12 | 19 | >25 | >25 | This study | |
| MN15 | 27 | >25 | >25 | This study | |
| HIV RNase H | BHMP-07 | 13 | 0.10 | ND c | (47) |
| KMMP-02 (THBNH) | >100 | 0.20 | ND | M. Parniak, unpublished | |
| β-Thujaplicinol | >100 | 0.21 | ND | (48) | |
| 9 | >100 | 0.24 | ND | (48) | |
| 6 | >100 | 0.38 | ND | (48) | |
| 3 | >100 | 0.50 | ND | (48) | |
| KMMP-05 (DHBNH) | >100 | 0.50 | ND | (43) | |
| 11 | >100 | 0.51 | ND | (48) | |
| BHMP-03 | >100 | 0.60 | ND | (47) | |
| Manicol | >100 | 0.60 | ND | (48) | |
| 13 | >100 | 0.68 | ND | (48) | |
| 1 | >100 | 0.82 | ND | (48) | |
| 7 | >100 | 0.93 | ND | (48) | |
| 14 | >100 | 0.96 | ND | (48) | |
| 4 | >100 | 1.2 | ND | (48) | |
| 5 | >100 | 1.2 | ND | (48) | |
| 10 | 98 | 1.3 | ND | (48) | |
| 8 | >100 | 1.3 | ND | (48) | |
| 2 | >100 | 1.9 | ND | (48) | |
| 12 | 26 | 1.9 | ND | (48) | |
| HIV Integrase | L-Chicoric Acid | 2.8 | ND | 0.06 | Cmpd D in (44) |
| GMII 107B | >100 | ND | 0.18 | Cmpd F in (44) | |
| CGI-109 | 2.5 | ND | 0.21 | Cmpd 14 in (46) | |
| CGI-83D | 1.0 | ND | 0.44 | Cmpd 13 in (46) | |
| CAPE | >100 | ND | 18.9 | (44, 45) | |
| L-Tartaric Acid | >100 | ND | >25 | (49) | |
| Quinic Acid | >100 | ND | >25 | (51) | |
| Chlorogenic acid | >100 | ND | >50 | Cmpd E in (44) | |
IC50 values are ranked from lowest to highest for each inhibitor class.
Concerted integration assays were done to determine IC50 values for A3G inhibitors, whereas a variety of in vitro integrase assays were used for the published inhibitors.
Not determined.
Additional Specificity Tests
MN30 is only one of twenty A3G-specific compounds identified by HTS that contain a catechol (ortho-dihydroxyphenyl) or catechol-like moiety. Catechols are prevalent in therapeutically-relevant small molecules, with approximately 1% of all known drugs bearing this motif (36). Although MN30 can react in vitro with two cysteines in A3G (C308 and C321), the fact that they do not inhibit the related deaminase A3A (five cysteines) or the second enzyme in our deaminase assays, uracil DNA glycosylase (one cysteine) suggests that these compounds are not in fact promiscuous, but rather specific. This inference is further supported by the fact that the LOPAC library has an additional 55 catechol-bearing compounds that did not inhibit A3G catalytic activity in the primary HTS campaign (Table S2).
To further probe specificity, two unrelated HIV-1 enzymes, RNase H and integrase, were tested for susceptibility to inhibition by the small molecules that we have identified as A3G inhibitors (Table 3). The rationale for selecting these targets was two-fold; first, future tests of the hypomutation hypothesis should not be confounded by non-specifically blocking viral infectivity and, second, other catechols have been reported as inhibitors of these viral enzymes [e.g., (43-51) published IC50 values reproduced in Table 3 for comparison]. Eleven catechol-containing inhibitors identified by HTS were evaluated as HIV-1 RNase H and integrase inhibitors by previously reported methods (43, 52). Two molecules, MN24 and MN35, showed modest micromolar inhibitory activity against RNase H and a third molecule, MN32, inhibited RNase H activity with an IC50 = 0.39 μM. None of the 11 molecules were found to inhibit HIV integrase (IC50 > 25 μM, Table 3), demonstrating that the catatechol-containing A3G inhibitors identified here by HTS possess high selectivity for A3G.
To further study A3G specificity over HIV-1 RNase H, a panel of previously described RNase H inhibitors was evaluated for A3G inhibition [(43, 47, 48); Table 3]. Included among this panel of known RNase H inhibitors were two dihydroxy phenolic (catechols), KMMP-05 (DHBNH) and BHMP-03, and two trihydroxy phenolic molecules, KMMP-02 (THBNH) and BHMP-07. Only one of the trihydroxy phenolic compounds, BHMP-07, exhibited modest inhibition of A3G (IC50 = 13 μM). These results were analogous to those observed for the trihydroxy phenolic compounds MN23 and MN27, which inhibit A3G catalytic activity but also inhibit A3A and block A3G from binding single-stranded DNA (Figure 2, Figure 3, Table 1, and Table 3). These data indicated that the dihydroxy phenolic (catechol-type) compounds are more specific than the trihydroxy phenolic compounds, which behaved more promiscuously and seemed to mediate inhibition by binding more than one site. 16 related α-hydroxytropolones were also tested because they were originally identified as RNase H inhibitors in a natural product screen (48), but none of these molecules were found to block A3G activity (though one showed modest inhibition) (Table 3).
The specificity of a panel of previously characterized HIV-1 integrase inhibitors was also tested (44-46, 49-51) (Table 3 and Supplementary Figure S6). One of these small molecules had two trihydroxy phenolic groups, CGI-109, and it strongly inhibited both A3G and A3A, again suggesting a relaxed specificity for this particular chemical moiety. Two dihydroxy phenolic compounds, L-chicoric acid and CGI-83D, however, also inhibited both A3G and A3A. L-chicoric acid was notable because its IC50 values are approximately 100-fold lower for integrase than for A3G or A3A, suggesting a significant selectivity for inhibiting HIV-1 integrase. The precise mechanism of inhibition is not clear for these compounds, but the fact that A3A is susceptible (even without a cysteine in the loop 6 region) strongly suggests a distinct mechanism from the C321 binding A3G inhibitors identified here. Finally, two additional reported catechol-type integrase inhibitors, GMII-107B and caffeic acid phenethyl ester (CAPE), had no significant effect on A3G or A3A. For reference, several additional catechol-containing compounds, such as chlorogenic acid, and compounds bearing aliphatic 1,2-diols, such as L-tartaric acid and quinic acid, were tested for inhibitory activity against A3G and all exhibited no effect.
Concluding Remarks
We have used a fluorescence-based deaminase assay and HTS to identify the first small molecule inhibitors of the human enzyme APOBEC3G. 20/24 of these small molecules have a common catechol (ortho-dihydroxyphenyl) or catechol-like chemical feature. Our experiments have demonstrated a large degree of specificity for A3G inhibition, because almost all of these compounds failed to inhibit the related enzyme A3A or the unrelated enzymes E. coli UDG, HIV-1 RNase H, or HIV-1 integrase. A combination of mutagenesis, structural, and mass spectrometry data led us to propose a model in which this class of compounds binds specifically to a pocket adjacent to the A3G active site, reacts covalently with C321, and pushes Y315 into the active site, thereby sterically blocking the entry of substrate DNA cytosines (structural model depicted in Figure 6). The experiments in which we added a single cysteine to the loop 6 region of A3A and then replaced the entire loop with the corresponding loop 6 of the A3G catalytic domain (containing C321) were particularly informative, because the results strongly indicated specificity determinants within the loop in addition to the reactive C321.
Molecular modeling with the new 1.38Å A3G catalytic domain crystal structure targeting cysteine 321 and specificity loop 6 can be used to perform high-throughput virtual screening of a large number of catechol containing compounds to identify related small molecule inhibitors with even greater potency and specificity for the A3G active site. For example, dephostatin (MN10) is a natural product isolated from Streptomyces that interferes with protein tyrosine phosphatase activity (53-55), but is too unstable for most biological applications (56). In an effort to identify dephostatin analogues with enhanced potency, methyl-3,4-dephostatin (MN30) was synthesized and found to possess similar protein phosphatase inhibitory activity as compared to its parent natural product MN10 (57). This compound has demonstrated efficacy in a murine model of diabetes following oral dosing (58). Our future studies will be directed toward expanding DNA deaminase inhibitor HTS, performing structure based inhibitor design, docking and medicinal chemistry to further improve potency and specificity, employing MN30 and derivative compounds as molecular probes to further dissect A3G biochemical and structural features, and ultimately using select compounds to test the hypomutation hypothesis that A3G may be pro-viral in vivo.
METHODS
Cell culture and protein purification
A3G- and A3A-mycHis were purified from stably or transiently transfected HEK293T cells using the C-terminal hexahistidine tags, as described (27, 28). Cells were maintained in DMEM (Invitrogen) with 10% FBS (Hyclone), 50 units/ml penicillin and 50 μg/ml streptomycin (Invitrogen) in 37°C and 5% CO2. Transfections were done with TransIT-LTI (Mirus Bio). 48 hrs post-transfection, cells were harvested and lysed in 25 mM HEPES, pH 7.4, 150 mM NaCl, 1 mM MgCl2, 1 mM ZnCl2, 1 mM EDTA, 0.5% Triton X-100 and 10% glycerol. Insoluble materials were removed from crude cell lysates by centrifugation (14,000 rpm, 10min) and A3G- or A3A-mycHis were purified from supernatants. An anti-c-myc mAb 9E11 (Thermo Fisher Scientific) was used to detect these proteins in immunoblot experiments. An anti-Tubulin mAb (Covance) was used as a loading control.
DNA deaminase assay and HTS
The fluorescence-based DNA cytosine deamination assay (26-28) was adapted for HTS with purified proteins as follows. Recombinant human A3A- or A3G-mycHis proteins were diluted with 50 mM Tris-Cl, pH 7.4, 150 mM NaCl, 10% glycerol, 0.5% triton X-100, 1 mM PMSF (MP Biomedicals), 1 μg/ml Aprotinin (Sigma), 1 μg/ml Leupeptin (MP Biomedicals), and 1μg/ml Pepstatin A (Fisher Scientific) to working concentrations. 15 μl enzyme was incubated with 10 pmol ssDNA substrate 5’-6-FAM-AAA-CCC-AAA-GAG-AGA-ATGTGA-TAMRA-3’ (Biosearch Technologies, Inc.) and 0.02 unit of UDG (NEB) diluted in 15 μl of 50 mM Tris.Cl, pH 7.4, 10 mM EDTA for 2 hrs at 37 °C in Nunc 384-well black plates. 3 μl of 4 N NaOH was added, followed by mixing and incubating at 37°C for another 30 min. 3μl of 4N HCl and 37μl of 2M Tris.Cl (pH 7.9) was then added for neutralization and the relative deaminase activity was quantified by reading fluorescence with excitation at 490 nm and emission at 520 nm on Synergy Mx Monochromator-Based Multi-Mode (BioTek Instruments, Inc.) or LJL Analyst AD (LJL BioSystems, Inc.) microplate readers. UDG assays omitted the deaminase and used ssDNA substrate with a single uracil in place of the A3G-preferred cytosine (5’-6-FAM-AAA-CCU-AAA-GAGAGA-ATG-TGA-TAMRA-3’). All compound stocks were suspended in 10 mM DMSO and diluted as indicated. HTS used 0.04 μM A3G, 0.33 μM ssDNA substrate, 10 μM compound, and 6.7×10⁻⁴ units UDG (NEB). IC50 values were determined using GraphPad Prism. Crude lysate deaminase assays were run as described originally (26-28).
EMSAs
A3G-mycHis was incubated with ssDNA substrate 5’-biotin-ATT-ATTATT-ATT-CCA-ATG-GAT-TTA-TTT-ATT-TAT-TTA-TTT-ATT-T-fluroescein-3’ in 50 mM Tris-Cl, pH 7.8, 100 mM KCl, 10 mM MgCl2, 1 mM DTT, 0.5 mM ZnCl2 and 10% glycerol at 37°C for 30 min with varying concentrations of compounds in DMSO. The reaction products were subjected to native TBE PAGE. A3G-ssDNA complexes were visualized at 463 nm using a Fuji FLA-5000 fluorescent image analyzer.
Mass Spectrometry
A3G-mycHis was incubated with MN30, separated by SDS-PAGE, and stained with SimplyBlue™ SafeStain (Invitrogen). A3G bands were excised from the gel and digested with trypsin (59, 60). Extracted peptides were resuspended in 20 μl of 0.1% formic acid and analyzed by LC-MS/MS on an LTQ Orbitrap XL mass spectrometer (Thermo Scientific) equipped with a nanoACQUITY autosampler and chromatography system (Waters). 5 μl of each sample was injected onto a nanoACQUITY Symmetry C18 trap (5 μm particle size, 180 μm × 20 mm) in buffer A (0.1% formic acid) at a flow rate of 4 μl/min and then separated over a nanoACQUITY BEH C18 analytical column (1.7 μm particle size, 100 μm × 100 mm) over two hrs with a gradient from 2% to 25% buffer B (99.9% ACN, 0.1% formic acid) at a flow rate of 0.4 μl/min. The mass spectrometer continuously collected data in a data-dependent manner, collecting a survey scan in the Orbitrap mass analyzer at 40,000 resolution with an automatic gain control (AGC) target of 1 × 10ˆ6 followed by collision-induced dissociated (CID) MS/MS scans of the 10 most abundant ions in the survey scan in the ion trap with an AGC target of 5,000, a signal threshold of 1,000, a 2.0 Da isolation width, and 30 ms activation time at 35% normalized collision energy. Charge state screening was employed to reject unassigned or 1+ charge states. Dynamic exclusion was enabled to ignore masses for 30 s that had been previously selected for fragmentation. The collected mass spectra were searched against the SwissProt database using the Protein Prospector software suite (61). To identify potentially MN30-modified peptides, a secondary search was performed against A3G allowing 160-170 Da mass modifications to any cysteine.
Crystallization and structure determinations
A3G-191-384-2K3A and A3G-191-380-2K2A were expressed with N-terminal GST tags and purified and crystallized as described (17). 1 mM MN30 in DMSO was added to A3G-191-384-2K3A crystallization drops, incubated 12 hrs, and flash frozen in liquid N2. Data collection occurred under cryogenic conditions. Data for A3G-191-384-2K3A crystals soaked with MN30 were collected in-house on a R-AXIS IV detector system (Rigaku Inc.) with a Cu rotating anode X-ray generator. Data for the A3G-191-380-2K2A “apo” crystals were collected at the GM/CA-CAT beamline at the Advanced Photon Source (APS, ANL, Chicago, IL). In both cases, data were reduced with HKL2000, and structural models were generated by molecular replacement using the previous A3G catalytic domain crystal structure (PDB ID: 3IR2). Further refinement was done with Refmac5 as provided in the CCP4 software suite, and model building was done using Coot. PyMOL (Schrodinger Inc.) was used for viewing final structures and generating images.
Modeling A3G-C321-MN30 complexes
MN30 was modeled into the A3G-191-380-2K2A crystal structure using the Prime “Covalent Docking” module as provided in the software Maestro (Schrodinger Inc.), following standard protein and ligand preparation modules and protocols as provided by the vendor.
HIV-1 integrase and RNase H inhibition assays
Concerted HIV-1 integration assays were performed as described (52). RNase H inhibition experiments were done as described using fluorescently labeled RNA/DNA hybrid substrates (43).
Supplementary Material
Acknowledgments
We thank D. Grandgenett for advice on HIV integrase, S. Chung and S. LeGrice for RNaseH inhibitor aliquots, and laboratory members for discussion and comments on the manuscript. Integrase inhibitors were synthesized by M. G. Reinecke (Texas Christian University) and provided by W. E. Robinson Jr. (University of California, Irvine). This work was supported by grants from the National Institutes of Health (P01 GM091743 to R.S.H. and C.A.S., R01 AI064046 to R.S.H., and R01 GM093833 to C.A.S.), the Medica Foundation Partnership for Biotechnology and Medical Genomics (Project Grant to R.S.H.), the Gates Foundation (Seed Award to R.S.H.), the Campbell Foundation (Project Grant to R.S.H.), the University of Minnesota Innovation Program (Project Grant to R.S.H.), and the University of Minnesota, College of Pharmacy and Dept. of Medicinal Chemistry (startup funds to D.A.H.).
Footnotes
Supporting Information Available: This material is available free of charge via the Internet at http://pubs.acs.org.
References
- 1.Albin JS, Harris RS. Interactions of host APOBEC3 restriction factors with HIV-1 in vivo: implications for therapeutics. Expert Rev Mol Med. 2010;12:e4. doi: 10.1017/S1462399409001343. [DOI] [PMC free article] [PubMed] [Google Scholar]
- 2.Malim MH. APOBEC proteins and intrinsic resistance to HIV-1 infection. Philos Trans R Soc Lond B Biol Sci. 2009;364:675–687. doi: 10.1098/rstb.2008.0185. [DOI] [PMC free article] [PubMed] [Google Scholar]
- 3.Smith JL, Bu W, Burdick RC, Pathak VK. Multiple ways of targeting APOBEC3-virion infectivity factor interactions for anti-HIV-1 drug development. Trends in pharmacological sciences. 2009;30:638–646. doi: 10.1016/j.tips.2009.09.006. [DOI] [PMC free article] [PubMed] [Google Scholar]
- 4.Bishop KN, Verma M, Kim EY, Wolinsky SM, Malim MH. APOBEC3G inhibits elongation of HIV-1 reverse transcripts. PLoS Pathog. 2008;4:e1000231. doi: 10.1371/journal.ppat.1000231. [DOI] [PMC free article] [PubMed] [Google Scholar]
- 5.Schumacher AJ, Haché G, MacDuff DA, Brown WL, Harris RS. The DNA deaminase activity of human APOBEC3G is required for Ty1, MusD, and human immunodeficiency virus type 1 restriction. J Virol. 2008;82:2652–2660. doi: 10.1128/JVI.02391-07. [DOI] [PMC free article] [PubMed] [Google Scholar]
- 6.Miyagi E, Opi S, Takeuchi H, Khan M, Goila-Gaur R, Kao S, Strebel K. Enzymatically active APOBEC3G is required for efficient inhibition of human immunodeficiency virus type 1. J Virol. 2007;81:13346–13353. doi: 10.1128/JVI.01361-07. [DOI] [PMC free article] [PubMed] [Google Scholar]
- 7.Browne EP, Allers C, Landau NR. Restriction of HIV-1 by APOBEC3G is cytidine deaminase-dependent. Virology. 2009;387:313–321. doi: 10.1016/j.virol.2009.02.026. [DOI] [PMC free article] [PubMed] [Google Scholar]
- 8.Yu X, Yu Y, Liu B, Luo K, Kong W, Mao P, Yu XF. Induction of APOBEC3G ubiquitination and degradation by an HIV-1 Vif-Cul5-SCF complex. Science. 2003;302:1056–1060. doi: 10.1126/science.1089591. [DOI] [PubMed] [Google Scholar]
- 9.LaRue RS, Lengyel J, Jónsson SR, Andrésdóttir V, Harris RS. Lentiviral Vif degrades the APOBEC3Z3/APOBEC3H protein of its mammalian host and is capable of cross-species activity. J Virol. 2010;84:8193–8201. doi: 10.1128/JVI.00685-10. [DOI] [PMC free article] [PubMed] [Google Scholar]
- 10.Münk C, Beck T, Zielonka J, Hotz-Wagenblatt A, Chareza S, Battenberg M, Thielebein J, Cichutek K, Bravo IG, O’Brien SJ, Löchelt M, Yuhki N. Functions, structure, and read-through alternative splicing of feline APOBEC3 genes. Genome Biol. 2008;9:R48. doi: 10.1186/gb-2008-9-3-r48. [DOI] [PMC free article] [PubMed] [Google Scholar]
- 11.Bogerd HP, Tallmadge RL, Oaks JL, Carpenter S, Cullen BR. Equine infectious anemia virus resists the antiretroviral activity of equine APOBEC3 proteins through a packaging-independent mechanism. J Virol. 2008;82:11889–11901. doi: 10.1128/JVI.01537-08. [DOI] [PMC free article] [PubMed] [Google Scholar]
- 12.Schmitt K, Hill MS, Liu Z, Ruiz A, Culley N, Pinson DM, Stephens EB. Comparison of the replication and persistence of simian-human immunodeficiency viruses expressing Vif proteins with mutation of the SLQYLA or HCCH domains in macaques. Virology. 2010;404:187–203. doi: 10.1016/j.virol.2010.04.017. [DOI] [PMC free article] [PubMed] [Google Scholar]
- 13.Chen KM, Harjes E, Gross PJ, Fahmy A, Lu Y, Shindo K, Harris RS, Matsuo H. Structure of the DNA deaminase domain of the HIV-1 restriction factor APOBEC3G. Nature. 2008;452:116–119. doi: 10.1038/nature06638. [DOI] [PubMed] [Google Scholar]
- 14.Furukawa A, Nagata T, Matsugami A, Habu Y, Sugiyama R, Hayashi F, Kobayashi N, Yokoyama S, Takaku H, Katahira M. Structure, interaction and real-time monitoring of the enzymatic reaction of wild-type APOBEC3G. Embo J. 2009;28:440–451. doi: 10.1038/emboj.2008.290. [DOI] [PMC free article] [PubMed] [Google Scholar]
- 15.Harjes E, Gross PJ, Chen KM, Lu Y, Shindo K, Nowarski R, Gross JD, Kotler M, Harris RS, Matsuo H. An extended structure of the APOBEC3G catalytic domain suggests a unique holoenzyme model. J Mol Biol. 2009;389:819–832. doi: 10.1016/j.jmb.2009.04.031. [DOI] [PMC free article] [PubMed] [Google Scholar]
- 16.Holden LG, Prochnow C, Chang YP, Bransteitter R, Chelico L, Sen U, Stevens RC, Goodman MF, Chen XS. Crystal structure of the anti-viral APOBEC3G catalytic domain and functional implications. Nature. 2008;456:121–124. doi: 10.1038/nature07357. [DOI] [PMC free article] [PubMed] [Google Scholar]
- 17.Shandilya SMD, Nalam MNL, Nalivaika EA, Gross PJ, Valesano JC, Shindo K, Li M, Munson M, Royer WE, Harjes E, Kouno T, Matsuo H, Harris RS, Somasundaran M, Schiffer CA. Crystal structure of the APOBEC3G catalytic domain reveals potential oligomerization interfaces. Structure. 2010;18:28–38. doi: 10.1016/j.str.2009.10.016. [DOI] [PMC free article] [PubMed] [Google Scholar]
- 18.LaRue RS, Andresdottir V, Blanchard Y, Conticello SG, Derse D, Emerman M, Greene WC, Jonsson SR, Landau NR, Lochelt M, Malik HS, Malim MH, Munk C, O’Brien SJ, Pathak VK, Strebel K, Wain-Hobson S, Yu XF, Yuhki N, Harris RS. Guidelines for naming nonprimate APOBEC3 genes and proteins. J Virol. 2009;83:494–497. doi: 10.1128/JVI.01976-08. [DOI] [PMC free article] [PubMed] [Google Scholar]
- 19.Xiao Z, Ehrlich E, Luo K, Xiong Y, Yu XF. Zinc chelation inhibits HIV Vif activity and liberates antiviral function of the cytidine deaminase APOBEC3G. Faseb J. 2007;21:217–222. doi: 10.1096/fj.06-6773com. [DOI] [PubMed] [Google Scholar]
- 20.Nathans R, Cao H, Sharova N, Ali A, Sharkey M, Stranska R, Stevenson M, Rana TM. Small-molecule inhibition of HIV-1 Vif. Nat Biotechnol. 2008;26:1187–1192. doi: 10.1038/nbt.1496. [DOI] [PMC free article] [PubMed] [Google Scholar]
- 21.Cen S, Peng ZG, Li XY, Li ZR, Ma J, Wang YM, Fan B, You XF, Wang YP, Liu F, Shao RG, Zhao LX, Yu L, Jiang JD. Small molecular inhibitors for HIV-1 replication through specifically stabilizing APOBEC3G. J Biol Chem. 2010 doi: 10.1074/jbc.M109.085308. In press. [DOI] [PMC free article] [PubMed] [Google Scholar]
- 22.Ejima T, Hirota M, Mizukami T, Otsuka M, Fujita M. An anti-HIV-1 compound that increases steady-state expression of apoplipoprotein B mRNA-editing enzyme-catalytic polypeptide-like 3G. Int J Mol Med. 2011;28:613–616. doi: 10.3892/ijmm.2011.737. [DOI] [PubMed] [Google Scholar]
- 23.Harris RS. Enhancing immunity to HIV through APOBEC. Nat Biotechnol. 2008;26:1089–1090. doi: 10.1038/nbt1008-1089. [DOI] [PubMed] [Google Scholar]
- 24.Haché G, Mansky LM, Harris RS. Human APOBEC3 proteins, retrovirus restriction, and HIV drug resistance. AIDS Rev. 2006;8:148–157. [PubMed] [Google Scholar]
- 25.Sadler HA, Stenglein MD, Harris RS, Mansky LM. APOBEC3G contributes to HIV-1 variation through sublethal mutagenesis. J Virol. 2010;84:7396–7404. doi: 10.1128/JVI.00056-10. [DOI] [PMC free article] [PubMed] [Google Scholar]
- 26.Thielen BK, Klein KC, Walker LW, Rieck M, Buckner JH, Tomblingson GW, Lingappa JR. T cells contain an RNase-insensitive inhibitor of APOBEC3G deaminase activity. PLoS Pathog. 2007;3:1320–1334. doi: 10.1371/journal.ppat.0030135. [DOI] [PMC free article] [PubMed] [Google Scholar]
- 27.Stenglein MD, Burns MB, Li M, Lengyel J, Harris RS. APOBEC3 proteins mediate the clearance of foreign DNA from human cells. Nat Struct Mol Biol. 2010;17:222–229. doi: 10.1038/nsmb.1744. [DOI] [PMC free article] [PubMed] [Google Scholar]
- 28.Shlyakhtenko LS, Lushnikov AY, Li M, Lackey L, Harris RS, Lyubchenko YL. Atomic force microscopy studies provide direct evidence for dimerization of the HIV restriction factor APOBEC3G. J Biol Chem. 2011;286:3387–3395. doi: 10.1074/jbc.M110.195685. [DOI] [PMC free article] [PubMed] [Google Scholar]
- 29.Kim BH, Jee JG, Yin CH, Sandoval C, Jayabose S, Kitamura D, Bach EA, Baeg GH. NSC114792, a novel small molecule identified through structure-based computational database screening, selectively inhibits JAK3. Mol Cancer. 2010;9:36. doi: 10.1186/1476-4598-9-36. [DOI] [PMC free article] [PubMed] [Google Scholar]
- 30.Caffrey DR, Lunney EA, Moshinsky DJ. Prediction of specificity-determining residues for small-molecule kinase inhibitors. BMC Bioinformatics. 2008;9:491. doi: 10.1186/1471-2105-9-491. [DOI] [PMC free article] [PubMed] [Google Scholar]
- 31.Fedorov O, Marsden B, Pogacic V, Rellos P, Muller S, Bullock AN, Schwaller J, Sundstrom M, Knapp S. A systematic interaction map of validated kinase inhibitors with Ser/Thr kinases. Proc Natl Acad Sci U S A. 2007;104:20523–20528. doi: 10.1073/pnas.0708800104. [DOI] [PMC free article] [PubMed] [Google Scholar]
- 32.Fischer PM. The design of drug candidate molecules as selective inhibitors of therapeutically relevant protein kinases. Curr Med Chem. 2004;11:1563–1583. doi: 10.2174/0929867043365062. [DOI] [PubMed] [Google Scholar]
- 33.Benchokroun Y, Couprie J, Larsen AK. Aurintricarboxylic acid, a putative inhibitor of apoptosis, is a potent inhibitor of DNA topoisomerase II in vitro and in Chinese hamster fibrosarcoma cells. Biochem Pharmacol. 1995;49:305–313. doi: 10.1016/0006-2952(94)00465-x. [DOI] [PubMed] [Google Scholar]
- 34.Gonzalez RG, Haxo RS, Schleich T. Mechanism of action of polymeric aurintricarboxylic acid, a potent inhibitor of protein--nucleic acid interactions. Biochemistry. 1980;19:4299–4303. doi: 10.1021/bi00559a023. [DOI] [PubMed] [Google Scholar]
- 35.Hashem AM, Flaman AS, Farnsworth A, Brown EG, Van Domselaar G, He R, Li X. Aurintricarboxylic acid is a potent inhibitor of influenza A and B virus neuraminidases. PloS one. 2009;4:e8350. doi: 10.1371/journal.pone.0008350. [DOI] [PMC free article] [PubMed] [Google Scholar]
- 36.Bak A, Magdziarz T, Kurczyk A, Polanski J. Mapping Drug Architecture by MoStBioDat: Rapid Screening of Intramolecular Hydrogen Bonded Motifs in Catechols. Drug Development Research. 2011;72:209–218. [Google Scholar]
- 37.Iwatani Y, Takeuchi H, Strebel K, Levin JG. Biochemical activities of highly purified, catalytically active human APOBEC3G: correlation with antiviral effect. J Virol. 2006;80:5992–6002. doi: 10.1128/JVI.02680-05. [DOI] [PMC free article] [PubMed] [Google Scholar]
- 38.Chelico L, Pham P, Calabrese P, Goodman MF. APOBEC3G DNA deaminase acts processively 3’ --> 5’ on single-stranded DNA. Nat Struct Mol Biol. 2006;13:392–399. doi: 10.1038/nsmb1086. [DOI] [PubMed] [Google Scholar]
- 39.Nowarski R, Britan-Rosich E, Shiloach T, Kotler M. Hypermutation by intersegmental transfer of APOBEC3G cytidine deaminase. Nat Struct Mol Biol. 2008;15:1059–1066. doi: 10.1038/nsmb.1495. [DOI] [PubMed] [Google Scholar]
- 40.Demorest ZL, Li M, Harris RS. Phosphorylation Directly Regulates the Intrinsic DNA Cytidine Deaminase Activity of Activation-induced Deaminase and APOBEC3G Protein. J Biol Chem. 2011;286:26568–26575. doi: 10.1074/jbc.M111.235721. [DOI] [PMC free article] [PubMed] [Google Scholar]
- 41.McDougall WM, Okany C, Smith HC. Deaminase activity on ssDNA occurred in vitro when APOBEC3G forms homotetramers and higher-order complexes. J Biol Chem. 2011;286:30655–30661. doi: 10.1074/jbc.M111.269506. [DOI] [PMC free article] [PubMed] [Google Scholar]
- 42.Schweigert N, Zehnder AJ, Eggen RI. Chemical properties of catechols and their molecular modes of toxic action in cells, from microorganisms to mammals. Environ Microbiol. 2001;3:81–91. doi: 10.1046/j.1462-2920.2001.00176.x. [DOI] [PubMed] [Google Scholar]
- 43.Himmel DM, Sarafianos SG, Dharmasena S, Hossain MM, McCoy-Simandle K, Ilina T, Clark AD, Jr, Knight JL, Julias JG, Clark PK, Krogh-Jespersen K, Levy RM, Hughes SH, Parniak MA, Arnold E. HIV-1 reverse transcriptase structure with RNase H inhibitor dihydroxy benzoyl naphthyl hydrazone bound at a novel site. ACS Chem Biol. 2006;1:702–712. doi: 10.1021/cb600303y. [DOI] [PMC free article] [PubMed] [Google Scholar]
- 44.Fesen MR, Kohn KW, Leteurtre F, Pommier Y. Inhibitors of human immunodeficiency virus integrase. Proc Natl Acad Sci U S A. 1993;90:2399–2403. doi: 10.1073/pnas.90.6.2399. [DOI] [PMC free article] [PubMed] [Google Scholar]
- 45.Fesen MR, Pommier Y, Leteurtre F, Hiroguchi S, Yung J, Kohn KW. Inhibition of HIV-1 integrase by flavones, caffeic acid phenethyl ester (CAPE) and related compounds. Biochem Pharmacol. 1994;48:595–608. doi: 10.1016/0006-2952(94)90291-7. [DOI] [PubMed] [Google Scholar]
- 46.Crosby DC, Lei X, Gibbs CG, McDougall BR, Robinson WE, Reinecke MG. Design, synthesis, and biological evaluation of novel hybrid dicaffeoyltartaric/diketo acid and tetrazole-substituted L-chicoric acid analogue inhibitors of human immunodeficiency virus type 1 integrase. Journal of medicinal chemistry. 2010;53:8161–8175. doi: 10.1021/jm1010594. [DOI] [PubMed] [Google Scholar]
- 47.Gong Q, Menon L, Ilina T, Miller LG, Ahn J, Parniak MA, Ishima R. Interaction of HIV-1 reverse transcriptase ribonuclease H with an acylhydrazone inhibitor. Chemical biology & drug design. 2011;77:39–47. doi: 10.1111/j.1747-0285.2010.01052.x. [DOI] [PMC free article] [PubMed] [Google Scholar]
- 48.Chung S, Himmel DM, Jiang JK, Wojtak K, Bauman JD, Rausch JW, Wilson JA, Beutler JA, Thomas CJ, Arnold E, Le Grice SF. Synthesis, activity, and structural analysis of novel alpha-hydroxytropolone inhibitors of human immunodeficiency virus reverse transcriptase-associated ribonuclease H. Journal of medicinal chemistry. 2011;54:4462–4473. doi: 10.1021/jm2000757. [DOI] [PMC free article] [PubMed] [Google Scholar]
- 49.Reinke RA, King PJ, Victoria JG, McDougall BR, Ma G, Mao Y, Reinecke MG, Robinson WE., Jr Dicaffeoyltartaric acid analogues inhibit human immunodeficiency virus type 1 (HIV-1) integrase and HIV-1 replication at nontoxic concentrations. Journal of medicinal chemistry. 2002;45:3669–3683. doi: 10.1021/jm010359d. [DOI] [PubMed] [Google Scholar]
- 50.Robinson WE, Jr, Cordeiro M, Abdel-Malek S, Jia Q, Chow SA, Reinecke MG, Mitchell WM. Dicaffeoylquinic acid inhibitors of human immunodeficiency virus integrase: inhibition of the core catalytic domain of human immunodeficiency virus integrase. Mol Pharmacol. 1996;50:846–855. [PubMed] [Google Scholar]
- 51.King PJ, Ma G, Miao W, Jia Q, McDougall BR, Reinecke MG, Cornell C, Kuan J, Kim TR, Robinson WE., Jr Structure-activity relationships: analogues of the dicaffeoylquinic and dicaffeoyltartaric acids as potent inhibitors of human immunodeficiency virus type 1 integrase and replication. Journal of medicinal chemistry. 1999;42:497–509. doi: 10.1021/jm9804735. [DOI] [PubMed] [Google Scholar]
- 52.Pandey KK, Bera S, Vora AC, Grandgenett DP. Physical trapping of HIV-1 synaptic complex by different structural classes of integrase strand transfer inhibitors. Biochemistry. 2010;49:8376–8387. doi: 10.1021/bi100514s. [DOI] [PMC free article] [PubMed] [Google Scholar]
- 53.Imoto M, Kakeya H, Sawa T, Hayashi C, Hamada M, Takeuchi T, Umezawa K. Dephostatin, a novel protein tyrosine phosphatase inhibitor produced by Streptomyces. I. Taxonomy, isolation, and characterization. J Antibiot (Tokyo) 1993;46:1342–1346. doi: 10.7164/antibiotics.46.1342. [DOI] [PubMed] [Google Scholar]
- 54.Kakeya H, Imoto M, Takahashi Y, Naganawa H, Takeuchi T, Umezawa K. Dephostatin, a novel protein tyrosine phosphatase inhibitor produced by Streptomyces. II. Structure determination. J Antibiot (Tokyo) 1993;46:1716–1719. doi: 10.7164/antibiotics.46.1716. [DOI] [PubMed] [Google Scholar]
- 55.Uesugi Y, Fuse I, Toba K, Kishi K, Hashimoto S, Furukawa T, Narita M, Takahashi M, Aizawa Y. Inhibition of ATRA-induced myeloid differentiation in acute promyelocytic leukemia by a new protein tyrosine phosphatase inhibitor, 3,4-dephostatin. J Exp Clin Cancer Res. 2000;19:363–366. [PubMed] [Google Scholar]
- 56.Watanabe T, Suzuki T, Umezawa Y, Takeuchi T, Otsuka M, Umezawa K. Structure-activity relationship and rational design of 3,4-dephostatin derivatives as protein tyrosine phosphatase inhibitors. Tetrahedron. 2000;56:741–752. [Google Scholar]
- 57.Watanabe T, Takeuchi T, Otsuka M, Tanaka S, Umezawa K. Synthesis and protein tyrosine phosphatase inhibitory activity of dephostatin analogs. J Antibiot (Tokyo) 1995;48:1460–1466. doi: 10.7164/antibiotics.48.1460. [DOI] [PubMed] [Google Scholar]
- 58.Umezawa K, Kawakami M, Watanabe T. Molecular design and biological activities of protein-tyrosine phosphatase inhibitors. Pharmacol Ther. 2003;99:15–24. doi: 10.1016/s0163-7258(03)00050-0. [DOI] [PubMed] [Google Scholar]
- 59.Hellman U, Wernstedt C, Gonez J, Heldin CH. Improvement of an “In-Gel” digestion procedure for the micropreparation of internal protein fragments for amino acid sequencing. Analytical biochemistry. 1995;224:451–455. doi: 10.1006/abio.1995.1070. [DOI] [PubMed] [Google Scholar]
- 60.Rosenfeld J, Capdevielle J, Guillemot JC, Ferrara P. In-gel digestion of proteins for internal sequence analysis after one- or two-dimensional gel electrophoresis. Analytical biochemistry. 1992;203:173–179. doi: 10.1016/0003-2697(92)90061-b. [DOI] [PubMed] [Google Scholar]
- 61.Clauser KR, Baker P, Burlingame AL. Role of accurate mass measurement (+/- 10 ppm) in protein identification strategies employing MS or MS/MS and database searching. Anal Chem. 1999;71:2871–2882. doi: 10.1021/ac9810516. [DOI] [PubMed] [Google Scholar]
Associated Data
This section collects any data citations, data availability statements, or supplementary materials included in this article.