

Abstract
Objectives
Novel quantitative proteomic approaches were used to study the effects of inhibition of glycogen phosphorylase on proteome and signaling pathways in MIA PaCa-2 pancreatic cancer cells.
Methods
We performed quantitative proteomic analysis in MIA PaCa-2 cancer cells treated with a stratified dose of CP-320626 (25 μM, 50 μM and 100 μM). The effect of metabolic inhibition on cellular protein turnover dynamics was also studied using the modified SILAC method (mSILAC).
Results
A total of twenty-two protein spots and four phosphoprotein spots were quantitatively analyzed. We found that dynamic expression of total proteins and phosphoproteins was significantly changed in MIA PaCa-2 cells treated with an incremental dose of CP-320626. Functional analyses suggested that most of the proteins differentially expressed were in the pathways of MAPK/ERK and TNF-α/NF-κB.
Conclusions
Signaling pathways and metabolic pathways share many common cofactors and substrates forming an extended metabolic network. The restriction of substrate through one pathway such as inhibition of glycogen phosphorylation induces pervasive metabolomic and proteomic changes manifested in protein synthesis, breakdown and post-translational modification of signaling molecules. Our results suggest that quantitative proteomic is an important approach to understand the interaction between metabolism and signaling pathways.
Keywords: Quantitative proteomics, Pancreas cancer, turnover rate, metabolic inhibitor, MAPK/ERK, TNF-α/NF-κB
Introduction
Recent studies have demonstrated an intricate relationship between network of metabolic pathways and the cellular signaling network 1, 2. The result of such interaction is the special metabolic phenotype of proliferating cells in that the utilization of glucose is optimized to supply the necessary energy and substrate for the production of macromolecules (DNA, proteins and membrane lipids) 3–9. A distinctive feature of this phenotype is the Warburg effect which is the preferential use of anaerobic glycolysis rather than the more efficient pathway of aerobic glycolysis for energy production10, 11. The metabolic phenotype is maintained by the opposing metabolic actions of the oncogenes and tumor suppressor genes 1, 2. Conversely, it is well known that interruption of the metabolic network with metabolic inhibitors can bring about cell cycle arrest and apoptosis 12.
The effect of metabolic changes on post-translational modification of signaling molecules such as P53 has been well studied 2, 13. How the effect of metabolic changes impacts on the whole signaling network is poorly understood. In the present study, an attempt was made to perform a comprehensive and comparative analysis of proteins expression and phosphorylation associated with the inhibition of a metabolic pathway by CP-320626 in MIA PaCa-2 cells using a newly established quantitative proteomic approach. CP-320626 is a glycogen phosphorylase inhibitor which is the key enzyme for the degradation of glycogen into glucose-1-phosphate. It was first developed for blood glucose control as potential antidiabetic agents 14, 15. Previously, treatment with CP-320626 was reported to induce cell cycle arrest and apoptosis in cultured MIA pancreatic cells by interrupting the macromolecule synthesis necessary for cell proliferation 16. The present proteomic study showed that inhibition of glycogen phosphorylation by CP-320626 induced dynamic changes of protein signals, which are key components in MAPK/ERK and TNF-α/NF-κB signaling pathways, resulting in cell cycle arrest and apoptosis in the MIA PaCa-2 cell. The dose-dependent proteomic changes induced by CP-320626 suggest a strong link between metabolic and signaling network, and the potential for the identification of “metabolic targets” for cancer therapy through proteomics and metabolomics research.
Materials and Methods
Chemicals and Regents
15N enriched algal amino acid mixture (15N enrichment, 98%) was purchased from Cambridge Isotope Laboratory Inc. (Andover, MA). Fetal bovine serum was purchased from Irvine Scientific (Santa Ana, CA). Dulbecco’s modified Eagles’s medium and antimycotic were from Gibco (Calsbad, CA). Sequencing grade trypsin was purchased from Promega (Madison, WI). Water was prepared using a Milli-Q system (Millipore, Bedford, MA). Other chemicals employed were purchased from Sigma (St. Louis, MO).
Cell Culture
MIA PaCa cells were cultured in MEM containing natural amino acids or 50% of 15N algal amino acid mixture (15N enrichment, 98%) as previously described 17, 18, with slight modification. Briefly, MIA PaCa-2 cells were adapted to grow in MEM supplemented with 10% fetal bovine serum, 1% antibiotic antimycotic, and 5% CO2 at 37 °C until 85–95% confluence when the experiment started. Experiments were set up in five groups: group A, cells were cultured in MEM medium containing 1 mg/mL of natural amino acids; group B, cells with 50% of 15N algal amino acid mixture; group C, cells with 50% of 15N algal amino acid mixture plus 25 μM CP-320626; group D, cells with 50% of 15N algal amino acid mixture plus 50 μM CP-320626; and group E, cells with 50% of 15N algal amino acid mixture plus 100 μM CP-320626. Each treatment was repeated four times using/in four flasks with 10 mL/flask. After incubation for 48 h, the cell pellets were collected and stored at −80 °C.
Protein sample preparation
For 2-DE analysis, the cell pellets were washed with ice-cold PBS, treated with 300 μL of lysis buffer [7 M urea, 2 M thiourea, 4% CHAPS, 100 mM DTT, 5% glycerol, protease inhibitor set III (100 mM AEBSF, 80μM aprotinin, 5 mM bestatin, 1.5 mM E-64, 2 mM leupeptin, 1mM pepstatin) (Calbiochem, La Jolla, CA), phosphatase set II (200 mM imidazole, 100 mM sodium fluoride, 115 mM sodium molybdate, 100 mM sodium orthovanadate, 400 mM sodium tartrate dehydrate) (Calbiochem, La Jolla, CA), 0.2% biolyte 3–10, 0.1% biolyte 4–6, and 0.1% biolyte 5–8], and sonicated for 3 × 5 s. The mixture was spun down at maximum speed at 15 °C for 10 min. The protein concentration in the supernatant was measured by Bradford assay using bovine serum albumin as the standard. The samples were stored at −80 °C until analysis.
Two-Dimensional Gel Electrophoresis
Five hundred micrograms of proteins were mixed with a rehydration solution containing 7 M urea, 2 M thiourea, 4% CHAPS, 50 mM DTT, 0.2% biolyte 3–10, 0.1% biolyte 4–6, and 0.1% biolyte 5–8, and a trace of bromophenol blue to a total volume of 300 μL. The mixtures were pipetted into IPG strip holder channels. After 14 h of rehydration, the strips were transferred to an isoelectric focusing (IEF) cell (Bio-Rad, Hercules, CA). Prefocusing and focusing were performed on a Protean IEF cell (500 V hold 2.5 h, linear 500–1000 V increase 1 h, 1000 V hold 1 h, linear 1000–8000V increase 1.5 h, and 8000 V hold 60,000 KV h). Following IEF separation, the equilibration was done by incubating with equilibration buffer I and II (37.5 mM Tris-Cl, pH 8.8, 20% glycerol, 2% SDS, 6 M urea, with 2% DTT in buffer I and 2.5% iodoacetamide in buffer II, respectively). The second dimension electrophoresis was run on 8–16% Tris-HCl gel in a Protean Plus Dodeca cell (Bio-Rad, Hercules, CA) until the bromophenol blue reached the bottom of the gels. After 2-DE, the gels were stained with SYPRO-Ruby (Molecular Probes, Eugene, OR) or visualized with the Coomassie Brilliant Blue R-250 (Merck, Germany). The phosphorylated proteins were stained with Pro-Q Diamond 19, 20. Following 2-DE and protein staining, gels were then scanned with a Pharox FX molecular imager (Bio-Rad, Hercules, CA) with a 532 nm laser excitation and a 580 nm band-pass emission filter. The differential protein spots were identified using PDQuest (8.1.0.0) 2-DE analysis software (Bio-Rad, Hercules, CA). The intensity of each protein spot was normalized to the total intensity of the entire gel image.
In-gel Trypsin Digestion
Spots of interest were excised from the gels and transferred to Eppendorf LoBind tubes (Eppendorf, Hamburg, Germany). Gel pieces were destained with 100mM ammonium bicarbonate in 30% ACN until transparent and dried in a vacuum centrifuge as described by Jiang et al. 21. Proteins were proteolyzed with 25 ng of modified trypsin (Promega, Madison, WI) in 25 mM ammonium bicarbonate for 20 h or overnight at 37 °C. Supernatant was collected, and peptides were further extracted twice with 0.1% TFA, 60% ACN with vortexing for 45 min at room temperature. Peptides extracts were vacuum-dried.
MALDI-TOF-MS
For mass spectrometric analysis, the peptides were taken up in 10 μL of 0.1% TFA and purified with a C18 ZipTip (Millippore, MA). A volume of 2 μL of CHCA matrix in 50% ACN/0.1% TFA was used to elute peptide onto the ground steel plate (Bruker, Germany). A matrix-assisted laser desorption ionization time-of-flight/time-of-flight (MALDI-TOF/TOF) mass spectrometer (Ultraflex III, Bruker, Germany) was used for the peptide fingerprint in the reflector mode and sequence analysis in the “lift” mode. MALDI-TOF spectra were recorded in the positive ion reflectron mode over a mass range of 600–4000 Da, and the ion acceleration voltage was 25 kV. After analysis of the peptide mass fingerprinting (PMF) results by FlexAnalysis 2.2 (Bruker Daltonics GmbH, Germany), the proteins were subjected to MS/MS analysis in the “lift” (second ion source in the TOF/TOF instrument) mode. Some strong peaks of each PMF spectra were selected as precursor ions, which were accelerated in TOF1 at a voltage of 8 kV and fragmented by lifting the voltage to 19 kV.
Protein Identification and Spectral Data Analysis
The MS/MS data were searched against Homo sapiens proteins (20338 sequences) in the SWISS-PROT database (release SwissProt 57.15) using the in-housed Mascot search program (Matrix Science, London, United Kingdom, www.matrixscience.com). Search parameters were set as follows: enzyme, trypsin; allowance of up to one missed cleavage peptide; fixed modification parameter, carbamidomethylation (C); variable modification parameters, oxidation (at Met). The tolerance for the parent ion is 100 ppm, and for the daughter ion is 0.3 Da. Protein or peptide score with p < 0.05 was regarded as significant. In the case of peptides matching to multiple members of a protein family, the positive identified protein was selected based on both the highest score and the highest number of matching peptides. The peaks were externally calibrated with peptide standards from Bruker (MH1: angiotensin II, 1046.5420 Da; angiotensin I, 1296.6853 Da; substance P, 1347.7361 Da; bombesin, 1619.823 Da; ACTH clip 18–39, 2465.199 Da).
The synthesis rates of the differential proteins were calculated according to our in-house algorithms 18, 19. The synthesis rate of each protein is the average of three to four fragments. One-way ANOVA with the Tukey’s adjustment was used for multiple comparisons in SPSS 13.0 (SPSS Inc., Chicago, IL).
In vitro cytotoxic activity
The cell cytotoxicity of CP-320626 against the MIA PaCa-2 cells was determined by MTT assay 22, 23. The cells at exponential phase were dispensed in 96-well plates at a density of 2× 10⁴ cells per well. The cells were incubated in different concentrations of CP-320626. After 48h incubation with the CP-320626, 20 μl MTT (3-(4, 5-dimethylthiazol-2-yl)-2, 5-diphenyl tetrazolium bromide) (Sigma, USA) reagent was added into each well for 4 h. The medium was discarded and 100 μl of dimethyl sulfoxide (Sigma, USA) was added into each well and incubated for 10 min. The optical density of each well was measured with Multiskan Ascent (Thermo, USA). The cell viability and IC50 value were calculated by the following equations: cell viability = mean optical density of experimental group/mean of the control × 100%; IC50 value=concentration of CP-320626 at 50% cell viability 22, 23.
Western blot analysis
Western blotting analysis was performed as described previously 24. In brief, whole-cell extracts were prepared by lysing cells. Lysates containing 50 μg proteins were subjected to gel electrophoresis. Proteins were then transferred to PVDF membranes (Millipore, CA). The blots were blocked in superBLOCK T20 blocking buffer (Pierce, Rockford, IL) for 1 h at room temperature, and then incubated at 24°C for 2 h with the primary antibody. Cyclin D1, p21, and p27 were purchased from Millipore, USA. Anti-β-actin was obtained from Sigma (Sigma-Aldrich, MA) and served as loading control. After incubation with secondary antibodies (GE healthcare, Piscataway, NJ) at room temperature for at least 1 h, the blot was visualized with an enhanced chemiluminescence (ECL) detection system (Pierce Biotech Inc., Rockford, IL).
Ingenuity Pathway Analysis
Ingenuity Pathway (Ingenuity Systems, Inc., Redwood City, CA, www.ingenuity.com) analysis assigned to the overall analysis based on findings in the scientific literature and those stored in the Ingenuity Pathways Knowledge Base.
Results
CP-320626 Caused MIA PaCa-2 Cell Cycle Arrest and Apoptosis
Previous studies suggest that the glycogen phosphorylase inhibitor CP-320626 induces apoptosis and inhibits cancer cell proliferation through limiting glucose oxidation 16, 25. However, how the metabolic inhibition on glycogen phosphorylase by CP-320626 interacted with cellular signaling pathways resulting in apoptosis is unknown. In the present study, the effects of CP-320626 on MIA PaCa-2 cell proliferation were firstly assessed using MTT assay (Fig. 1A). Results showed that CP-320626 inhibited the growth of the cancer cells, and increased the death of MIA PaCa-2 cells in a dose-dependent manner with an IC50 of 222.49 μM. To investigate the dynamic changes at the protein level, MIA PaCa-2 cells were treated with three different concentrations of CP-320626 (25 μM, 50 μM, and 100 μM). The expression of cell cycle biomarkers such as p21, p27, and cyclin D1 were analyzed by western blotting to study the effects of CP-320626 on cell cycle activity in MIA PaCa-2 cells (Fig. 1B). P21 and p27, the negative regulators of cell cycle, were increased upon the CP-320626 treatments 26. Conversely, cyclin D1, the positive regulator of cell cycle, was found to be decreased 27. These data suggest that cell cycle was significantly inhibited by CP-320626 in a stratified dose level. It has been reported that cell cycle negative regulator p21 can be also transactivated by tumor suppressor gene p53 leading to G1 phase arrest 28. To find out whether CP-320626 also caused cancer cell pre-apoptosis, we examined the levels of p53 expression in MIA PaCa-2 cells in response to a stratified doses of CP-320626 29, 30. The results showed that an elevated dose of CP-320626 caused over-expression of p53, suggesting that CP-320626 caused cell pre-apoptosis (Fig. 1B).
Fig. 1. CP-320626 causes cell cycle arrest and cell apoptosis in MIA cells through the MAPK pathway.
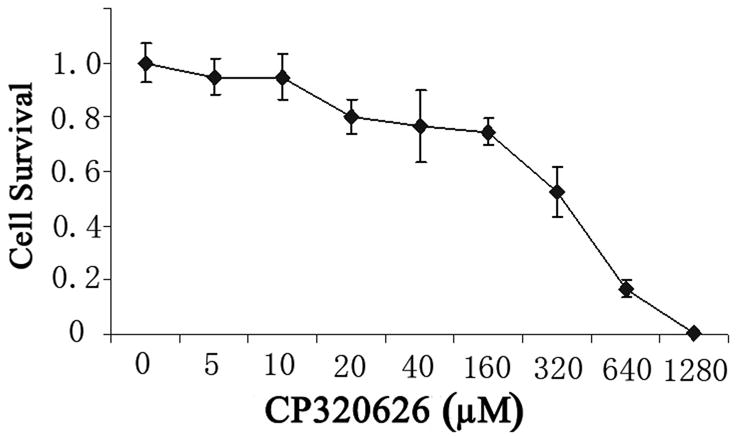
A. The effects of CP-320626 on MIA PaCa-2-2 cell proliferation using MTT assay. CP-320626 could inhibit the growth and enhance the death of MIA PaCa-2-2 cells in a dose-dependent manner. IC50 of CP-320626 for MIA PaCa-2-2 cells was 222.49 μM. B. The expression of p21, p27, cyclin D1, and p53 were analyzed by western blotting to validate the effects of CP-320626 on cell cycle activity and cell apoptosis in MIA PaCa-2-2 cells.
Proteomic Analysis of the MIA PaCa-2 Cells Treated with CP-320626
To study the effect of metabolic inhibition of glycogen phosphorylase by CP-320626 on protein expression, we analyzed cellular protein expression using a newly established method 18. Protein expression profiles in MIA PaCa-2 cells treated with and without CP-320626 are shown in Figure 2A. Differentially expressed proteins in MIA cells treated with a hierarchical dose of CP-320626 were selected according to a criterion of the intensity of a spot in the gels showing less or greater than 2-fold difference (p<0.05) determined by using PDQuest software (Bio-Rad, Hercules, CA). A total of 22 protein spots were analyzed and identified by using MALDI-TOF MS/MS and protein identities are listed in Table 1, which showed that inhibition of glycogen phosphorylase by CP-320626 significantly affected dynamics of protein expression. Among twenty-two proteins identified, thirteen proteins were significantly suppressed and nine proteins were significantly enhanced (Table 1).
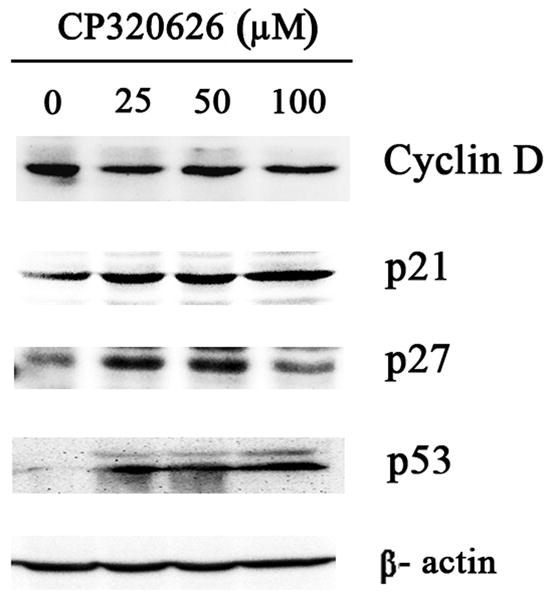
Fig. 2. Proteomic analysis of the MIA PaCa-2-2 cells treatment with CP-320626.

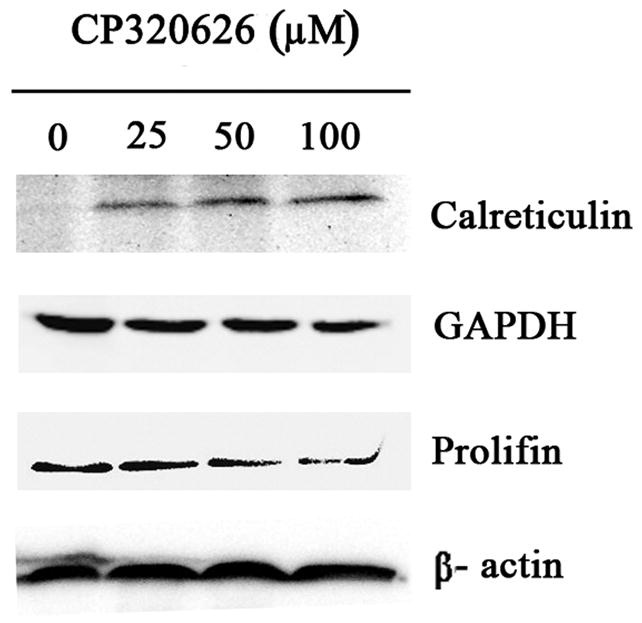
A. Two-DE patterns of whole-cell proteins obtained from MIA PaCa-2-2 cells treated with CP-320626 (0 μM, 25 μM, 50 μM, and 100 μM). These 2D gels were stained by SYPRO Ruby. Based on PDQuest software analysis, ratios of normalized spot intensities of four different concentrations of CP-320626 were calculated, and spots showing more than 2.0-fold difference with statistical significance (p<0.05) were selected. A total of 22 spots on 2-D gel were labeled with arrows. B. The validation of three differential proteins (profilin, calreticulin, and GAPDH) by western blotting. Results were consistent with the 2-DE patterns for these three proteins.
Table 1.
Identification of Differentially Expressed Proteins of the MIA PaCa-2-2 Cells Treated with CP-320626 by MALDI-TOF/TOF MS
| Spot No.a | Accession Number | Protein name | Scoreb | Sequence Coverage (%) | m/z | Pep(Score)c | No. of Matched peptides | Caculated MW/pI | Turnover rate (%)d | ||
|---|---|---|---|---|---|---|---|---|---|---|---|
| PMF | MS/MS | PMF | MS/MS | ||||||||
| Up-regulated protein of the MIA PaCa-2-2 cells Treated with CP-320626 | |||||||||||
| 1 | P27797 | Calreticulin | 74 | 104 | 40 | 5 | 2856.1499 | (163)CKDDEFTHLYTLIVRPDNTYEVK(185) (104) | 8 | 48283/4.29 | 55 |
| 5 | Q01105 | Protein SET | 54 | 35 | 23 | 8 | 1063.6176 | (76)LRQPFFQK(83) (20) | 5 | 33469/4.23 | 67 |
| 2304.0354 | (133)SGYRIDFYFDENPYFENK(150) (15) | ||||||||||
| 6 | P47755 | F-actin-capping protein subunit alpha-2 | 52 | 49 | 22 | 9 | 1197.7813 | (22)LLLNNDNLLR(37) (16) | 4 | 33157/5.57 | 46 |
| 2101.1854 | (38)FIIHAPPGEFNEVFNDVR(47) (33) | ||||||||||
| 12 | P22626 | Heterogeneous nuclear ribonucleoproteins A2/B1 | 84 | 68 | 31 | 8 | 1377.6936 | (214)GGGGNFGPGPGSNFR(228) (43) | 8 | 37464/8.97 | 57 |
| 1798.9808 | (23)LFIGGLSFETTEESLR(38) (25) | ||||||||||
| 13 | P63244 | Guanine nucleotide-binding protein subunit beta-2-like 1 | 61 | 51 | 27 | 5 | 1982.0167 | (140)YTVQDESHSEWVSCVR(155) (51) | 5 | 35511/7.60 | 47 |
| 16 | Q9Y2P8 | RNA 3′-terminal phosphate cyclase-like protein | 72 | 26 | 21 | 3 | 1684.8055 | (175)KVLKPIQLTDPGK(187) (26) | 6 | 41273/9.36 | 48 |
| 17 | Q7L523 | Ras-related GTP-binding protein A | 79 | 100 | 31 | 11 | 1615.0127 | (153) SNYNFEKPFLWLAR (166) (31) | 7 | 24579/7.01 | 52 |
| 1741.0387 | (100) K.NVPNWHR (106) (97) | ||||||||||
| 18 | P15531 | Nucleoside diphosphate kinase A | 58 | 32 | 34 | 7 | 1344.7903 | (7)TFIAIKPDGVQR918) (32) | 5 | 17309/5.83 | 52 |
| 20 | P60660 | Myosin light polypeptide 6 | 71 | 30 | 55 | 10 | 1904.1181 | (64)VLDFEHFLPMLQTVAK(79) (30) | 10 | 17090/4.56 | 74 |
|
| |||||||||||
| Down-regulated proteins of the MIA PaCa-2-2 cells Treated with CP-320626 | |||||||||||
| 2 | P31943 | Heterogeneous nuclear ribonucleoprotein H | 106 | 306 | 34 | 18 | 1504.5409 | (17)GLPWSCSADEVQR(29) (46) | 11 | 49484/5.89 | 69 |
| 1684.5941 | (99)HTGPNSPDTANDGFVR(114) (35) | ||||||||||
| 1841.6673 | (151)HTGPNSPDTANDGFVR(167) (64) | ||||||||||
| 1996.7140 | (300)ATENDIYNFFSPLNPVR(316) (100) | ||||||||||
| 2141.7573 | (356)YVELFLNSTAGASGGAYEHR(375) (60) | ||||||||||
| 3 | P31943 | Heterogeneous nuclear ribonucleoprotein H | 134 | 243 | 41 | 18 | 1504.6935 | (17)GLPWSCSADEVQR(29) (33) | 12 | 49484/5.89 | 67 |
| 1684.7972 | (99)HTGPNSPDTANDGFVR(114) (36) | ||||||||||
| 1841.9464 | (151)HTGPNSPDTANDGFVR(167) (65) | ||||||||||
| 1997.0244 | (300)ATENDIYNFFSPLNPVR(316) (64) | ||||||||||
| 2142.0843 | (356)YVELFLNSTAGASGGAYEHR(375) (44) | ||||||||||
| 4 | Q86VC0 | 40S ribosomal protein SA | 127 | 159 | 49 | 30 | 1203.7121 | (90)FAAATGATPIAGR(102) (31) | 13 | 32947/4.79 | 38 |
| 1614.9305 | (167)GAHSVGLMWWMLAR(180) (36) | ||||||||||
| 1741.0202 | (64)AIVAIENPADVSVISSR(60) (104) | ||||||||||
| 2081.1482 | (103)FTPGTFTNQIQAAFREPR(120) (34) | ||||||||||
| 2996.6506 | (129)ADHQPLTEASYVNLPTIALCNTDSPLR(155) (65) | ||||||||||
| 7 | P04083 | Annexin A1 | 124 | 197 | 42 | 17 | 1262.6369 | (114)TPAQFDADELR(124) (31) | 11 | 38918/6.57 | 52 |
| 1543.9049 | (59)GVDEATIIDILTKR(72) (66) | ||||||||||
| 1702.9325 | (129)GLGTDEDTLIEILASR(144) (59) | ||||||||||
| 2067.9365 | (186)GDRSEDFGVNEDLADSDAR(204) (42) | ||||||||||
| 8 | Q6GMP2 | Alpha-enolase | 106 | 36 | 41 | 7 | 1691.9124 | (407)YNQLLRIEEELGSK(420) (11) | 13 | 47481/7.01 | 42 |
| 2176.0736 | (234)AGYTDKVVIGMDVAASEFFR(253) (36) | ||||||||||
| 9 | P04406 | Glyceraldehyde-3-phosphate dehydrogenase | 74 | 104 | 30 | 9 | 1763.8319 | (310)LISWYDNEFGYSNR(323) (83) | 6 | 36201/8.57 | 65 |
| 2041.1514 | (67)LVINGNPITIFQERDPSK(84) (22) | ||||||||||
| 10 | P04406 | Glyceraldehyde-3-phosphate dehydrogenase | 79 | 74 | 49 | 4 | 1763.7314 | (310)LISWYDNEFGYSNR(323) (74) | 10 | 36201/8.57 | 52 |
| 11 | P04406 | Glyceraldehyde-3-phosphate dehydrogenase | 59 | 122 | 32 | 11 | 1763.8625 | (310)LISWYDNEFGYSNR(323) (104) | 8 | 36201/8.57 | 57 |
| 2595.414 | (163)VIHDNFGIVEGLMTTVHAITATQK(186) (55) | ||||||||||
| 14 | P18669 | Phosphoglycerate mutase 1 | 100 | 52 | 46 | 14 | 1935.9489 | (47)DAGYEFDICFTSVQKR(62) (22) | 8 | 28900/6.67 | 45 |
| 2425.2106 | (142)YADLTEDQLPSCESLKDTIAR(162) (30) | ||||||||||
| 15 | P18669 | Phosphoglycerate mutase 1 | 156 | 50 | 61 | 4 | 1150.6759 | (181)VLIAAHGNSLR(191) (50) | 11 | 28900/6.67 | 49 |
| 19 | P16949 | Stathmin | 57 | 65 | 15 | 8 | 1388.9877 | (15)ASGQAFELILSPR(27) (65) | 3 | 17292/5.76 | 31 |
| 21 | P14174 | Macrophage migration inhibitory factor | 58 | 68 | 40 | 32 | 1287.7532 | (2)PMFIVNTNVPR(12) (60) | 5 | 12639/7.74 | 53 |
| 1303.7592 | (2)PMFIVNTNVPR(12) (38) | ||||||||||
| 2995.5631 | (90)ISPDRVYINYYDMNAANVGWNNSTFA(115) (8) | ||||||||||
| 22 | P07737 | Profilin-1 | 62 | 198 | 33 | 22 | 1915.1441 | (39)TFVNITPAEVGVLVGKDR(56) (144) | 6 | 15216/8.44 | 59 |
| 1625.8061 | (76)DSLLQDGEFSMDLR(89) (54) | ||||||||||
As labeled on the 2-D gel (see Fig. 2A).
Molecular weight search (MOWSE) scores obtained by the combined search (PMF and lift data) that were assigned to specific protein identity using the Mascot engine. The tolerance for parent ion and daughter ion is 100 ppm and 0.3 Da, respectively. Fixed modification parameter, carbamidomethylation (C); variable modification parameters, oxidation (at Met).
Peptides identified by Ultraflex MALDI-TOF/TOF in the “lift” mode and individual peptide score (lift data) in the parentheses. The superscript number represents the start and end amino acid.
To confirm the expression of these identified proteins, three proteins were selected for further analysis by western blot (Fig. 2B). The expression of calreticulin was expectedly increased by an incremental dose of CP-320626. Conversely, the expression of two other proteins selected, Profilin and GAPDH, was decreased as the dose increased (Fig. 2B). These results suggested that the expression pattern on the 2-D map of proteins identified can be confirmed by Western blotting analysis.
CP-320626 Interrupted Protein Synthesis Rate
Protein expression is the result of protein synthesis and degradation in cells. The understanding of the dynamics of protein turnover is key to the understanding of regulation of protein expression in cells 31, 32. The protein turnover rate may be also an indicative factor reflecting the functional significance of the protein, especially in drug-treated cells. Proteins with high protein turnover rate, in which protein synthesis is more than its degradation, may be actively involved in cell physiological process. In the present study, we were able to determine the fraction of new synthesis (in 48 hours) in 18 proteins represented by 22 protein spots by our recently developed method (Table 1) 17, 18. Stathmin and 40S ribosomal protein SA had low turnover rates (<40%). Alpha-enolase, F-actin-capping protein subunit alpha-2, guanine nucleotide-binding protein subunit beta-2-like 1, RNA 3′-terminal phosphate cyclase-like protein and phosphoglycerate mutase 1 showed turnover rates between 40% and 50% in 48 hours. Eight proteins (Ras-related GTP-binding protein A, nucleoside diphosphate kinase A, annexin A1, macrophage migration inhibitory factor, calreticulin, heterogeneous nuclear ribonucleoproteins A2/B1, glyceraldehyde-3-phosphate dehydrogenase and profilin-1) showed turnover rates between 50% and 60%. Glyceraldehyde-3-phosphate dehydrogenase, protein SET, heterogeneous nuclear ribonucleoprotein H, and myosin light polypeptide 6 displayed the highest turnover rate, at more than 60% (Table 1).
We also examined the dose-dependent relationship of protein synthesis to CP-320626 treatment in MIA PaCa cells (Table 2). Because of the low protein concentration recovered from the 2-D gel, we were only able to determine the fraction of new synthesis in nine proteins at the various doses of CP-320626. The effect of 15N incorporation on the isotopomer distribution of a peptide from protein spot #9 is illustrated in Figure 3. The isotopomer distribution of fragment 1763 m/z in spot #9 is shown in Figure 3A–C. Figure 3A shows the distribution of the unlabeled (natural) fragment from the control medium. The spectrum in Figure 3B is from the same peptide obtained from cells grown in 50% 15N enriched medium, showing the obvious spectrum shift in mass. The spectrum in Figure 3C was from the same peptide obtained from cells grown in 50% 15N and 100 μM CP-320626 enriched medium, which showed smaller mass shift than that of 50% 15N enrichment only. Turnover rates were then calculated by multiple linear regression analysis of the observed peptide spectrum. The fraction of new synthesis of the peptide was reduced from 65% to 50% by CP-320626 treatment. Using a Mascot database search, we determined that the sequence of the peptide shown in Figure 3D is part of Glyceraldehyde 3-phosphate dehydrogenase (GAPDH) (Fig. 3D). Table 2 shows the dose response of the fraction of new synthesis (% new synthesis in 48 hours) of nine proteins. Six of these proteins were down-regulated and the remaining three were up-regulated. Fraction of new synthesis was decreased in the down-regulated proteins, while new synthesis of up-regulated proteins was increased, suggesting synthesis is less than degradation in the down-regulated proteins, and that there is the opposite relationship between synthesis and degradation for the up-regulated protein. Calreticulin was convincingly shown to be increasing with CP-320626 treatment by western blotting (Fig. 2B). However, its turnover rate was no different from 15N only in CP-320626-treated cells. It may be that Calreticulin was degraded more slowly in CP-320626-treated cells.
Table 2.
CP-320626 Interrupted Protein Synthesis Rate*
| Protein Name | Fraction of New Protein Synthesis Caused by CP-320626(μM)
|
Expression Change | |||
|---|---|---|---|---|---|
| 25 | 50 | 100 | 15N only | ||
| Glyceraldehyde-3-phosphate dehydrogenase | 58% | 53% | 50% | 65% | Down-regulated |
| Heterogeneous nuclear ribonucleoprotein H | 66% | 62% | 60% | 69% | Down-regulated |
| 40S ribosomal protein SA | 27% | 33% | 28% | 38% | Down-regulated |
| Annexin A1 | 57% | 50% | 42% | 52% | Down-regulated |
| Phosphoglycerate mutase 1 | 49% | 44% | 42% | 49% | Down-regulated |
| Macrophage migration inhibitory factor | 50% | 48% | 50% | 53% | Down-regulated |
| Heterogeneous nuclear ribonucleoproteins A2/B1 | 63% | 76% | 74% | 58% | Up-regulated |
| Nucleoside diphosphate kinase A | 47% | 56% | 54% | 52% | Up-regulated |
| Calreticulin | 57% | 55% | 53% | 55% | Up-regulated |
Protein synthesis rate is expressed as percent new synthesis in 48 hours.
Fig. 3. CP-320626 interrupted protein synthesis rate of GAPDH.
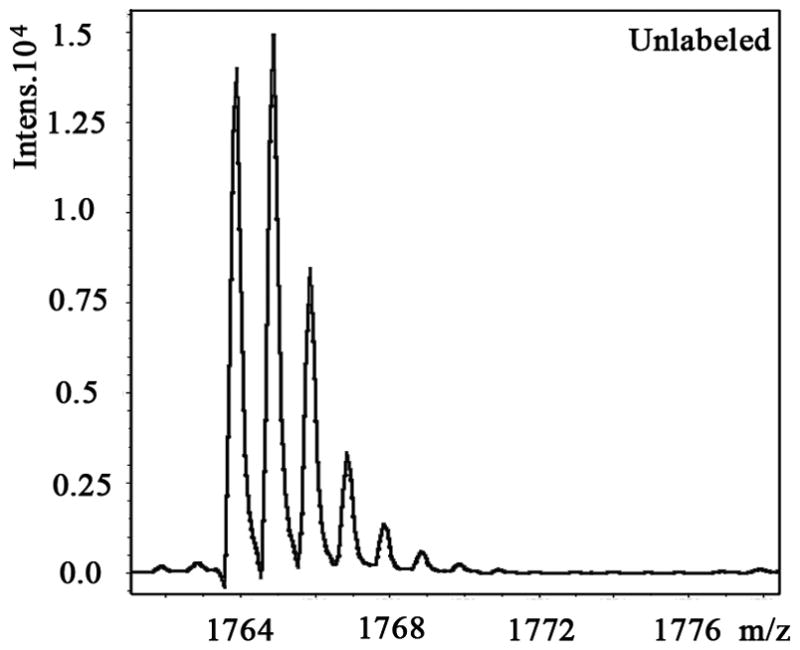
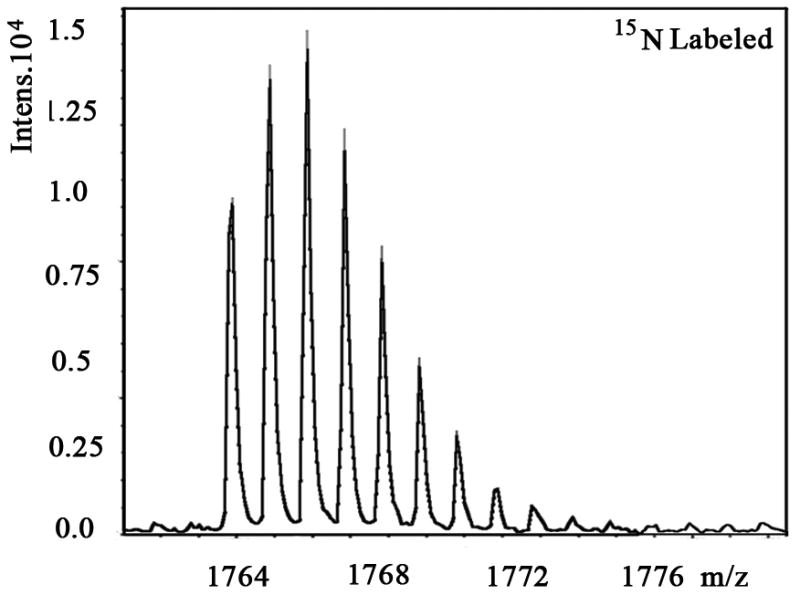
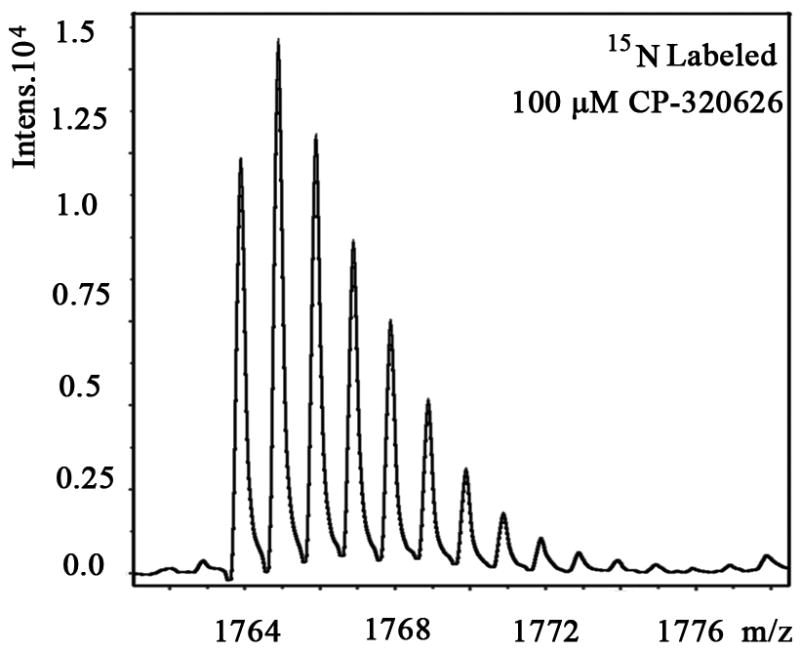
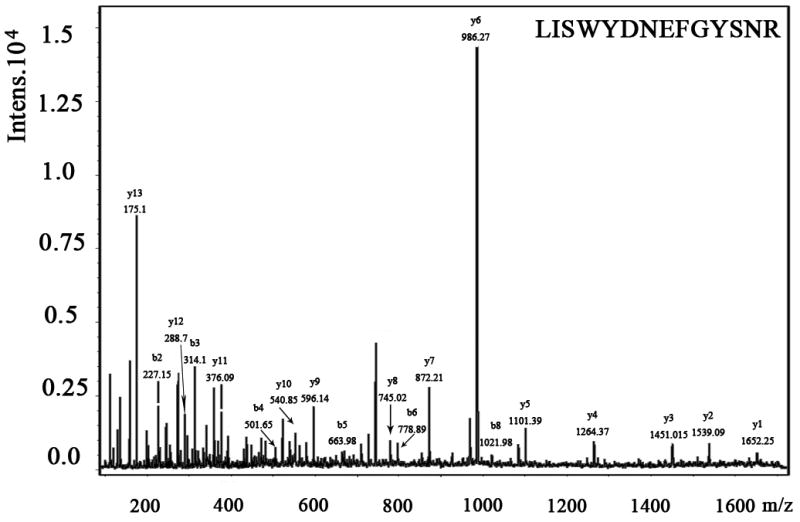
MS spectra of 1763 m/z fragment from GAPDH of lysates of cells grown in the presence of natural amino acids (A), 50% enriched 15N algal amino acid mixtures (B), 50% enriched 15N algal amino acid mixtures and 100 μM CP-320626 (C). The synthesis rate of a protein was based on the isotopomer distribution of these spectra. D. MS/MS spectrum of this fragment in the “lift” mode. Sequences were confirmed from the labeled b- and y-ions in the spectrum.
CP-320626 Suppressed Expression of the Cellular Phosphoproteome
Reversible phosphorylation of protein is one of the most important posttranslational modifications involved in regulation of many of the fundamental cellular activities, such as energy storage and utilization, cell-cycle progression, cellular division and apoptosis, and gene transcription and differentiation. In the present study, Pro-Q Diamond phosphoprotein gel stain has been used to display the phosphoproteome maps of CP-320626-treated MIA PaCa-2 cells. The expression profile patterns of cellular phosphorylated proteins of MIA PaCa-2 were significantly reduced following the increase of CP-320626 concentration (Fig. 4). Four proteins (tyrosine-protein kinase ZAP-70 (ZAP70), F-actin-capping protein subunit alpha-2 (CAZ2), loss of heterozygosity 12 chromosomal region 1 protein (LOH12CR1), and eukaryotic translation initiation factor 5A-1(EIF5A)) were identified by MALDI-TOF MS/MS following in-gel digestion of each spot (Table 3). These four proteins, which belong to protein kinases or phosphorylated proteins, were involved in signal transduction, cancer, apoptosis, and cellular differentiation. ZAP70 is phosphorylated on tyrosine residues upon T-cell antigen receptor (TCR) stimulation. It plays a vital role in T-cell development and lymphocyte activation and induces TCR-mediated signal transduction 33, 34. Defects in ZAP70 are the causes of a selective T-cell defect, which is an autosomal recessive form of severe combined immunodeficiency characterized by a selective absence of CD8-type T-cells 35, 36. F-actin-capping proteins bind to the fast-growing ends of actin filaments in a Ca2+-independent manner, thereby blocking the exchange of subunits at these ends 37. CAZ2 has been reported to be amplified in glioblastomas, breast cancer, and human renal cell carcinoma 38–40. CAZ2 may play a role in regulating tumor-specific aspects of cell motility. LOH12CR1 is a recently characterized gene whose function has not yet been determined 41. Researchers have revealed that phosphorylated LOH12CR1 was associated with T-cell receptor signaling by quantitative phosphoproteomic analysis 42. LOH12CR1 family proteins were characterized in the critical region associated with childhood acute lymphoblastic leukemia 43. Eukaryotic translation initiation factor 5A-1 is involved in cell cycle progression, mRNA decay, and probably in a pathway involved in stress response and maintenance of cell wall integrity. It has an important function as a regulator of TP53/p53 and TP53/p53-dependent apoptosis 44, 45. Some studies revealed eIF5A-1 could be considered as a diagnostic marker for aberrant proliferation in intraepithelial neoplasia of the vulva 46. Taken together, the MIA PaCa-2 cells’ treatment with CP-320626 displayed a dose-dependent decreased profile patterns of the phosphoproteome. However, only some of the signaling and phosphorylated proteins were identified and annotated in this study. In the future, characterization of the cellular proteome may provide a valuable resource for the phosphorylated changes of CP-320626 treatment or treatment with other metabolic inhibitors.
Fig. 4. The expression patterns of phosphorylated proteins by two-dimensional gel electrophoresis.

The expression profile patterns of cellular phosphorylated proteins of MIA PaCa-2-2 were significantly reduced following the increase of CP-320626 concentration. Four proteins (tyrosine-protein kinase ZAP-70 (ZAP70), F-actin-capping protein subunit alpha-2 (CAZ2), loss of heterozygosity 12 chromosomal region 1 protein (LOH12CR1), and eukaryotic translation initiation factor 5A-1(EIF5A)) were identified by MALDI-TOF MS/MS following in-gel digestion of each spot (Table 3).
Table 3.
Identification of Differentially Expressed Phosphorylated Proteins of the MIA PaCa-2 cells Treatment with CP-320626 by MALDI-TOF/TOF MS
| Accession Number | Protein name | Idenfication method | Sequence Coverage | Caculated MW/pI | Post-translational modification | Functional annotation | Associated diseases | Reference |
|---|---|---|---|---|---|---|---|---|
| P43403 | Tyrosine-protein kinase ZAP-70 | PMF | 17% | 70796/7.78 | Protein kinase | T-cell development, activation and induces TCR-mediated signal transduction | Selective T-cell defect | Ref. (33–36) |
| P47755 | F-actin-capping protein subunit alpha-2 | PMF and MS/MS | 18% | 33157/5.57 | Phosphorylated protein | Regulate cell motility | Glioblastomas, breast cancer and human renal cell carcinoma | Ref. (37–40) |
| Q969J3 | Loss of heterozygosity 12 chromosomal region 1 protein | PMF | 43% | 22322/5.97 | Phosphorylated protein | T cell receptor signaling | Childhood acute lymphoblastic leukemia | Ref. (41–43) |
| P63241 | Eukaryotic translation initiation factor 5A-1 | PMF and MS/MS | 40% | 17049/5.08 | Phosphorylated protein | Cell cycle progression, mRNA decay, stress response and maintenance of cell wall integrity | Aberrant proliferation in intraepithelial neoplasia of the vulva | Ref. (44–46) |
Functional Characteristics of the Differentially Expressed Proteins
To examine the functional role of the proteins identified in this study, all 21 differential proteins, which represented 22 protein spots and 4 phosphorylated protein spots, were uploaded to Ingenuity (www.ingenuity.com). Nineteen of these proteins were annotated in Ingenuity. Figure 5A showed the proportion of each functional class with statistical significance (p<0.05) in the following: (a) cell signaling (nine proteins, 23.7%), (b) DNA replication, recombination, and repair (five proteins, 13.2%), (c) nucleic acid metabolism (five proteins, 13.2%), (d) small molecule biochemistry (10 proteins, 29.3%), and (e) molecular transport (five proteins, 13.2%). Moreover, many proteins were involved in the pathway associated with diseases, including cancer (11 proteins, 31.4%), inflammatory response (five proteins, 14.3%), gastrointestinal disease (five proteins, 14.3%), cardiovascular disease (four proteins, 11.4%), and neurological disease (10 proteins, 28.6%) (Fig. 5B). Further network analysis via Ingenuity was applied to reveal these main signaling pathways involved in the treatment of CP-320626. The 17 differential proteins found in the study were mostly in the pathways for MAPK/ERK and TNF-α/NF-κB (Fig. 5C).
Fig. 5. Functional characteristics of the differential proteins.


A. Functional classification of differentially expressed proteins. B. Classification of differential expressed proteins in the diseases and disorders. C. Network analysis via Ingenuity showed that 17 differential proteins found in the study were mostly in the pathways for MAPK/ERK and TNF-α/NF-κB.
Discussion
Despite progress in the understanding of oncogenes and signaling pathways in cancer biology, metabolic inhibitors/anti-metabolites (small molecules) remain the most effective chemotherapeutic agents. These metabolic inhibitors exert pervasive effects on the vulnerable areas of total cellular metabolism in cancer cells, eventually resulting in cancer cell death. How such diffused (non-specific) metabolic signals converge on known signaling pathways involved in cell cycle progression and apoptosis is largely unknown. The results of the present study suggest that signaling pathways and metabolic pathways form an integrated network (Figure 6), which is regulated by the shared pools of energy (ATP) and substrate supplies. Dose dependent perturbation of the metabolic network thus can lead to perturbation of energy and substrate supplies leading to metabolic changes, proteomic and signaling pathway changes, cell cycle arrest and/or apoptosis.
Fig. 6. Schematic representation of the network of metabolic and signaling pathways in proliferating cells treated with CP-320626.

This schema shows the interconnected network of the key metabolic and signaling pathways, including glycolysis, oxidative phosphorylation, the pentose phosphate pathway, and critical cell signaling pathways. Biological macromolecular synthesis can be influenced by these key metabolic and signaling pathways. The critical metabolic and signaling pathways are labeled in blue with boxes. The up-regulated proteins are shown in red and down-regulated proteins are in green
Oncogene such as P53 is known to regulate glucose metabolism by modulating glucose uptake and glycolysis towards energy production for cell function. Loss of P53 regulation is thought to lead to increased glucose uptake and increased pentose cycle activity associated with increased lactate production and cell proliferation of the Warburg effect. The use of a less efficient energy producing pathway in cancer cells in favor of macromolecular synthesis is part of the systems biology of dividing cells to optimization glucose utilization 47. The principle of systems biology that allows optimization of glucose utilization also predicts that interruption of a metabolic pathway can lead to changes in substrate flow throughout the metabolic network, albeit in a less optimal way for cell proliferation. We previously have shown that treatment of MIA PaCa-2 pancreatic cancer cells with CP-320626 altered glucose utilization throughout the glucose metabolic network 16. The substrate flow through many glucose metabolic pathways was reduced. These include fluxes through the oxidative branch (glucose-6 phosphate dehydrogenase, G6PDH) as well as the non-oxidative branch (tranketolase/transaldolase, TK/TA) of the pentose cycle for ribose and deoxyribose synthesis, and pyruvate dehydrogenase (PDH) for the production of acetyl-CoA for de novo lipogenesis. The effect of restriction of one glucose metabolic pathway on other glucose metabolic pathways is most likely due to its effect on the availability of precursors and co-factors that are shared by these pathways in the cellular metabolic network. Signaling pathways, similar to metabolic pathways, share many of these common cofactors and substrates. Together, signaling pathways and metabolic pathways form an extended metabolic network (Figure 6) 1. The restriction of substrate through one pathway such as inhibition of glycogen phosphorylation induces pervasive metabolomic changes. In this study we showed that similarly, treatment of MIA PaCa-2 pancreatic cancer cells with CP-320626 also induced proteomic changes: in protein synthesis, protein breakdown and post-translational modification of signaling molecules, e.g., MAPK/ERK, PI3K/AKT, which eventually affect expression of cell cycle signals such as p21, p27, and cyclin D1.
The dynamic changes induced by CP-320626 treatment of MIA PaCa-2 cells were in areas of protein turnover, protein expression, and protein phosphorylation. Using quantitative proteomic methods of modified SILAC and 2 DE-MS/MS analysis 17, 18, we were able to classify proteins isolated from 2-D gel according to their respective fraction of new synthesis (turnover rate). As noted, the distribution of turnover rate among the up-regulated proteins was similar to those of the down-regulated proteins, suggesting the importance of both protein synthesis and degradation in the regulation of protein expression. Both processes are subject to metabolic regulation at the translational and post-translational levels. In our study, four proteins (heterogeneous nuclear ribonucleoprotein H, glyceraldehyde-3-phosphate dehydrogenase, protein SET, and myosin light polypeptide 6) were shown to have high turnover rates of greater than 60% in 48 hours (Table 1) (Fig. 4). The high turnover rate in these up-regulated proteins suggests that these proteins may play an important role in the response to treatment with CP-320626 in MIA PaCa-2 cells. Interestingly, pathway analysis via Ingenuity revealed that more than 85% of differential proteins identified in this study were involved in the MAPK/ERK and TNF-α/NF-κB pathways (Fig. 5C). Additionally, the expression profile patterns of cellular phosphorylated proteins of MIA PaCa-2 pancreatic cancer cells were significantly reduced following the increase of CP-320626 concentration (Fig. 4). Such findings together suggest that the cell cycle arrest and apoptosis caused by CP-320626 may be associated with the MAPK/ERK and TNF-α/NF-κB pathways in the MIA PaCa-2 pancreatic cancer cells.
Intriguingly, although the endogenous level of p53 expression is very low, we observed that p53 protein was overexpressed in p53-mutated MIA PaCa-2 pancreatic cancer cells in response to the treatment of an elevated dose of CP-320626 28. P53, as a tumor suppressor gene, serves as a pivotal component of the apoptosis pathways 28. Loss of activity (by mutation) of p53 in human pancreatic cancer cell line MIA PaCa-2 pancreatic cancer cells enhances the aggressive growth of human pancreatic cancer cells 48. Our data suggested that CP-320626 can up-regulate the expression of p53 in MIA PaCa-2 pancreatic cancer cells (Fig. 1B). The molecular mechanism of how metabolic inhibitor CP-320626 regulates p53 expression in this cancer cell line remains to be investigated.
At present, medical intervention is only successful in prolonging the life of most cancer patients from months to a few years. A wide range of small molecule antimetabolite agents that interact with pathways crucial to cell survival are now being tested as chemotherapeutic agents in pancreatic cancer. Some features of tumor energy metabolism are actually used as a marker for cancer diagnosis and targets for a therapeutic approach known as “metabolic therapy” 49. Our study of glycogen phosphorylase inhibitor revealed that inhibition of glycogen break down induced metabolic 16 and proteomic changes in a manner consistent with the working of an extended metabolic network. We believe a combination of proteomic and metabolomic approaches is a powerful way to investigate such a metabolic network; and should be applied for discovering new drug targets and their associated pathways for “metabolic therapy”, and to evaluate the efficacy of such new drugs that target signaling or metabolic pathways in cancer chemotherapy.
Acknowledgments
This work is fully supported by grants awarded to Dr. Gary Guishan Xiao (GGX) from the Bone Biology Program of the Cancer and Smoking Related Disease Research Program and the Nebraska Tobacco Settlement Biomedical Research Program (LB692, LB595, and LB506). It is also partially supported by a grant awarded to Wai-Nang Paul Lee from the UCLA Center of Excellence in Pancreatic Disease (P01 AT003960-01), Harbor-UCLA GCRC Mass Spectrometry Core (M01 RR00425), and the Hirshberg Foundation for Pancreatic Cancer Research.
Abbreviations
- MALDI
matrix assisted laser desorption ionization
- TOF/TOF MS
time-of-flight/time-of-flight mass spectrometry
- 2-DE
two-dimensional electrophoresis
- PMF
peptide mass fingerprinting
- CP-320626
5-chloro-1H-indole-2-carboxylic acid [1-(4-fuorobenzyl)-2-(4-hydroxypiperidin-1-yl)-2 oxoethyl] amide
Footnotes
Disclosure of Potential Conflicts of Interest
No potential conflicts of interest were disclosed.
References
- 1.Vander Heiden MG, Cantley LC, Thompson CB. Understanding the Warburg effect: the metabolic requirements of cell proliferation. Science. 2009;324:1029–1033. doi: 10.1126/science.1160809. [DOI] [PMC free article] [PubMed] [Google Scholar]
- 2.Levine AJ, Puzio-Kuter AM. The control of the metabolic switch in cancers by oncogenes and tumor suppressor genes. Science. 330:1340–1344. doi: 10.1126/science.1193494. [DOI] [PubMed] [Google Scholar]
- 3.Flier JS, Mueckler MM, Usher P, et al. Elevated levels of glucose transport and transporter messenger RNA are induced by ras or src oncogenes. Science. 1987;235:1492–1495. doi: 10.1126/science.3103217. [DOI] [PubMed] [Google Scholar]
- 4.Shim H, Dolde C, Lewis BC, et al. c-Myc transactivation of LDH-A: implications for tumor metabolism and growth. Proc Natl Acad Sci U S A. 1997;94:6658–6663. doi: 10.1073/pnas.94.13.6658. [DOI] [PMC free article] [PubMed] [Google Scholar]
- 5.Osthus RC, Shim H, Kim S, et al. Deregulation of glucose transporter 1 and glycolytic gene expression by c-Myc. J Biol Chem. 2000;275:21797–21800. doi: 10.1074/jbc.C000023200. [DOI] [PubMed] [Google Scholar]
- 6.Elstrom RL, Bauer DE, Buzzai M, et al. Akt stimulates aerobic glycolysis in cancer cells. Cancer Res. 2004;64:3892–3899. doi: 10.1158/0008-5472.CAN-03-2904. [DOI] [PubMed] [Google Scholar]
- 7.Kroemer G, Pouyssegur J. Tumor cell metabolism: cancer’s Achilles’ heel. Cancer Cell. 2008;13:472–482. doi: 10.1016/j.ccr.2008.05.005. [DOI] [PubMed] [Google Scholar]
- 8.Weinhouse S. Glycolysis, respiration, and anomalous gene expression in experimental hepatomas: G.H.A. Clowes memorial lecture. Cancer Res. 1972;32:2007–2016. [PubMed] [Google Scholar]
- 9.Gatenby RA, Gawlinski ET, Gmitro AF, et al. Acid-mediated tumor invasion: a multidisciplinary study. Cancer Res. 2006;66:5216–5223. doi: 10.1158/0008-5472.CAN-05-4193. [DOI] [PubMed] [Google Scholar]
- 10.Crabtree HG. Observations on the carbohydrate metabolism of tumours. Biochem J. 1929;23:536–545. doi: 10.1042/bj0230536. [DOI] [PMC free article] [PubMed] [Google Scholar]
- 11.Warburg O. On the origin of cancer cells. Science. 1956;123:309–314. doi: 10.1126/science.123.3191.309. [DOI] [PubMed] [Google Scholar]
- 12.Rais B, Comin B, Puigjaner J, et al. Oxythiamine and dehydroepiandrosterone induce a G1 phase cycle arrest in Ehrlich’s tumor cells through inhibition of the pentose cycle. FEBS Lett. 1999;456:113–118. doi: 10.1016/s0014-5793(99)00924-2. [DOI] [PubMed] [Google Scholar]
- 13.Mandal S, Freije WA, Guptan P, et al. Metabolic control of G1-S transition: cyclin E degradation by p53-induced activation of the ubiquitin-proteasome system. J Cell Biol. 188:473–479. doi: 10.1083/jcb.200912024. [DOI] [PMC free article] [PubMed] [Google Scholar]
- 14.Somsak L, Czifrak K, Toth M, et al. New inhibitors of glycogen phosphorylase as potential antidiabetic agents. Curr Med Chem. 2008;15:2933–2983. doi: 10.2174/092986708786848659. [DOI] [PubMed] [Google Scholar]
- 15.Oikonomakos NG. Glycogen phosphorylase as a molecular target for type 2 diabetes therapy. Curr Protein Pept Sci. 2002;3:561–586. doi: 10.2174/1389203023380422. [DOI] [PubMed] [Google Scholar]
- 16.Lee WN, Guo P, Lim S, et al. Metabolic sensitivity of pancreatic tumour cell apoptosis to glycogen phosphorylase inhibitor treatment. Br J Cancer. 2004;91:2094–2100. doi: 10.1038/sj.bjc.6602243. [DOI] [PMC free article] [PubMed] [Google Scholar]
- 17.Zhang H, Cao R, Lee WN, et al. Inhibition of protein phosphorylation in MIA pancreatic cancer cells: confluence of metabolic and signaling pathways. J Proteome Res. 9:980–989. doi: 10.1021/pr9008805. [DOI] [PMC free article] [PubMed] [Google Scholar]
- 18.Zhao Y, Lee WN, Lim S, et al. Quantitative proteomics: measuring protein synthesis using 15N amino acid labeling in pancreatic cancer cells. Anal Chem. 2009;81:764–771. doi: 10.1021/ac801905g. [DOI] [PMC free article] [PubMed] [Google Scholar]
- 19.Xiao GG, Nel AE, Loo JA. Nitrotyrosine-modified proteins and oxidative stress induced by diesel exhaust particles. Electrophoresis. 2005;26:280–292. doi: 10.1002/elps.200406145. [DOI] [PubMed] [Google Scholar]
- 20.Xiao GG, Wang M, Li N, et al. Use of proteomics to demonstrate a hierarchical oxidative stress response to diesel exhaust particle chemicals in a macrophage cell line. J Biol Chem. 2003;278:50781–50790. doi: 10.1074/jbc.M306423200. [DOI] [PubMed] [Google Scholar]
- 21.Jiang XS, Tang LY, Cao XJ, et al. Two-dimensional gel electrophoresis maps of the proteome and phosphoproteome of primitively cultured rat mesangial cells. Electrophoresis. 2005;26:4540–4562. doi: 10.1002/elps.200500286. [DOI] [PubMed] [Google Scholar]
- 22.Romijn JC, Verkoelen CF, Schroeder FH. Application of the MTT assay to human prostate cancer cell lines in vitro: establishment of test conditions and assessment of hormone-stimulated growth and drug-induced cytostatic and cytotoxic effects. Prostate. 1988;12:99–110. doi: 10.1002/pros.2990120112. [DOI] [PubMed] [Google Scholar]
- 23.Mosmann T. Rapid colorimetric assay for cellular growth and survival: application to proliferation and cytotoxicity assays. J Immunol Methods. 1983;65:55–63. doi: 10.1016/0022-1759(83)90303-4. [DOI] [PubMed] [Google Scholar]
- 24.Xiao GG, Garg M, Lim S, et al. Determination of protein synthesis in vivo using labeling from deuterated water and analysis of MALDI-TOF spectrum. J Appl Physiol. 2008;104:828–836. doi: 10.1152/japplphysiol.00976.2007. [DOI] [PubMed] [Google Scholar]
- 25.Vizan P, Sanchez-Tena S, Alcarraz-Vizan G, et al. Characterization of the metabolic changes underlying growth factor angiogenic activation: identification of new potential therapeutic targets. Carcinogenesis. 2009;30:946–952. doi: 10.1093/carcin/bgp083. [DOI] [PubMed] [Google Scholar]
- 26.Toyoshima H, Hunter T. p27, a novel inhibitor of G1 cyclin-Cdk protein kinase activity, is related to p21. Cell. 1994;78:67–74. doi: 10.1016/0092-8674(94)90573-8. [DOI] [PubMed] [Google Scholar]
- 27.Baldin V, Lukas J, Marcote MJ, et al. Cyclin D1 is a nuclear protein required for cell cycle progression in G1. Genes Dev. 1993;7:812–821. doi: 10.1101/gad.7.5.812. [DOI] [PubMed] [Google Scholar]
- 28.Ahmed MM, Alcock RA, Chendil D, et al. Restoration of transforming growth factor-beta signaling enhances radiosensitivity by altering the Bcl-2/Bax ratio in the p53 mutant pancreatic cancer cell line MIA PaCa-2. J Biol Chem. 2002;277:2234–2246. doi: 10.1074/jbc.M110168200. [DOI] [PubMed] [Google Scholar]
- 29.Garkavtsev I, Grigorian IA, Ossovskaya VS, et al. The candidate tumour suppressor p33ING1 cooperates with p53 in cell growth control. Nature. 1998;391:295–298. doi: 10.1038/34675. [DOI] [PubMed] [Google Scholar]
- 30.Yonish-Rouach E, Resnitzky D, Lotem J, et al. Wild-type p53 induces apoptosis of myeloid leukaemic cells that is inhibited by interleukin-6. Nature. 1991;352:345–347. doi: 10.1038/352345a0. [DOI] [PubMed] [Google Scholar]
- 31.Doherty MK, Whitehead C, McCormack H, et al. Proteome dynamics in complex organisms: using stable isotopes to monitor individual protein turnover rates. Proteomics. 2005;5:522–533. doi: 10.1002/pmic.200400959. [DOI] [PubMed] [Google Scholar]
- 32.Pratt JM, Petty J, Riba-Garcia I, et al. Dynamics of protein turnover, a missing dimension in proteomics. Mol Cell Proteomics. 2002;1:579–591. doi: 10.1074/mcp.m200046-mcp200. [DOI] [PubMed] [Google Scholar]
- 33.Arpaia E, Shahar M, Dadi H, et al. Defective T cell receptor signaling and CD8+ thymic selection in humans lacking zap-70 kinase. Cell. 1994;76:947–958. doi: 10.1016/0092-8674(94)90368-9. [DOI] [PubMed] [Google Scholar]
- 34.Chan AC, Iwashima M, Turck CW, et al. ZAP-70: a 70 kd protein-tyrosine kinase that associates with the TCR zeta chain. Cell. 1992;71:649–662. doi: 10.1016/0092-8674(92)90598-7. [DOI] [PubMed] [Google Scholar]
- 35.Chan AC, Kadlecek TA, Elder ME, et al. ZAP-70 deficiency in an autosomal recessive form of severe combined immunodeficiency. Science. 1994;264:1599–1601. doi: 10.1126/science.8202713. [DOI] [PubMed] [Google Scholar]
- 36.Toyabe S, Watanabe A, Harada W, et al. Specific immunoglobulin E responses in ZAP-70-deficient patients are mediated by Syk-dependent T-cell receptor signalling. Immunology. 2001;103:164–171. doi: 10.1046/j.1365-2567.2001.01246.x. [DOI] [PMC free article] [PubMed] [Google Scholar]
- 37.Eyers CE, McNeill H, Knebel A, et al. The phosphorylation of CapZ-interacting protein (CapZIP) by stress-activated protein kinases triggers its dissociation from CapZ. Biochem J. 2005;389:127–135. doi: 10.1042/BJ20050387. [DOI] [PMC free article] [PubMed] [Google Scholar]
- 38.Kellner R, Lichtenfels R, Atkins D, et al. Targeting of tumor associated antigens in renal cell carcinoma using proteome-based analysis and their clinical significance. Proteomics. 2002;2:1743–1751. doi: 10.1002/1615-9861(200212)2:12<1743::AID-PROT1743>3.0.CO;2-U. [DOI] [PubMed] [Google Scholar]
- 39.Mueller HW, Michel A, Heckel D, et al. Identification of an amplified gene cluster in glioma including two novel amplified genes isolated by exon trapping. Hum Genet. 1997;101:190–197. doi: 10.1007/s004390050612. [DOI] [PubMed] [Google Scholar]
- 40.Ou K, Yu K, Kesuma D, et al. Novel breast cancer biomarkers identified by integrative proteomic and gene expression mapping. J Proteome Res. 2008;7:1518–1528. doi: 10.1021/pr700820g. [DOI] [PubMed] [Google Scholar]
- 41.Montpetit A, Boily G, Sinnett D. A detailed transcriptional map of the chromosome 12p12 tumour suppressor locus. Eur J Hum Genet. 2002;10:62–71. doi: 10.1038/sj.ejhg.5200766. [DOI] [PubMed] [Google Scholar]
- 42.Mayya V, Lundgren DH, Hwang SI, et al. Quantitative phosphoproteomic analysis of T cell receptor signaling reveals system-wide modulation of protein-protein interactions. Sci Signal. 2009;2:ra46. doi: 10.1126/scisignal.2000007. [DOI] [PubMed] [Google Scholar]
- 43.Montpetit A, Larose J, Boily G, et al. Mutational and expression analysis of the chromosome 12p candidate tumor suppressor genes in pre-B acute lymphoblastic leukemia. Leukemia. 2004;18:1499–1504. doi: 10.1038/sj.leu.2403441. [DOI] [PubMed] [Google Scholar]
- 44.Li AL, Li HY, Jin BF, et al. A novel eIF5A complex functions as a regulator of p53 and p53-dependent apoptosis. J Biol Chem. 2004;279:49251–49258. doi: 10.1074/jbc.M407165200. [DOI] [PubMed] [Google Scholar]
- 45.Taylor CA, Senchyna M, Flanagan J, et al. Role of eIF5A in TNF-alpha-mediated apoptosis of lamina cribrosa cells. Invest Ophthalmol Vis Sci. 2004;45:3568–3576. doi: 10.1167/iovs.03-1367. [DOI] [PubMed] [Google Scholar]
- 46.Cracchiolo BM, Heller DS, Clement PM, et al. Eukaryotic initiation factor 5A-1 (eIF5A-1) as a diagnostic marker for aberrant proliferation in intraepithelial neoplasia of the vulva. Gynecol Oncol. 2004;94:217–222. doi: 10.1016/j.ygyno.2004.03.018. [DOI] [PubMed] [Google Scholar]
- 47.Paul Lee WN, Wahjudi PN, Xu J, et al. Tracer-based metabolomics: concepts and practices. Clin Biochem. 43:1269–1277. doi: 10.1016/j.clinbiochem.2010.07.027. [DOI] [PMC free article] [PubMed] [Google Scholar]
- 48.Bouvet M, Bold RJ, Lee J, et al. Adenovirus-mediated wild-type p53 tumor suppressor gene therapy induces apoptosis and suppresses growth of human pancreatic cancer [seecomments] Ann Surg Oncol. 1998;5:681–688. doi: 10.1007/BF02303477. [DOI] [PubMed] [Google Scholar]
- 49.Moreno-Sanchez R, Rodriguez-Enriquez S, Marin-Hernandez A, et al. Energy metabolism in tumor cells. Febs J. 2007;274:1393–1418. doi: 10.1111/j.1742-4658.2007.05686.x. [DOI] [PubMed] [Google Scholar]