

Abstract
Motivation: The observation of positive selection acting on a mutant indicates that the corresponding mutation has some form of functional relevance. Determining the fitness effects of mutations thus has relevance to many interesting biological questions. One means of identifying beneficial mutations in an asexual population is to observe changes in the frequency of marked subsets of the population. We here describe a method to estimate the establishment times and fitnesses of beneficial mutations from neutral marker frequency data.
Results: The method accurately reproduces complex marker frequency trajectories. In simulations for which positive selection is close to 5% per generation, we obtain correlations upwards of 0.91 between correct and inferred haplotype establishment times. Where mutation selection coefficients are exponentially distributed, the inferred distribution of haplotype fitnesses is close to being correct. Applied to data from a bacterial evolution experiment, our method reproduces an observed correlation between evolvability and initial fitness defect.
Availability: A C++ implementation of the inference tool is available under GNU GPL license (http://www.sanger.ac.uk/resources/software/optimist/).
Contact: vm5@sanger.ac.uk
Supplementary information: Supplementary data are available at Bioinformatics online.
1 INTRODUCTION
The potential of a biological system to adapt to a given environment is a key characteristic, measurements of which shed light on a critical aspect of the process of evolution. How adaptation takes place depends to a large extent on the distribution of the fitness effects of mutations (Eyre-Walker and Keightley, 2007; Orr, 2005). Therefore, quantitative measurements of selection are biologically interesting and valuable.
Neutral markers provide one tool for identifying selection in experimental populations. In an experimental population, markers allow for the easy identification of variants. Selection pressures acting on marked populations can then be seen by changes in their relative frequencies (Atwood et al., 1951). In initially isogenic, asexual populations, neutral markers have been used to characterize novel beneficial mutations (Imhof and Schlotterer, 2001; Rozen et al., 2002), and to study evolutionary processes such as clonal interference (Kao and Sherlock, 2008; Perfeito et al., 2007) and evolvability (Woods et al., 2011).
Where marked subpopulations have differing initial fitness, their relative fitnesses can be derived by considering the ratio between their Malthusian parameters (Lenski et al., 1991). Where the initial population is isogenic, these growth rates are theoretically identical, but novel beneficial mutations lead to changes in the marker frequencies. In a study of beneficial mutations arising in Escherichia coli, Hegreness et al. (2006) examined the log ratio between marker population frequencies. For each set of observed marker frequencies, a deterministic curve, parameterized by a mutation time and a selection coefficient, was fitted. Multiple simulations of populations were then generated, giving an estimate of a single beneficial mutation rate and selection coefficient fitting the set of observations as a whole.
While this characterization of multiple populations by single mutation and selection parameters provides a useful approach where clonal interference between mutations is severe, it is not applicable to all evolutionary scenarios (Barrett et al., 2006). Under a very low beneficial mutation rate, where competition between clones is rare, mutations under a range of strengths of positive selection would be likely to fix. Furthermore, in the application of this method, where only the first mutational event in an experiment is considered, frequencies at later time-points are discarded (Barrick et al., 2010). Potentially valuable information on the evolution of the system is lost.
Here, we describe an alternative method that uses a maximum likelihood approach to infer selective effects and establishment times of mutants in an asexual population from individual marker frequency trajectories. Our method enables the inference of fitness of multiple mutant haplotypes arising in an experiment, with no prior assumption of their distribution of fitness effects, while also allowing for the detection of standing variation in the initial pool. We test our method against data generated from simulations using a range of evolutionary parameters, and against experimental results from a recent study of marker populations (Barrick et al., 2010).
2 METHODS
We describe a marked experimental population in terms of haplotypes. Mutations result in the emergence of new haplotypes, which we characterize by their marker, haplotype fitness, and time of establishment. A formal mathematical description of the method is given below; a simpler, more qualitative guide is included in Supplementary Material.
Deterministic model of evolution
We consider a deterministic representation of a system of NH haplotypes. Where qa denotes the frequency of haplotype a, and fa denotes its Malthusian fitness parameter, the evolution of the system can be described via a set of differential equations:
| (1) |
where the sum over existing haplotypes H gives the mean population fitness. Equation (1) is a standard population genetics description of deterministic evolution of haplotypes under selection [see e.g. Hofbauer and Sigmund (1998)]. In order to allow for new mutations, we further define an establishment time ta of haplotype a. For the set of initial haplotypes H0={a|ta=0}, the initial frequencies qa(0) are set in some manner such that ∑a∈H0 qa(0)=1. To represent mutations, we start a new haplotype at a population frequency q0=1×10⁻³, at the establishment time ta, rescaling the frequencies of other haplotypes accordingly. This choice of initial frequency reflects the frequency required to escape from genetic drift, i.e. to become ‘established’ [see e.g. Park et al. (2010) and references therein]. In an otherwise isogenic population of size N, a mutant haplotype with selection coefficient σ (denoting the fitness difference between the mutant and the wild-type population; σ=fa−fwildtype) is affected more by selection than drift above a frequency of ~ 1/Nσ (Rouzine et al., 2001). Here, where we consider underlying population sizes of order N=106, and strongly beneficial mutants with selective benefit of the order of 10−2 per generation, selection is by far the dominant force above a frequency of q0, such that a deterministic model for haplotype evolution may be considered.
Under this model, we define nominal unscaled haplotype population sizes ya(t) by
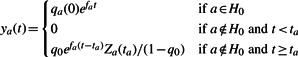 |
(2) |
where Za(t)= ∑{a′|ta′<ta} ya′(t). Haplotype frequencies are then given by qa(t)=ya(t)/Z(t), where normalization Z(t)= ∑a ya(t) ensures that the haplotype frequencies add up to one. The term Za(t) is calculated in a recursive manner; where haplotypes are ordered by increasing value of ta, Za(t) is dependent on Za′(t) for all a′ < a.
We now suppose that the population is divided into subpopulations by the use of neutral markers, with each initial haplotype having a single marker, and subsequent mutations arising within distinct subpopulations. We refer to these subpopulations as marker populations. The dynamics of the marker populations can be expressed in terms of the assignment of markers to the haplotypes. Given k markers m1,…, mk, we denote this assignment by a vector  where NH denotes the number of haplotypes, and χa∈{m1,…, mk}. The time-evolution of the frequency xi(t) of the marker mi is then given by
| (3) |
Model parameterization
Given observations of the evolution of the marker frequencies over time, we derive a model for the evolutionary events leading to these observations. We suppose that there are k markers, and consider a model including nm beneficial mutations. We use k haplotypes to model the initial marker populations. This gives χa=ma, and, as the markers are assumed neutral, fa=0 for a=1,…, k. The initial frequencies qi(0), i=1,…, k−1, remain to be fitted by the model, the final frequency qk(0) being given by ∑i qi(0)=1. Beneficial mutations are modelled by the haplotypes a=k+1,…, k+nm, each being assigned the parameters {ta, fa, χa}, ta representing the time when the haplotype reached frequency q0, fa its fitness, and χa the marker population in which it arose.
In an initial implementation of this method, the values of ta were restrained to occur between the beginning and end of the observation time. In a variant of the method, however, this requirement was relaxed to allow for standing variation. If a haplotype representing the first mutant occurring in one of the first k−1 marker populations had ta < 1, this mutation was allowed to have an initial frequency greater than q0, the initial frequency of the corresponding wild-type haplotype being decreased accordingly.
Likelihood fitting
Given a model M generating a deterministic trajectory for the evolution of the marker populations, a fit was carried out between the observed marker population frequencies,  , and the model marker population frequencies, {xi(tk)}. At each point tk for which the marker frequency was observed, a log likelihood for the observation was calculated as
| (4) |
where n(tk) was the number of individuals sampled at time tk. The overall log likelihood for the system under the given model was then calculated as
| (5) |
Optimization
Given a set number of mutations for a system, the parameters {ta, fa, χa}, and the initial frequencies qa(0), were optimized to derive the best fit between the observed and model marker frequencies. A standard GSL (GNU Scientific Library) minimization routine was used to find optimal values of the fa and qa(0), while other parameters were optimized using a random search approach. For each set of observed frequencies, likelihoods were calculated under models with increasing numbers of mutations, up to a limit of six mutations per system (the limit being chosen on computational grounds). Comparison of models was carried out using a variant of the Akaike information criterion (AIC) model (Akaike, 1974), expressed as AIC=2.5(p−1)−(LM), where p was the number of model parameters, a lower score being assumed to indicate a better model. Where adding an extra mutation to the model increased this score, no further optimizations were carried out. The factor of 2.5 in the definition was chosen on the basis of qualitative examination of preliminary results with a sample size n(tk)=500, a higher penalty missing some subtleties induced by additional mutations, and a lower penalty falsely adding mutations to fit frequency variations caused by noise in the sampling process.
Model populations
In order to assess the performance of the method, simulated population histories were generated using a Wright–Fisher model, implemented using in-house code. An initial population was created of N=106 individuals, each with L+1 binary loci, lij∈{0, 1}, where the first index denotes the individual (1≤i≤N), and the second index denotes the locus (1≤j≤L+1). L was set to 100 in all simulations. The first L loci of each individual were initially set to zero, while the final locus denoted the neutral marker. In our model, we examined the two-marker case, k=2, in which the marker frequencies give the smallest possible amount of information about the system. As such, the final locus was set to one in N/2 individuals, and to zero in the other N/2 individuals. The first L loci were each assigned a positive selection coefficient, σj≥0, while the final locus was assigned a selection coefficient of zero. An additive fitness landscape was assumed, such that the fitness Fi of any individual i was specified by
| (6) |
Within each generation, the first L alleles of each individual were subject to mutation with some fixed probability U/L, where U represented the beneficial mutation rate per genome per generation. Subsequent generations were sampled from the previous generation using a multinomial distribution, such that the probability of an individual i in the population being chosen for replication was proportional to eFi. Every 16 generations, a random sample of 500 individuals was taken from the population, recording the number of individuals in the sample with each neutral marker. This sampling process was continued for 640 generations, or until the first instance when the entire sample comprised individuals from a single marker population.
Simulations were run for both constant and exponentially distributed selection coefficients σj. With a constant coefficient, simulations were run with σj=σ for a range of values of σ∈{0.025, 0.05, 0.1, 0.2}, denoting selective advantages between 2.5% and 20% per generation. Exponentially distributed selection coefficients were chosen with parameters σ0∈{0.01, 0.025, 0.05, 0.1}, where the parameter σ0 is the mean of the distribution. In either case, the beneficial mutation rate U was chosen from a range of values U∈{1×10⁻⁸, 5×10⁻⁸, 1×10⁻⁷, 2×10⁻⁷, 5×10⁻⁷}, expressed per genome per generation, close to the value of U=6.6×10⁻⁸ obtained in the experiment of (Barrick et al., 2010).
For each distribution of selection coefficients, 50 simulations were run for each combination of {σ, U} or {σ0, U}. Haplotype fitnesses, timings and marker populations of mutations, and the initial haplotype frequencies at the beginning of the experiment, were then inferred for each simulation using the model previously described. Here, the possibility of standing variation was not included in the model, there being no standing variation in the underlying populations. To evaluate the effect of a variable population size on the performance of the method, simulations were repeated with a more limited set of parameters (σ0∈{0.025, 0.05}, U∈{5×10⁻⁸, 1×10⁻⁷, 2×10⁻⁷}) for a population with initial size 106, which repeatedly doubled in size each generation for eight generations before undergoing a bottleneck at ratio 1:256.
Analysis of inferred parameters
The distribution of inferred fitnesses was compared with the distribution of fitnesses of haplotypes reaching a threshold of q0 in the simulated populations. For the simulations with constant selection coefficients, inferred selection coefficients were calculated as the differences between successive inferred haplotype fitnesses within each marker population. Analysis of inferred establishment times was carried out by pairing real and inferred times, the inferred time of each mutant being paired with the closest time at which a haplotype in the simulated population bearing the inferred marker reached a threshold of q0.
Analysis of experimental data
Our method was used to analyse marker frequency data from a set of experiments measuring the fitness of novel mutations in nine populations of Escherichia coli, in which the initial fitness of the bacteria had been reduced through mutation (Barrick et al., 2010). Following this previous work, we performed calculations of the evolvability of each population, defined to be the rate at which the population adapted to its environment. While multiple measures of evolvability can be calculated (Barrick et al., 2010), in our case the mean fitness of the first mutant haplotype observed for each population was considered. Mean fitness values were calculated from the results of optimized models generated as above for between 11 and 13 repetitions of the neutral marker experiment. Analyses were run both with and without the inclusion of a possibility of standing variation in the initial pool, the former model being chosen when it offered an improved likelihood.
3 RESULTS
3.1 Reproducing the evolution of marker and haplotype frequencies
Application of the method gave model frequencies that captured the primary features of the observed marker dynamics. In many cases, it was clear that more than one mutational event was described by the observed trajectory. Figure 1 shows models fitted to data from an experiment of Barrick et al. (2010) where a four-mutant model provided a substantially better fit to the data than a single-mutant model. Across the set of populations analysed by Barrick et al. (2010), a model with more than one mutant was fitted to the marker frequencies in 80 out of 108 cases, with a mean of 2.41 mutants identified per experiment.
Fig. 1.
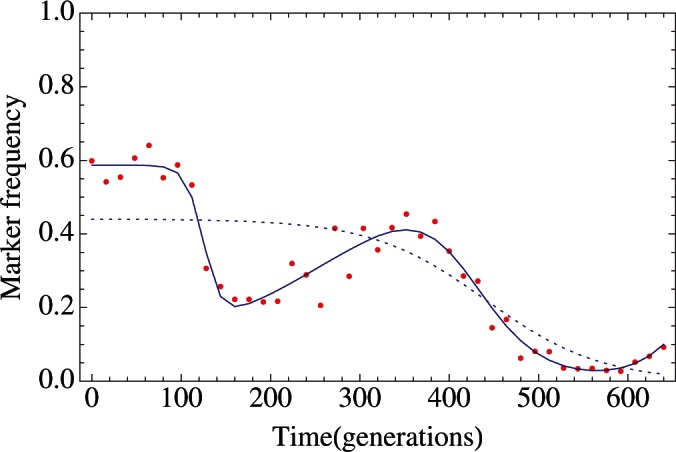
Complex marker trajectories are better explained with multiple mutations. Inferred frequencies for an example population [data from (Barrick et al., 2010)] are shown from models with one (blue dotted line), and four (blue solid line) beneficial mutations. The observed frequencies are shown as red dots. AIC scores for the two models were 364.8 and 156.4, respectively. Optimal two-, three- and five-mutant models had AIC scores of 313.8, 208.6, and 163.5, respectively.
More detailed results from two example simulations from the constant selection coefficient set (σ=0.1, U=1×10⁻⁷) are shown in Figure 2. In the first example (Fig. 2a–d), the model marker frequencies are very close to those from the simulation (Fig. 2b). The simulated haplotype frequencies too are extremely well reproduced, with the initial haplotype in the red marker population being replaced by a fitter haplotype between generations 100 and 220, and two successive replacement events taking place in the blue population. The inferred timings of the establishment of the two haplotypes are accurate, with the mutant in the red population being predicted to establish after 111 generations (real time 106 generations), and in the blue population mutants being predicted to establish after 94 and 426 generations (real times 83 and 429 generations). A single error is seen in the red population, with a haplotype reaching frequency q0 after 509 generations not being seen by the model. This haplotype, which reaches a peak frequency of 0.17% and is maintained in the population until generation 640, was not detected by the sampling, which registers zero population for the red marker at generation 560. At this point, no further data are considered by the method, such that the two late events in the blue population are also missed. In the second example (Fig. 2e–h), the fit to the marker frequency is also very good, but a substantial error is seen in the reproduction of haplotypes. In the red marker population, two beneficial events establish in close succession, in generations 81 and 94. While the cumulative effect of these mutations is captured in the model, with a single mutant haplotype predicted to establish at generation 91 (inferred fitness 0.12), no distinction between the two haplotypes can be made, leading to a clear discrepancy in the haplotype plot (Fig. 2g). The underlying simulation parameters, in which beneficial mutations have identical fitness advantages, represent a pathological case for generating this effect, with haplotypes of identical fitness in the same marker population being indistinguishable in their effect on the neutral marker. This example, however, illustrates a general difficulty in imputing haplotypes from a marker population. Where haplotypes establish but do not substantially move the marker frequency (see, for example, the event at generation 162 in the blue population), or where multiple similarly fit haplotypes establish in the same marker population, the number of mutation events is undercalled by the inference method. Sequencing of an experimental population could be used to capture the distribution of haplotypes at substantial frequencies within a population, although the identification of very low frequency haplotypes is difficult even then. We now consider results collected from across the set of simulations.
Fig. 2.

Reproduction of marker and haplotype frequencies. (a) Full haplotype distribution for a simulated population, divided by a red/blue marker. Times within marker populations at which a new mutation reaches q0 (dots with black outline, red or blue according to marker). The frequencies are shown in a cumulative way so that each background colour separated by black lines represent a haplotype. (b) Marker population frequencies from the simulated population (red solid line) and predicted by the model (black dotted line). Samples from the marker population are shown as red dots. Times at which new mutations reached q0 are shown for the simulation (red/blue dots with black outline) and the model (red/blue dashed vertical lines). (c) Haplotype frequencies in the red marker population in the simulation (red solid line) and model (black dotted line). (d) Haplotype frequencies in the blue marker population in the simulation (blue solid line) and model (black dotted line). (e–h) represent a second simulated population. These have the same formatting as their counterparts in (a–d). Data shown are from simulations with constant σ=0.1 and U=1×10⁻⁷.
3.2 Statistical analysis of simulated data
Initial haplotype frequencies
The overall performance of the method was assessed by an analysis of multiple simulated populations. Across the sets of simulations, initial haplotype frequencies at the beginning of the experiment were accurately reproduced, with a mean absolute error in the inferred frequency of 7×10⁻³ for constant selection coefficients and 1.5×10⁻² for exponential selection coefficients. Standard deviations in the raw errors were 0.01 and 0.04, respectively.
Fitness effects of mutations
Selection coefficients inferred for the constant selection simulations were reasonable in their accuracy, with mean selection coefficients of 0.026, 0.055, 0.101 and 0.216 compared with real values of 0.025, 0.05, 0.1 and 0.2. Some variance in these values was seen, with standard deviations in the range of half of the inferred mean selection coefficient (0.015, 0.034, 0.048 and 0.111, respectively).
Haplotype fitnesses inferred for populations with exponentially distributed selection coefficients showed a good reproduction of the distribution of fitness effects. Figure 3 shows the distribution of fitness effects identified for simulations in which σ0=0.05 and U=1×10⁻⁷. As can be seen from the distribution, the number of mutations identified by the model is lower than the true value, illustrating the undercalling of mutations described above. To the right of the figure, a single mutant is noted with fitness >0.5. This high attributed fitness arises due to the limited time-resolution of the sampling of marker population frequencies. Where a haplotype has a selective advantage above a certain threshold, the marker frequency moves very rapidly, so that the difference between the time of the first significant move in the marker frequency, and the time at which the fixation of the marker frequency is detected, can be small. If this difference is less than twice the sampling frequency, the sampled marker frequency can have only a single point between a steady frequency and fixation, a situation which is compatible with an arbitrarily high selection coefficient. The selective advantage required to create this effect depends on the previous marker frequency, and on probabilistic factors arising from sampling. However, examination of simulated data where the fitness advantage was constant suggests that, where the mutant haplotype occurs in a marker population with high frequency, the effect can arise with a fitness advantage as low as 0.2 (in a marker population at >80% frequency, selection coefficient called as 1.134), or even with a fitness advantage of 0.1 (in a marker population at frequency >98%, selection coefficient called as 0.264). This effect is likely to underlie the increased mean inferred selection coefficient called for mutants with constant selection coefficient 0.2, described above. In an experiment where very large selective advantages are expected, more regular sampling would be beneficial for the purposes of this method (in Supplementary Tables, we have applied a heuristic cut off such that fi>0.5→0.5 in order to prevent these events biasing the reported fitness ratio statistics). The performance of the method at beneficial mutation rates higher than described here is discussed in Supplementary Material.
Fig. 3.
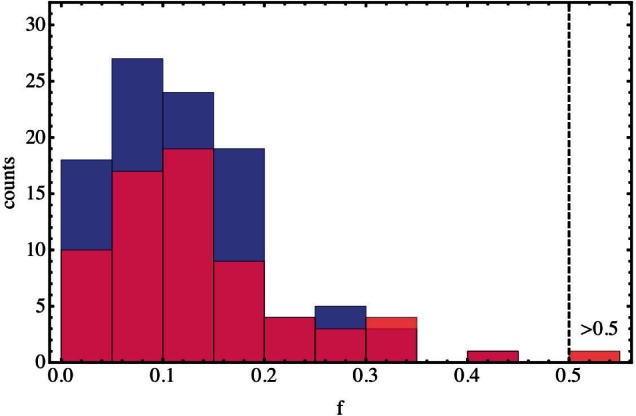
Haplotype fitnesses for a set of simulated populations. Results are shown for a set of 50 simulations, in which selection coefficients were generated from an exponential distribution with parameter σ0=0.05 and the beneficial mutation rate was U=1×10⁻⁷. Real haplotype fitnesses are shown in blue columns, with inferred haplotype fitnesses in red. The number of inferred haplotypes is lower than the number of real haplotypes.
Establishment times of mutations
A good correlation between the real and inferred establishment times of haplotypes was obtained. Figure 4 shows results for simulated populations with exponentially distributed selection coefficients with parameter σ0=0.05 and beneficial mutation rate U=1×10⁻⁷. Across these simulations, the correlation between establishment times was 0.98. Equivalent correlation scores for all but the lowest levels of selection were high, falling between 0.91 and 1 (mean 0.977) for exponentially distributed selection coefficients, and between 0.95 and 1 (mean 0.974) for constant selection coefficients. Figure 4 also details individual fitnesses inferred for new haplotypes. Inferred fitnesses for this dataset shown were, on average, 6% larger than those in the actual population. Correlation between the inferred and real establishment times and mean haplotype fitness statistics for all simulations are detailed in Supplementary Table S1. Similar plots constructed for the population undergoing growth and bottlenecking did not show substantially different results (see e.g. Supplementary Fig. S1).
Fig. 4.
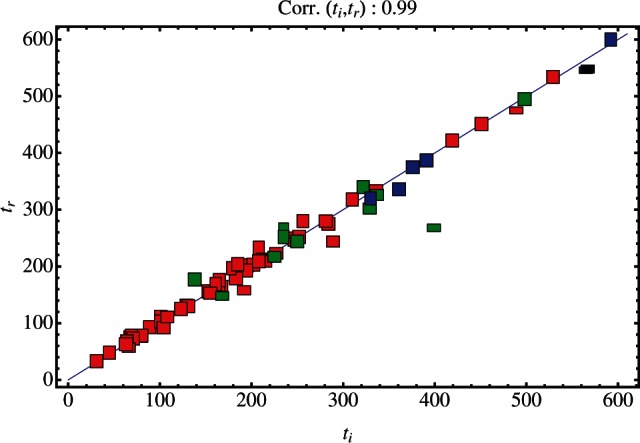
Establishment times and selection coefficients of real and inferred mutant haplotypes. Establishment times of inferred haplotypes were paired with the establishment times of real haplotypes reaching a frequency of q0. Paired event times are shown for the first (red), second (green), third (blue) and fourth (black) mutants inferred by the method. Each pair is shown by a rectangle, the height/width ratio of which is equal to the ratio between the real and inferred mutant haplotype fitness. Data are shown for σ0=0.05 and U=1×10⁻⁷.
Detection rates of mutations
In order to quantify the undercalling of haplotypes noted above, the ratio was calculated between the mean number of mutant haplotypes called, and the true number of new haplotypes in a simulation (Table 1). In general, the fraction of events called increased as the selection coefficient increased, reflecting the larger effect on the marker population caused by each mutation, and decreased as the beneficial mutation rate increased, reflecting an increased likelihood of multiple competing haplotypes within each marker. Results for systems with exponentially distributed selection coefficients were substantially better at higher mutation rates than those for constant selection coefficients, a constant selection coefficient allowing for multiple equally fit haplotypes to arise within each marker population. Repeating the calculation, but considering only haplotypes in the simulated population which reached a minimum frequency of 0.01 (10q0), gave substantial improvements to many of the ratios (Supplementary Table S2), reflecting the existence of haplotypes having only a very small effect on the marker frequency.
Table 1.
Fraction of new haplotypes called by the method
| Selection σ | Mutation rate U |
||||
|---|---|---|---|---|---|
| 10−8 | 5×10⁻⁸ | 10−7 | 2×10⁻⁷ | 5×10⁻⁷ | |
| Constant selection coefficients | |||||
| 0.025 | 0.545 | 0.568 | 0.402 | 0.321 | 0.191 |
| 0.050 | 0.870 | 0.684 | 0.561 | 0.392 | 0.183 |
| 0.100 | 0.889 | 0.664 | 0.561 | 0.380 | 0.205 |
| 0.200 | 0.855 | 0.747 | 0.519 | 0.379 | 0.197 |
| Exponentially distributed selection coefficients | |||||
| 0.010 | 0.333 | 0.500 | 0.452 | 0.509 | 0.267 |
| 0.025 | 0.667 | 0.667 | 0.671 | 0.559 | 0.481 |
| 0.050 | 0.812 | 0.734 | 0.673 | 0.583 | 0.405 |
| 0.100 | 0.900 | 0.693 | 0.779 | 0.593 | 0.517 |
Mean numbers of mutant haplotypes called by the method as a fraction of the mean number of haplotypes in simulated populations that reached a frequency of q0. Results are given for constant and for exponentially distributed selection coefficients, for each set of mutation and selection parameters.
The general undercalling of mutations means that accurate estimation of the beneficial mutation rate of a system from the inferred establishment times is a difficult task. While accurate inference of U is not a primary aim of our method, a rough approximation can be calculated using the result that in a Wright–Fisher model, the probability of a mutant with selection coefficient σ reaching frequency 1/σ is 2σ [see e.g. Desai and Fisher (2007)], giving
| (7) |
where nm is the number of inferred mutations and T is the simulation time in generations. Applying this formula across the set of simulations with constant selection coefficients gave an estimate within 15% of the correct value when U=10−8, with rapidly declining performance at higher values of U (Supplementary Fig. S2).
3.3 Statistical analysis of experimental marker trajectories
For each experiment described in Barrick et al. (2010), the model giving the best AIC score was identified. While models with more than one beneficial mutant often best fitted the data, for direct comparison with the original work, only the fitness of the first identified mutant haplotype was recorded in each case. A comparison of the mean fitnesses of these haplotypes with the fitness defect induced in the population showed a correlation with parameter r2=0.59 (Fig. 5). This result is close to the equivalent value of 0.67 achieved in the original work, and supports the idea that the evolvability of a strain is in proportion to its fitness defect.
Fig. 5.

Relationship between the fitness effect of the first beneficial mutation and the initial fitness defect of a population of E.coli. Initial fitness defects were taken from the work of (Barrick et al., 2010), while mean haplotype fitnesses were calculated from the corresponding marker frequency data using the model.
While standing variation is not directly incorporated into the method of Hegreness et al. (2006), our comparison of results from models with and without standing variation suggested that standing variation had an important effect in marker evolution. In the analysis of 16 of the 108 experiments, the method allowing for standing variation identified a mutant haplotype preexisting in one of the marker populations. Across these inferences an average improvement in the AIC score of 3.6 likelihood units was seen, suggesting that standing variation had a significant effect in the evolution of these experiments. (No clear relationship between the existence of standing variation and the evolvability of the population was observed.) The models arising from the remaining 92 experiments were, in theory, identical, such that their comparison gave an insight into the performance of the optimization process. Of these experiments, a difference between models of more than one log likelihood unit was identified in seven cases, such that our optimization was robust in most if not all cases. We leave the task of identifying the best possible algorithm for optimization to future work.
4 DISCUSSION
We have described and demonstrated the use of an evolutionary model to infer the timing and selective advantage of mutations in a system, based on the use of neutral marker data. With the limitations described above, our method performs acceptably well over a range of selection coefficients and beneficial mutation rates, with generally better performance for systems with exponentially distributed selection coefficients. Of the two models, the exponential distribution of selective benefits is likely to be more biologically relevant (Betancourt and Bollback, 2006), a constant selective benefit representing, in some ways, a worst-case scenario for the method.
While our method gives a good reproduction of the marker frequency data, the replication of the details of the haplotype distribution is a much more challenging problem. In certain circumstances, changes in the haplotype population are invisible to the marker, such that inferring their details can be an impossible task. As illustrated in Table 1, undercalling of mutations is an error inherent to the marker method, the extent of which depends on the underlying system parameters. Full resolution of haplotype information ultimately requires sequencing of the population.
Our method allows for the explicit capture of the effects of multiple mutations. As demonstrated above, this allows for close fitting of complex marker behaviour (Fig. 1), and for an approximation of the distribution of fitness effects (Fig. 3), though at higher mutation rates, details of changes in the full haplotype distribution are missed. Our method also allows for the explicit inclusion of standing variation. Where marked populations are grown before the initiation of an experiment, the possibility exists of a mutant arising in one marker or another before the experiment is begun. This was identified to be the case in 16 out of 108 examples from the experiment studied here. The method has the potential to identify standing variation at frequencies larger than q0, although the accuracy of measurements of the marker frequency presents a limiting factor.
Our choice of sampling parameters, with 500 individuals sampled every 16 generations, represents an achievable experimental protocol (Barrick et al., 2010). The use of flow cytometry to count individuals could lead to higher sample sizes, potentially improving the calling of fitness effects, and the identification of individual haplotypes. More frequent sampling would avoid the false assignment of very high fitnesses to mutant haplotypes, and should be carried out where large selective differences are expected.
While in this work we have analysed only populations in which a population is split into two subpopulations by neutral markers, analysis of populations with higher numbers of markers would be entirely compatible with our framework. Multiple markers would give an improved description of the system. Lowering the fraction of the population with each marker, the potential for multiple events occurring close together in time in a single marker population would be reduced, allowing for better discrimination of the detail of the underlying haplotype distribution.
Supplementary Material
ACKNOWLEDGEMENTS
We would like to acknowledge the Welcome Trust for support under grant reference 098051. This research was also supported in part by the National Science Foundation under Grant No. NSF PHY05-51164 during a visit at the Kavli Institute of Theoretical Physics (KITP, Santa Barbara, CA). We would like to thank participants of the KITP program on Microbial and Viral Evolution for discussions, Lilia Perfeito and Isabel Gordo for critical reading of an earlier version of this work, and Jeffrey Barrick for providing experimental data.
Conflict of Interest: none declared.
REFERENCES
- Akaike H. A new look at the statistical model identification. IEEE Trans. Autom. Control. 1974;19:716–723. [Google Scholar]
- Atwood K.C., et al. Periodic selection in escherichia coli. Proc. Natl Acad. Sci. USA. 1951;37:146–155. doi: 10.1073/pnas.37.3.146. [DOI] [PMC free article] [PubMed] [Google Scholar]
- Barrett R.D.H., et al. The distribution of beneficial mutant effects under strong selection. Genetics. 2006;174:2071–2079. doi: 10.1534/genetics.106.062406. [DOI] [PMC free article] [PubMed] [Google Scholar]
- Barrick J.E., et al. Escherichia coli rpob mutants have increased evolvability in proportion to their fitness defects. Mol. Biol. Evol. 2010;27:1338–1347. doi: 10.1093/molbev/msq024. [DOI] [PMC free article] [PubMed] [Google Scholar]
- Betancourt A.J., Bollback J.P. Fitness effects of beneficial mutations: the mutational landscape model in experimental evolution. Curr. Opin. Genet. Dev. 2006;16:618–623. doi: 10.1016/j.gde.2006.10.006. [DOI] [PubMed] [Google Scholar]
- Desai M.M., Fisher D.S. Beneficial mutation selection balance and the effect of linkage on positive selection. Genetics. 2007;176:1759–1798. doi: 10.1534/genetics.106.067678. [DOI] [PMC free article] [PubMed] [Google Scholar]
- Eyre-Walker A., Keightley P.D. The distribution of fitness effects of new mutations. Nat. Rev. Genet. 2007;8:610–618. doi: 10.1038/nrg2146. [DOI] [PubMed] [Google Scholar]
- Hegreness M., et al. An equivalence principle for the incorporation of favorable mutations in asexual populations. Science. 2006;311:1615–1617. doi: 10.1126/science.1122469. [DOI] [PubMed] [Google Scholar]
- Hofbauer J., Sigmund K. Evolutionary Games and Population Dynamics. Cambridge, UK: Cambridge University Press; 1998. [Google Scholar]
- Imhof M., Schlotterer C. Fitness effects of advantageous mutations in evolving escherichia coli populations. Proc. Natl Acad. Sci. USA. 2001;98:1113–1117. doi: 10.1073/pnas.98.3.1113. [DOI] [PMC free article] [PubMed] [Google Scholar]
- Kao K.C., Sherlock G. Molecular characterization of clonal interference during adaptive evolution in asexual populations of saccharomyces cerevisiae. Nat. Genet. 2008;40:1499–1504. doi: 10.1038/ng.280. [DOI] [PMC free article] [PubMed] [Google Scholar]
- Lenski R., et al. Long-term experimental evolution in Escherichia-coli. 1. adaptation and divergence during 2,000 generations. Am. Nat. 1991;138:1315–1341. [Google Scholar]
- Orr H.A. The genetic theory of adaptation: a brief history. Nat. Rev. Genet. 2005;6:119–127. doi: 10.1038/nrg1523. [DOI] [PubMed] [Google Scholar]
- Park S.-C., et al. The speed of evolution in large asexual populations. J. Stat. Phys. 2010;138:381–410. [Google Scholar]
- Perfeito L., et al. Adaptive mutations in bacteria: high rate and small effects. Science. 2007;317:813–815. doi: 10.1126/science.1142284. [DOI] [PubMed] [Google Scholar]
- Rouzine I., et al. Transition between stochastic evolution and deterministic evolution in the presence of selection: general theory and application to virology. Microbiol. Mol. Biol. Rev. 2001;65:151. doi: 10.1128/MMBR.65.1.151-185.2001. [DOI] [PMC free article] [PubMed] [Google Scholar]
- Rozen D.E., et al. Fitness effects of fixed beneficial mutations in microbial populations. Curr. Biol. 2002;12:1040–1045. doi: 10.1016/s0960-9822(02)00896-5. [DOI] [PubMed] [Google Scholar]
- Woods R.J., et al. Second-order selection for evolvability in a large Escherichia coli population. Science. 2011;331:1433–1436. doi: 10.1126/science.1198914. [DOI] [PMC free article] [PubMed] [Google Scholar]
Associated Data
This section collects any data citations, data availability statements, or supplementary materials included in this article.