Abstract
Background:
Rhododendron is a group of famous landscape plants with high medicinal value. However, there is no simple or universal manner to discriminate the various species of this group. Deoxyribonucleic acid (DNA) barcoding technique is a new biological tool that can accurately and objectively identify species by using short and standard DNA regions.
Objective:
To choose a suitable DNA marker to authenticate the Rhododendron species.
Materials and Methods:
Four candidate DNA barcodes (rbcL, matK, psbAtrnH, and ITS2 intergenic spacer) were tested on 68 samples of 38 species.
Results:
The psbAtrnH candidate barcode yielded 86.8% sequencing efficiency. The highest interspecific divergence was provided by the psbA-trnH intergenic spacer, based on six parameters, and the Wilcoxon signed rank tests. Although there was not a clear barcoding gap, the Wilcoxon Two sample tests indicated that the interspecific divergence of the psbA-trnH intergenic spacer was significantly higher than the relevant intraspecific variation. The psbA-trnH DNA barcode possessed the highest species identification efficiency at 100% by the BLAST1 method. The present results showed that the psbA-trnH intergenic spacer was the most promising one of the four markers for barcoding the Rhododendron species. To further evaluate the ability of the psbA-trnH marker, to discriminate the closely related species, the samples were expanded to 94 samples of 53 species in the genus, and the rate of successful identification was 93.6%. The psbA-trnH region would be useful even for unidentified samples, as it could significantly narrow their possible taxa to a small area.
Conclusion:
The psbA-trnH intergenic region is a valuable DNA marker for identifying the Rhododendron species.
Keywords: Deoxyribonucleic acid barcoding, psbA-trnH, Rhododendron, species identification
INTRODUCTION
Rhododendron is a very large genus in Ericaceae, with about 1000 known species in the world and more than 500 species in China.[1,2] Most species within this genus are widely cultivated in the temperate and sub-temperate regions as ornamentals.[3] Some Rhododendron species have been used in traditional Chinese medicine for treatment of various diseases. For example, the stems and leaves of Rhododendron simsii Planch and Rhododendron anthopogonoides Maxim have traditionally been used as folk medicines to treat chronic bronchitis.[4] Meanwhile, the fruit, flower, and root of Rhododendron molle (Blum) G. Don relieve joint pains and have a remarkable therapeutic effect on rheumatoid arthritis (RA).[5] However, some species with no medicinal value are easily confused with the medicinal plants because of the similar morphological characteristics. Furthermore, in China, more than sixty species in this genus are poisonous, and some toxic medicinal plants can cause severe poisoning if they are confused with others.[4–6] Therefore, it is extremely important to accurately identify the Rhododendron species.
As the genus was established by Linnaeus, various methods have been constantly used to revise its classification system on the basis of morphology, cytology, chemotaxonomy, and molecular taxonomy. The contemporary classifications of Rhododendron are based on the seminal publication of Sleumer.[7] Later, some researchers have conducted more morphological studies in infrageneric groupings and those studied have been integrated into the classification of Chamberlain et al.[1] Nowadays, this taxonomic system is generally accepted by Rhododendron specialists.[8] However, the Rhododendron genus still has some problems at various systematic classification levels and there is no simple or universal manner to discriminate the various species within the genus.
The DNA barcoding, based on a short DNA sequence to identify species has been proposed as a rapid, accurate, and convenient taxonomic tool.[9,10] The Consortium for the Barcode of Life (CBOL) Plant Working Group recommended the rbcL + matK combination as a barcode sequence in the plant kingdom, and they also suggested that ITS (ITS2) and psbA-trnH were good candidates for plant DNA barcoding, because of their fast evolution rates.[11] Chen et al. found that the ITS2 region possessed many advantages compared to the plastid loci, including the rbcL and matK regions. They also recommended that psbA-trnH could be a complementary barcode to ITS2 for a broad series of plants.[12] One of the problems for plant DNA barcoding was that the previous studies were mainly carried out on a large scale and rarely on a specific genus, with many closely related species, so some studies suggested that species identification using standard DNA sequences should be carried out within a narrow taxon (such as the genus).[13,14] In this study, we tried to assess the suitability of four potential DNA regions (psbA-trnH, matK, rbcL, and ITS2) as a DNA barcode, to identify species of Rhododendron across 68 samples belonging to 38 species. One of the challenges for any DNA barcode was its ability in discriminating closely related species (i.e., sister-species).[13,15] Furthermore, to evaluate the ability of the psbA-trnH region, the tested data were expanded to 94 samples belonging to 53 species, including 37 samples of 20 species within Subgenus Hymenanthes and 24 samples of 13 species within Subgenus Tsutsusi based on Chamberlain's classification system.[1]
MATERIALS AND METHODS
Plant materials
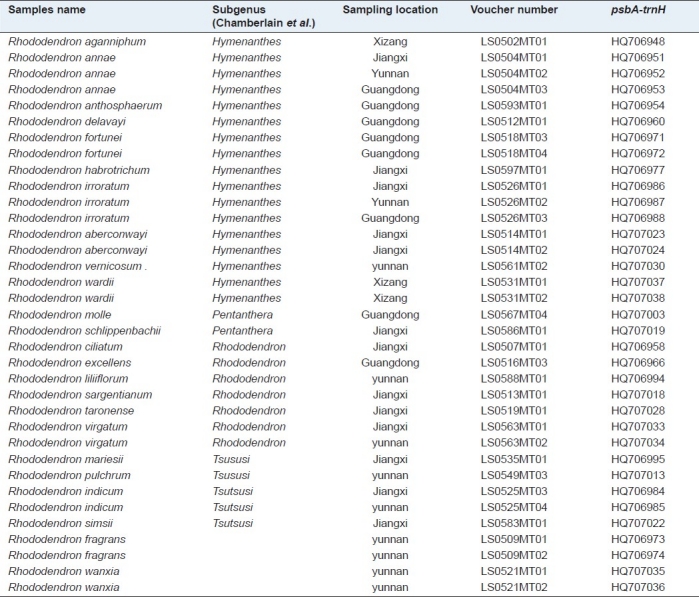
All experimental samples were collected and authenticated by Prof. Lehua Zhang (Lushan Botanical Garden, The Chinese Academy of Sciences), a specialist in taxonomy and cultivation of Rhododendron plants. The voucher samples were kept in the Lushan Botanical Garden and the voucher images were deposited in the herbarium of the Hubei University of Chinese Medicine. Information on the 68 samples belonging to the 38 species is given in Table 1 and the information on the expanded samples for further evaluating the identification efficiency of psbA-trnH is given in Table 2. The subgenus of all the samples are based on Chamberlain's classification system.[1]
Table 1.
The collection sites and GenBank accession of 68 samples of the Rhododendron genus
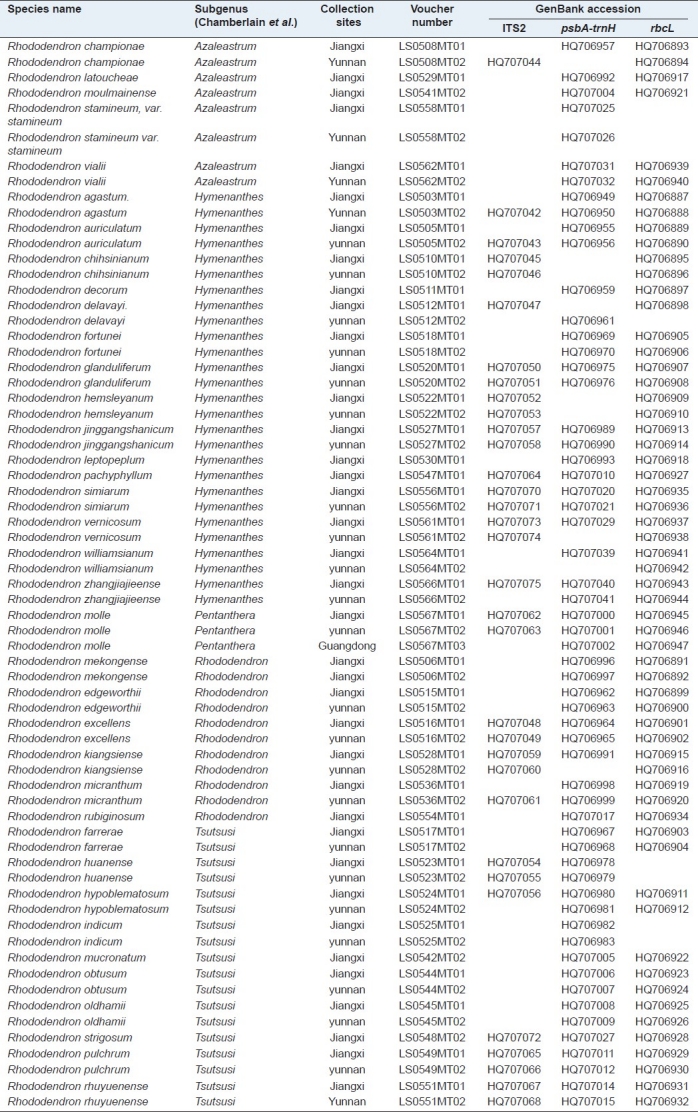
Table 2.
The collection sites and GenBank accession of expanded samples of the Rhododendron genus
DNA extraction, amplification, and sequencing
Leaf tissues were first dried in silica gel. The total DNA was extracted as instructed by the Plant Genomic DNA Kit (Tiangen Biotech Co., China). The PCR reaction mixture consisted of 2 μL (~ 60 ng) DNA, 4 μL of 25 mM MgCl2, 5 μL of 10 × PCR buffer, 2 U of Taq DNA polymerase, 4 μL of 2.5 mM dNTPs mix (Biocolor BioScience and Technology Co., China), and 2.0 μL of 2.5 μM primers (Synthesized by Sangon Co., China); and the final volume was 50 μL. Sequences of the universal primers for the tested DNA barcode, as well as general PCR reaction conditions, were obtained from previous studies.[12] The PCR products were examined with 1.5% agarose gel electrophoresis and purified using the Gel Band Purification Kit (Tiangen Biotech Co., China) and then sequenced on an ABI3730XL sequencer (Applied Biosystems, USA). The sequences were submitted to the GenBank [Tables 1 and 2].
Sequence editing and contig assembly were conducted by the CodonCode Aligner (CodonCode Co., Germany). The sequences were aligned using CLUSTALW and analyzed using the program MEGA 4.0. Average interspecific distances, theta prime, and the smallest interspecific distances were used to characterize the interspecific divergences.[12,16,17] Average intraspecific distances, theta, and coalescent depth were calculated to determine intraspecific variations, using K2P distances.[17] Wilcoxon signed rank tests were performed as described previously.[18,19] We calculated the barcoding gap using the TAXON DNA.[17,18] To estimate the reliability of species identification using DNA barcoding technique, the BLAST1 method was used.[20]
RESULTS
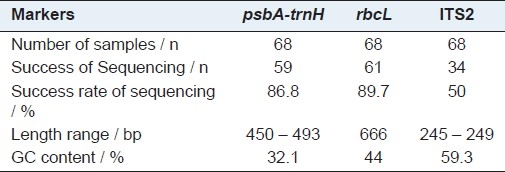
In order to be useful, a DNA barcode sequence must be easily PCR amplified with universal reaction conditions and primers, and then successfully sequenced. In our pilot study, we tested the efficiency of sequencing, by employing 68 samples, and the results showed that rbcL, psbA-trnH, and ITS2 candidate barcodes yielded 89.7, 86.8, and 50% success rates of sequencing, respectively [Table 3]. However, the efficiency of the matK region was very poor, hence matK was not included in the subsequent experiments. The sequence lengths, GC contents of the three regions based on the results of the CodonCode Aligner and Clustal W alignment are presented in Table 3.
Table 3.
Success rate of sequencing, Length range, GC content
An ideal DNA barcode should own significant interspecific variation in DNA sequences, with a comparatively small variation between individuals, within a single species.[17,21,22] Therefore, six metrics were employed to characterize interspecific versus intraspecific variation. Through comparison of interspecific genetic distances among congeneric species for three candidate barcodes, the chloroplast non-coding region psbA-trnH exhibited the highest interspecific divergence with all three metrics, followed by ITS2, while rbcL provided the lowest [Table 4]. Moreover, the Wilcoxon signed rank tests confirmed that psbA-trnH provided the highest interspecific divergence between the congeneric species [Table 5]. We also found that rbcL showed the lowest level of intraspecific variation with all three parameters, followed by ITS2, while psbA-trnH provided the highest [Table 4]. The Wilcoxon signed rank tests showed that rbcL has the lowest variation between conspecific individuals, whereas, psbA-trnH showed the highest [Table 6].
Table 4.
Inter- and intraspecific genetic divergences of three candidate barcodes

Table 5.
Wilcoxon signed rank test for interspecific variations

Table 6.
Wilcoxon signed rank test for intraspecific variations

The DNA barcode should exhibit a ‘barcoding gap’ between interspecific and intraspecific divergences.[17,18] Although there was no clear gap in the histogram between intraspecific variation and interspecific divergence in the distributions of the three loci (rbcL, TS2, psbA-trnH intergenic spacer) [Figure 1], the Wilcoxon two sample tests indicated that for the three loci the distribution of interspecifc divergences were higher than those of the corresponding intraspecific variations, with high significance [Table 7].
Figure 1.
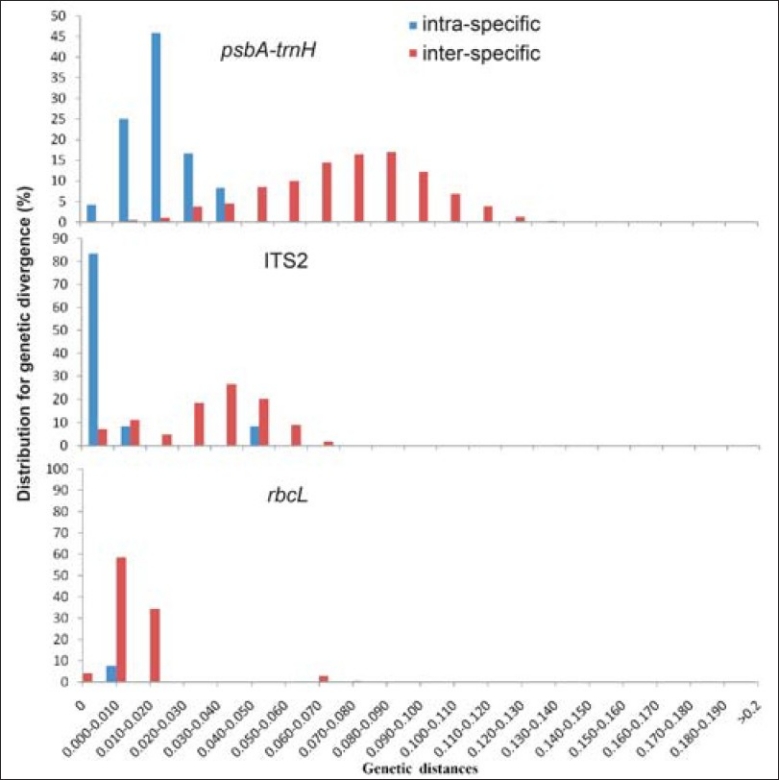
The barcoding gap between interspecific and intraspecific divergences for three candidate barcodes. Histograms showing the relative distribution of pairwise (y-axes) intraspecific (blue bar) and interspecific (red bar) divergence distance estimates (x-axes) for psbAtrnH, ITS2, and rbcL intergenic spacers, respectively. The divergences were calculated using the Kimura 2-Parameter (K2P) model. Barcoding gaps were assessed by the Wilcoxon two-sample tests, and all were highly significant (P < 0.0001)
Table 7.
Wicoxon two-sample tests for distribution of intra- versus interspecific divergences
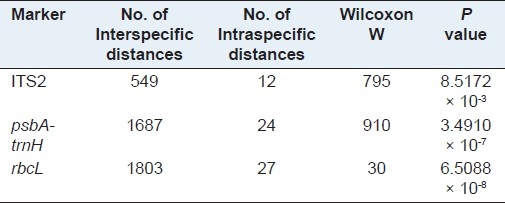
The BLAST1 method was used to test the applicability of different regions, for species identification.[20] The results indicated that the psbA-trnH intergenic spacer possessed the highest species identification efficiency at 100%, followed by rbcL at 59%, then ITS2 at 41.2% [Table 8]. To further evaluate the ability of the psbA-trnH region to identify the Rhododendron species with more closely related species in a wider range, 94 samples were tested. The rate of correct identification was 93.6% [Table 8], with six failed samples [Table 9].
Table 8.
Identification efficiency for potential deoxyribonucleic acid barcodes loci using the BLAST1 method

Table 9.
Unsuccessful identification sample pairs in BLAST1 based on Chamberlain's classification system

DISCUSSION
In the present research, the feasibility of four potential DNA regions (psbA-trnH, matK, rbcL, ITS2) as a DNA barcode of the Rhododendron species was concretely tested. The rbcL sequence showed advantages of higher efficiency of PCR amplification and sequencing [Table 3]. However, the variation of the sequence in the species level was insufficient to discriminate the Rhododendron species, and the identification efficiency was only 59% [Table 8]. The matK showed lower sequencing efficiency and its successful identification rate of 131 samples from the GenBank database was 43.8%. At the Third International Barcoding Conference, the Plant Working Group of the Consortium for the Barcode of Life recommended the two-locus combination of rbcL + matK, for plant barcoding.[11] The two proposed regions were the most useful barcodes and provided a universal framework for land plants at and above the generic levels.[13] However, they showed a lower resolution rate to identify the species within a rapid evolutionary genus such as Rhododendron. In the meantime, many researchers have proposed the use of ITS2 as a suitable marker for taxonomic classification.[12,23,24] However, in our study, the success rate of sequencing with ITS2 was only 50% [Table 3], and the identification efficiency was only 41.2% [Table 8]. Above all, the results indicated that matK, rbcL, and ITS2 were not suitable as barcodes for the identification of the Rhododendron species.
The psbAtrnH intergenic spacer is among the most variable regions in the angiosperm chloroplast genome. It is a popular tool for plant population genetics and species level phylogenetics and has been proposed to be suitable for the DNA barcoding studies.[25,26] Rhododendron is a rapidly evolutionary genus within the angiosperms in recent years with many closely related species and there are many artificial and natural hybrids.[27] The psbA-trnH region is one of the most variable non-coding regions of the plastid genome in the angiosperms, because of the highest percentages of variable sites.[28–30]
Moreover this variation indicated that this inter-genic spacer could offer high levels of species discrimination.[27,28] In our study, first we found that the average length of the psbA-trnH intergenic spacer was rather short at 450 – 493 base pairs. The psbA-trnH sequences were relatively easy to be amplified using one pair of universal primers. Second, examination of the genetic divergences using six parameters and statistical tests confirmed that the psbA-trnH intergenic spacer possessed high interspecific divergence. Analyses of the DNA barcoding gap and the Wilcoxon twosample tests supported the notion that the mean interspecific divergence of the psbAtrnH intergenic spacer was significantly higher than its mean intraspecific variation. Third, according to the BLAST1 method, the identification accuracy using the psbAtrnH intergenic spacer was 100%, and it could identify all the species that could be identified by ITS2 or rbcL. Therefore, it was quite clear that among the four sequences, psbA-trnH was the most promising one for barcoding the species within the rapid evolutionary genus.
One of the challenges for any DNA barcode is its utility in discriminating closely related species.[13,15] In this study, to further evaluate the ability of the psbA-trnH region, to identify the closely related species in a wider range, the samples were expanded to 94 samples belonging to 53 species. The result showed that the psbA-trnH region steadily kept a higher identification efficiency. Furthermore, we specifically tested the identification ability of psbA-trnH in two subgenera, and it showed that the success rate of identification was 100% for 24 samples of 13 species from Subgenus Tsutsusi and 89.2% for 37 samples of 20 species from Subgenus Hymenanthes. Therefore, psbA-trnH was confirmed as a useful marker for differentiating closely related species within Rhododendron.
Meanwhile, we noted that there were three pairs of samples which could not be accurately identified [Table 9]. The first and second pairs from three species, Rhododendron annae, Rhododendron irroratum, and Rhododendron aberconwayi, belonged to the same subsection Irrorata, as they shared exceedingly similar morphological characteristics of the corolla shape, leaves shape, glabrous petiole, and pedicel.[2] The third pair, R. excellens and R. virgatum, was classified by Chamberlain as the same subgenus Rhododendron and the same section Rhododendron, because of their similar morphological characters: Both of them have termina inflorescence buds, vary rarely axillary from lower leaves and the whole plant of them is densely covered with peltate scales.[1,2] The failure of psbA-trnH in discriminating these species indicated that some morphologically similar species had no sufficient interspecific variation in the psbA-trnH region. In spite of this, the psbA-trnH region would still be significant for those unidentified samples as it could narrow their possible taxa to a small area, one subgenus, one section, or even to one subsection [Table 9].
CONCLUSION
The psbA-trnH intergenic region is a potential DNA barcoding sequence for identifying the Rhododendron species. Furthermore, it would still be useful, even for those unidentified species, because it could significantly narrow the possible taxa to a small area.
ACKNOWLEDGEMENTS
This work was supported by the International Cooperation Program of Science and Technology (No. 2007DFA30990 and 2007DFA31410), the Special Funding for Ministry of Health (No. 200802043), and the Subject Leaders Training Program of Jiangxi Province (No. 2010DD00500).
Footnotes
Source of Support: International Cooperation Program of Science and Technology (No. 2007DFA30990 and 2007DFA31410), the Special Funding for Ministry of Health (No. 200802043), and the Subject Leaders Training Program of Jiangxi Province (No. 2010DD00500).
Conflict of Interest: None declared.
REFERENCES
- 1.Chamberlain DF, Hyam R, Argent G, Fairweather G, Walter KS. The genus Rhododendron: Its Classification and Synonymy. Edinburgh: Royal Botanic Gardens; 1996. [Google Scholar]
- 2.Fang MY, Fang RC, He MY, Hu LZ, Yang HB. Rhododendron Linnaeus. Flora China. 2005;14:260–455. [Google Scholar]
- 3.Craven LA, Goetsch LA, Hall BD, Brown GK. Classification of the Vireya group of Rhododendron (Ericaceae) Blumea. 2008;53:435–42. [Google Scholar]
- 4.Wang MJ. Study on Antitussive, Antiasthmatic Effects and Toxicity of Total Flavanoid of Rhododendron simsii Planch. Lishizhen Med Mater Med Res. 2006;17:1678–9. [Google Scholar]
- 5.Xiang YN, Zhang CG, Zheng YJ. Studies on the Chemical Constituents of the roots of Rhododendron molle G. DON. J Huazhong Univ Sci Technol. 2004;24:202–4. doi: 10.1007/BF02885430. [DOI] [PubMed] [Google Scholar]
- 6.Zhong GH, Hu MY. Advances in Studies on Activity Constituents of Ericaceae and Their Mechanisms. J Wuhan Bot Res. 2000;18:509–14. [Google Scholar]
- 7.Sleumer H. Ein system der gattung Rhododendron L. Bot Jahrb Syst. 1949;74:511–53. [Google Scholar]
- 8.Cox PA, Cox KN. Encyclopedia of Rhododendron species. Perth: Glendoick Publishing; 1997. [Google Scholar]
- 9.Hebert PD, Cywinska A, Ball SL, de Waard JR. Biological identifications through DNA barcodes. Proc Biol Sci. 2003;270:313–21. doi: 10.1098/rspb.2002.2218. [DOI] [PMC free article] [PubMed] [Google Scholar]
- 10.Han JP, Song JY, Liu C, Chen J, Qian J, Zhu YJ, et al. Identification of Cistanche species (Orobanchaceae) based on sequences of the plastid psbA-trnH intergenic region. Acta Pharmaceutica Sinica. 2010;45:126–30. [PubMed] [Google Scholar]
- 11.CBOL Plant Working Group. A DNA barcode for land plants. Proc Natl Acad Sci USA. 2009;106:12794–7. doi: 10.1073/pnas.0905845106. [DOI] [PMC free article] [PubMed] [Google Scholar]
- 12.Chen SL, Yao H, Han JP, Liu C, Song JY, Shi LC, et al. Validation of the ITS2 region as a novel DNA barcode for identifying medicinal plant species. PLoS One. 2010;5:e8613. doi: 10.1371/journal.pone.0008613. [DOI] [PMC free article] [PubMed] [Google Scholar]
- 13.Ren BQ, Chen ZD. DNA Barcoding Plant Life. Chin Bull Bot. 2010;45:1–12. [Google Scholar]
- 14.Nitta JH. Exploring the utility of three plastid loci for biocoding the filmy ferns (Hymenophyllaceae) of Moorea. Taxon. 2008;57:725–36. [Google Scholar]
- 15.Newmaster SG, Fazekas AJ, Steeves RA, Janovec J. Testing candidate plant barcode regions in the Myristicaceae. Mol Ecol Resour. 2008;8:480–90. doi: 10.1111/j.1471-8286.2007.02002.x. [DOI] [PubMed] [Google Scholar]
- 16.Meier R, Zhang GY, Ali F. The use of mean instead of smallest interspecific distances exaggerates the size of the “Barcoding Gap” and leads to misidentification. Syst Biol. 2008;57:809–13. doi: 10.1080/10635150802406343. [DOI] [PubMed] [Google Scholar]
- 17.Meyer CP, Paulay G. DNA barcoding: Error rates based on comprehensive sampling. PLoS Biol. 2005;3:2229–38. doi: 10.1371/journal.pbio.0030422. [DOI] [PMC free article] [PubMed] [Google Scholar]
- 18.Lahaye R, van der Bank M, Bogarin D, Warner J, Pupulin F, Gigot G. DNA barcoding the floras of biodiversity hotspots. Proc Natl Acad Sci USA. 2008;105:2923–8. doi: 10.1073/pnas.0709936105. [DOI] [PMC free article] [PubMed] [Google Scholar]
- 19.Kress WJ, Erickson DL. A Two-Locus Global DNA Barcode for Land Plants: The Coding rbcL Gene Complements the Non-Coding trnH-psbA Spacer Region. PLoS One. 2007;2:e508. doi: 10.1371/journal.pone.0000508. [DOI] [PMC free article] [PubMed] [Google Scholar]
- 20.Ross HA, Murugan S, Li WL. Testing the reliability of genetic methods of species identification via simulation. Syst Biol. 2008;57:216–30. doi: 10.1080/10635150802032990. [DOI] [PubMed] [Google Scholar]
- 21.Moritz C, Cicero C. DNA barcoding: Promises and pitfalls. PLoS Biol. 2004;2:1529–34. doi: 10.1371/journal.pbio.0020354. [DOI] [PMC free article] [PubMed] [Google Scholar]
- 22.Slabbinck B, Dawyndt P, Martens M, De Vos P, De Baets B. TaxonGap: A visualization tool for intra- and inter-species variation among individual biomarkers. Bioinformatics. 2008;24:866–7. doi: 10.1093/bioinformatics/btn031. [DOI] [PubMed] [Google Scholar]
- 23.Miao M, Warren A, Song WB, Wang S, Shang HM, Chen ZG. Analysis of the internal transcribed spacer 2 (ITS2) region of scuticociliates and related taxa (Ciliophora, Oligohymenophorea) to infer their evolution and phylogeny. Protist. 2008;159:519–33. doi: 10.1016/j.protis.2008.05.002. [DOI] [PubMed] [Google Scholar]
- 24.Schultz J, Maisel S, Gerlach D, Müller T, Wolf M. A common core of secondary structure of the internal transcribed spacer 2 (ITS2) throughout the Eukaryota. RNA. 2005;11:361–4. doi: 10.1261/rna.7204505. [DOI] [PMC free article] [PubMed] [Google Scholar]
- 25.Storchová H, Olson MS. The architecture of the chloroplast psbA-trnH non-coding region in angiosperms. Plant Syst Evol. 2007;268:235–56. [Google Scholar]
- 26.Ma YP, Zhang CQ, Zhang JL, Yang JB. Natural Hybridization between Rhododendron delavayi and R. cyanocarpum (Ericaceae), from Morphological, Molecular and Reproductive Evidence. J Integr Plant Biol. 2010;52:844–51. doi: 10.1111/j.1744-7909.2010.00970.x. [DOI] [PubMed] [Google Scholar]
- 27.Kress WJ, Wurdack KJ, Zimmer EA, Weigt LA, Janzen DH. Use of DNA barcodes to identify flowering plants. Proc Natl Acad Sci USA. 2005;102:8369–74. doi: 10.1073/pnas.0503123102. [DOI] [PMC free article] [PubMed] [Google Scholar]
- 28.Shaw J, Lickey EB, Schilling EE, Small RL. Comparison of whole chloroplast genome sequences to choose noncoding regions for phylogenetic studies in angiosperms. The tortoise and the hare III. Am J Bot. 2007;94:275–88. doi: 10.3732/ajb.94.3.275. [DOI] [PubMed] [Google Scholar]
- 29.Song JY, Yao H, Li Y, Li XW, Liu C, Han JP, et al. Authentication of the family Polygonaceae in Chinese pharmacopoeia by DNA barcoding technique. J Ethnopharmacol. 2009;124:434–9. doi: 10.1016/j.jep.2009.05.042. [DOI] [PubMed] [Google Scholar]
- 30.Yao H, Song JY, Ma XY, Liu C, Li Y, Xu HX, et al. Identification of Dendrobium species by a candidate DNA barcode sequence: The chloroplast psbA-trnH intergenic region. Planta Med. 2009;75:667–9. doi: 10.1055/s-0029-1185385. [DOI] [PubMed] [Google Scholar]


