Background: Overcoming resistance to apoptosis is a major challenge in the treatment of human proliferative disease.
Results: Cell volume regulatory mechanisms inhibit apoptosis in lymphoid cells.
Conclusion: Intracellular ions influence cellular life/death decisions.
Significance: Disabling ionic homeostasis in tumor cells may aid in the activation of cell death.
Keywords: Apoptosis, Cell Death, Flow Cytometry, Lymphocyte, Stress Response, Cell Volume Regulation, Osmotic Stress, Regulatory Volume Increase
Abstract
Apoptosis is a stochastic, physiological form of cell death that is characterized by unique morphological and biochemical properties. A defining feature of apoptosis in all cells is the apoptotic volume decrease or AVD, which has been considered a passive component of the cell death process. Most cells have inherent volume regulatory increase (RVI) mechanisms to contest an imposed loss in cell size, however T-cells are unique in that they do not have a RVI response. We utilized this property to explore potential regulatory roles of a RVI response in apoptosis. Exposure of immature T-cells to hyperosmotic stress resulted in a rapid, synchronous, and caspase-dependent apoptosis. Multiple rounds of osmotic stress followed by recovery of cells in normal media resulted in the development of a population of cells that were resistant to osmotic stress induced apoptosis. These cells were also resistant to other apoptotic stimuli that activate via the intrinsic cell death pathway, while remaining sensitive to extrinsic apoptotic stimuli. Interestingly, these osmotic stress resistant cells showed no increase in anti-apoptotic proteins, and released cytochrome c from their mitochondria following exposure to intrinsic apoptotic stimuli. The osmotic stress resistant cells developed a RVI response, and inhibition of the RVI restored sensitivity to apoptotic agents. Analysis of apoptotic signaling pathways showed a sustained increase in phospho-AKT, whose inhibition also prevented an RVI response resulting in apoptosis. These results define a critical role of volume regulation mechanisms in apoptotic resistance.
Introduction
The loss of cell volume, or cell shrinkage, is a defining characteristic of apoptosis from the initial description of this physiological mode of cell death (1). A unique aspect of this apoptotic loss of cell volume is that it occurs within an isotonic environment, which is in stark contrast to cell volume alterations that result from osmotic changes in the extracellular environment. The term apoptotic volume decrease (AVD)2 has been used to denote this unique characteristic of apoptosis (2). Previous reports have suggested the AVD is both a necessary and sufficient inducer of apoptosis (3–6), which depends on the underlying movement of K+, Na+, and Cl− to permit the activation of caspases and apoptotic nuclease activity (7–10).
Resistance to apoptosis has been shown to occur through a variety of mechanisms including increased expression of anti-apoptotic proteins, decreased expression of pro-apoptotic proteins, along with alterations in other critical apoptotic proteins such as death receptors, caspases, and kinases (11, 12). Mammalian cells also have other inherent regulatory mechanisms to protect themselves from adverse extracellular conditions and to preserve cell viability (13). The cell volume regulatory mechanisms consisting initially of ionic transporters, channels, and exchangers are activated upon a loss of cell volume to re-establish a near normal cell size, however the role of these proteins in regards to apoptotic resistance is unclear. Our studies take advantage of the fact that T-cells do not have an active inherent regulatory volume increase (RVI) response (14, 15), to evaluate the contribution of this process to apoptotic resistance.
We employed osmotic stress to physically induced cell shrinkage in a murine immature T-cell line, S49 (devoid of an inherent RVI response). This stressor induced a very rapid and synchronous caspase-dependent apoptosis of the cells. Exposure of the cells to multiple rounds of osmotic stress and recovery resulted in a unique population of cells that were resistant to a variety of intrinsic apoptotic stimuli, while remaining sensitive to extrinsic apoptotic stimuli. Interestingly, these osmotic stress-resistant cells gained an inherent RVI response, inhibition of which sensitizes the cells to intrinsic apoptosis. Our work shows that volume regulation mechanisms contribute significantly to apoptotic resistance.
EXPERIMENTAL PROCEDURES
Cell Culture and Chemicals
S49 Neo cells are S49.1 mouse lymphoma cells stably infected with a recombinant amphotropic retrovirus carrying a G418 antibiotic resistance gene (3). Cells were maintained in RPMI 1640 supplemented with 10% heat-inactivated fetal calf serum (hi-FCS), 4.8 mm glutamine, 100 μg/ml streptomycin and 100 units/ml penicillin at 37 °C, 7% CO2 atmosphere. Standard RPMI 1640 was made hyperosmotic or hypoosmotic by the addition of solid mannitol or diluting with distilled water, respectively, prior to the addition of the supplemental components. All media was examined for maintaining isotonicity using a 5500 vapor pressure osmometer (Wescor, Inc., Logan, UT). The irreversible caspase inhibitor z-VAD-fmk and Fas ligand were purchased through Kamiya Biomedical (Seattle, WA). Dexamethasone was purchased through Steraloids (Wilton, NH), staurosporine and AKT inhibitor VIII through Calbiochem (La Jolla, CA), and thapsigargin, flufenamic acid, mefenamic acid, sodium salicylate, 5-(N-methyl-N-isobutyl)-amiloride (MIA), and 5-(N-ethyl-N-isopropyl)-amiloride (EIPA) was purchased through Sigma.
Cell Volume Analysis
Cell volume was determined via electronic sizing using a Cell Lab Quanta flow cytometer (Beckman Coulter) equipped with a 488 nm laser. The electronic volume (EV) channel was calibrated using 6 μm 488 nm excitable AlignFlow beads (Molecular Probes). Cells at a density of 1 × 10⁶ cells/ml were centrifuged and resuspended in normal or anisotonic RPMI 1640 media and examined as described in the results. An electronic volume gate was used to eliminate cell debris and to exclude portions of cells (apoptotic bodies) that may be formed and released during the apoptosis. The percent change in mean cell volume (MCV) was determined by subtracting the anisotonic value from the normal control value (×100) for each individual time point.
Flow Cytometric Analysis of Caspase Activity and DNA Content
Caspase activity for caspase-3/7-like enzymes was accomplished using a CaspaTag in situ assay kit (Chemicon) according to the manufacturer's instructions. Briefly, 1 h prior to cytometric analysis, 300 μl of cells were added to 10 μl of a 30× CaspaTag reagent working stock. Immediately prior to cytometric analysis, the cells were washed in 2 ml of CaspaTag wash buffer, and then resuspended in 500 μl of PBS. 2 μl of propidium iodide (PI; supplied in the kit) was added to each sample, and the cells were examined using a Becton Dickinson FACSort equipped with CellQuest software. For each sample, 10,000 cells were excited with a 488 nm laser and examined at 530 nm and 585 nm for CaspaTag and PI fluorescence, respectively.
Analysis of DNA was accomplished using an ethanol fixation/propidium iodide protocol. Cells were harvested from the culture media and fixed by the slow addition of ∼3 ml of cold 70% ethanol with agitation. The volume was adjusted to 5 ml with cold 70% ethanol and the cells stored at −20 °C for up to 1 week. Fixed cells were pelleted by centrifugation from the ethanol, washed once in 1× PBS, and stained in 1 ml of 20 μg/ml propidium iodide, 1 mg/ml RNase in 1× PBS. Stained cells were examined on a FACSort flow cytometer using CELLQuest software (Becton Dickinson Immunocytometry Systems, San Jose, CA). Individual cells (7500 per experimental sample) were selected by gating on an area versus width dot plot to exclude cell debris and aggregates. The percent of degraded DNA was determined by the number of cells with subdiploid DNA divided by the total number of cells under each experimental condition.
Determination of Intracellular Potassium and Sodium by Flow Cytometry or Atomic Absorption Spectrophotometry
Analysis of intracellular sodium and potassium by flow cytometry was accomplished as described previously (16). Briefly, 2 μl of 2.5 mm CoroNa Green-AM (Na+) or PBFI-AM (K+) (Molecular Probes) stock were added to 1 ml of cells for a final concentration of 5 μm 1 h prior to the time of examination. For intracellular calcium measurements, 1 μl of a 1 mm Fluo-3 (Ca2) (Molecular Probes) stock was added to 1 ml of cells for a final concentration of 1 μm 30 min prior to the time of examination. Incubation was continued at 37 °C, 7% CO2 atmosphere. Immediately prior to flow cytometric examination, PI (Sigma) was added to a final concentration of 10 μg/ml. Ten thousand cells were analyzed by sequential excitation of the cells containing PBFI-AM (350 nm ex; 425 nm em), CoroNa Green-AM and Fluo-3-AM (488 nm ex; 530 nm em), and PI (488 nm ex; 575 nm em) using a LSRII flow cytometer (Becton Dickinson) and FACSDiVa software. Only cells that did not lose their membrane integrity (PI-negative cells) were included in the analysis for relative intracellular ion concentrations.
For atomic absorption studies, two million cells per sample were initially treated under control or hyperosmotic stress for 150 min, a time prior to a major loss of membrane integrity. Cells were harvested and washed twice in ice-cold isotonic (for control cells) or hypertonic (for hyperosmotic cells) magnesium chloride. Samples were then resuspended in 200 μl of a 30% nitric acid solution and incubated overnight at 37 °C under constant agitation. Protein was measured using a Bio-Rad assay. Analysis of the potassium and sodium content was measured using a PerkinElmer Life Sciences AA800 flame spectrophotometer. A five-point potassium or sodium standard calibration protocol of known standards was used to optimize the instrument. Samples were diluted 1:250 or 1:25 for potassium and sodium, respectively and measured in triplicate. The spectrophotmeter and protein values were used to calculate the micromolar of ion per mg protein for each sample.
Generation of Osmotic Stress (OS) Cells
S49 (Neo) cells were exposed to RPMI 1640 media containing 500 mm mannitol for 4 h at 37 °C, 7% CO2 atmosphere. After this time, the cells were centrifuged at 3,000 rpm, then returned to normal RPMI 1640 media, and incubated at 37 °C, 7% CO2 atmosphere. Over a period of 7–10 days of culture, the surviving cells regenerated to a viable population of cells in the presence of normal RPMI 1640 media. This protocol was repeated to generate cells that were repetitively exposed to 500 mm mannitol for 4 h then recovered for multiple generations.
Pro- and Anti-apoptotic Protein and Apoptotic Signaling Analysis
S49 (Neo) or S49 (OS4–15) cells (5 × 10⁶) were suspended in buffer containing 20 mm Tris, 2 mm EDTA, 150 mm NaCl, 0.5% Triton X-100 and protease inhibitors (Complete Mini protease mixture, Roche, IN) by repeated pipetting. The cells were sonicated for 10 s on ice. Samples of each lysate were assayed in a Beckman DU650 spectrophotometer for protein concentration using Bio-Rad Protein Assay Reagent (Bio-Rad). Laemmli-loading buffer containing glycerol, SDS, and bromphenol blue was added to each sample at a 1:1 ratio and then boiled for 5 min. The samples were stored at −80 °C until electrophoresis and Western blot analysis for apoptosis associated proteins. Western blotting: whole cell lysates were separated on a 4–20% Tris-glycine gel (Invitrogen) and transferred to a nitrocellulose membrane. The membranes were blocked in TBS-0.5% TWEEN-20 (TBS-T) containing 10% nonfat milk for 2 h at room temperature, washed with TBS-T and incubated overnight at 4 °C in anti-bcl-2, anti-bcl-XL, anti-bax, anti-bim, anti-caspase 8, anti-caspase 9, anti-caspase 3, and the various kinase antibodies (Cell Signaling), or anti-survivin (Santa Cruz Biotechnology, Santa Cruz CA). The antibody for AKT recognizes both isoforms of phospho-AKT, but is more selective for AKT1. The next day the blots were washed, incubated with peroxidase-conjugated anti-rabbit secondary antibodies for 1 h at room temperature. Bands were visualized using ECL reagents (GE-Amersham Biosciences, Piscataway, NJ). The blots were then washed with TBS-T reprobed with anti-β actin (Millipore, Billerica, MA) following the above protocol except for using anti-mouse secondary antibody. Protein bands were quantitated densitometrically using NIH Image J analysis software and protein levels were normalized to β-actin signal. Average protein levels of at least three experiments were plotted as bar graphs ± S.E. Statistical significance (difference from untreated controls) was determined by Student's t test.
Mitochondrial/Cytosolic Fractionation for Cytochrome c Measurement
Cytosolic and mitochondrial proteins were prepared from S49 (Neo) or S49 (OS4–15) cells by using a cytosolic/mitochondrial subcellular fractionation kit (BioVision Research Products, Mountain View, CA). Briefly, 5 × 10⁷ cells for each sample were washed with cold PBS, resuspended in cytosol extraction buffer and incubated on ice for 10 min. The cells were then lysed using a dounce homogenizer and centrifuged at 700 × g for 10 min. at 4 °C. The supernatant was transferred to a fresh tube and then centrifuged at 10,000 × g for 30 min. at 4 °C. The supernatant from this step is the cytosolic fraction. The pellet was resuspended in mitochondrial extraction buffer, vortexed on high for 10 s to generate the mitochondrial fraction. Protein concentration of each fraction was measured as stated previously. Western blotting analysis was also carried out as described previous except the primary antibody used was anti-cytochrome c (BD-Pharmingen, San Jose, CA). Purity of fractionation was determined by reprobing with anti-VDAC (Biovision, Mountain View, CA), a mitochondrial protein and equal protein loading was determined by reprobing with anti-β-actin (Millipore, Billerica, MA).
Statistics
One-way ANOVA followed by Tukey's multiple comparison tests were used to evaluate the statistical relevance of control and experimental samples. A p value of at least <0.05 was considered significant.
RESULTS
Hyperosmotic Stress Results in a Rapid and Sustained Decrease in Cell Volume and Caspase-dependent Cell Death
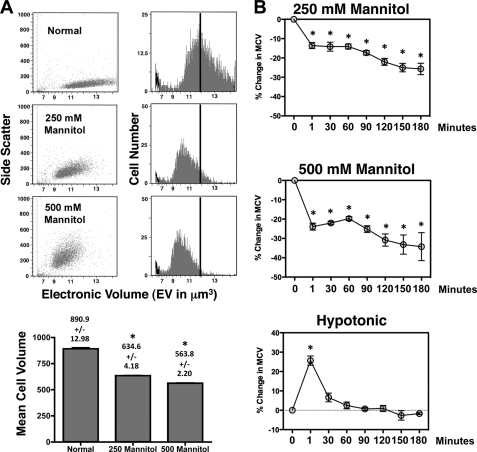
Most mammalian cells have a high permeability to water where an osmotic alteration in their extracellular environment results in a rapid change in cell size. S49 (Neo) cells when challenged with media containing an additional 250 or 500 mm mannitol show a very rapid decrease in cell size (Fig. 1A). The decrease in mean cell volume of 29 and 37% under 250 or 500 mm osmotic stress respectively, was strikingly similar to the initial changes in cell size that occurs during a primary stage of apoptosis (16). When exposed to hyperosmotic stress and examined over time, S49 (Neo) cells shrank and remained shrunken throughout the course of the experiment (Fig. 1B), reflecting a lack of a RVI as previously observed in other T-cells (17, 18). In contrast, when S49 (Neo) cells where exposed to hypoosmotic stress, they swelled and returned to a near normal cell volume within 60 min (Fig. 1B), reflecting an inherent regulatory volume decrease (RVD) response known to occur in most cells.
FIGURE 1.
Hyperosmotic conditions results in a rapid and sustained decrease in cell volume in S49 (Neo) cells. A, S49 (Neo) cells treated with 250 or 500 mOsm mannitol were examined for initial changes in cell size (EV) using a Cell Lab Quanta flow cytometer. An immediate decrease in MCV was observed under both conditions. B, S49 (Neo) cells treated as above were examined over time for changes in cell size. Both conditions resulted in shrunken cells that remained shrunken throughout the time examined, suggesting the absence of an inherent RVI. In contrast, S49 (Neo) cells under a hypoosmotic condition initial showed a rapid increase in cell size that was compensated through an RVD response resulting in a near normal cell volume. Data represent the mean (± S.E.) of three independent experiments. *, p < 0.001 versus control.
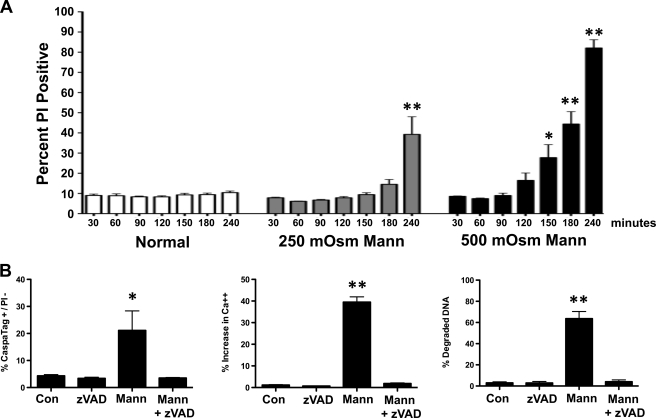
Hyperosmotic stress of lymphoid cells resulted in a very rapid change in viability in both a concentration- and time-dependent manner as determined by flow cytometry, with changes occurring as early as 2–3 h (Fig. 2A). To evaluate the mode of cell death under these conditions, we scrutinized several indices of apoptosis including caspase activity, release of intracellular calcium, and DNA degradation in the presence and absence of z-VAD. Our data support the conclusion that hyperosmotic stress induced cell death in S49 (Neo) cells is apoptosis that occurs in a caspase-dependent manner (Fig. 2B).
FIGURE 2.
Osmotic stress results in a rapid apoptosis in S49 (Neo) cells. A, S49 (Neo) cells treated with 250 or 500 mOsm mannitol were examined for a loss of membrane integrity over time using PI by flow cytometry. Mannitol-treated cells showed both a time and concentration dependent loss of membrane integrity. B, S49 (Neo) cells treated with 250 mOsm mannitol in the presence and absence of 50 μm zVAD. Cells were examined for caspase activity, intracellular calcium, and DNA degradation by flow cytometry after 4 h. In the absence of zVAD, mannitol-treated cells showed caspase activity, increased intracellular calcium, and degraded DNA that was prevented in the presence of zVAD. Data represent mean (± S.E.) of 3 to 4 independent experiments. *, p < 0.01; **, p < 0.001.
Short-term Exposure of T Lymphocytes to Osmotic Stress Induces Synchronous Apoptosis
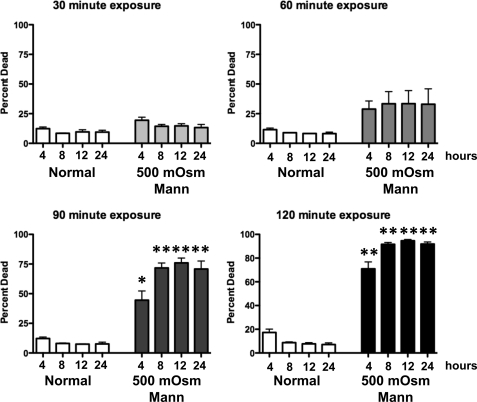
Apoptosis is a stochastic response that occurs one cell at a time. Depending on the cell type and apoptotic stimuli, the onset of cell death may take many hours to days. The rapid occurrence of apoptosis in S49 (Neo) cells following hyperosmotic stress lead us to investigate the synchrony of the process in our model system. This question was addressed by acutely exposing S49 (Neo) cells to hyperosmotic stress, and then returning them to normal media where over time, the initiation of apoptosis was observed. Fig. 3 shows that while a 30-min exposure to hyperosmotic stress had no significant effect on inducing apoptosis, a 60-min hyperosmotic exposure resulted in ∼40% apoptotic cells within 4 h. When S49 (Neo) cells were exposed to hyperosmotic stress for 90 or 120 min before being returned to normal media, a striking simultaneous initiation of apoptosis was observed that peaked at 8 h (Fig. 3). These data indicate that unlike other apoptotic stimuli, hyperosmotic stress results in a highly synchronous initiation of apoptosis.
FIGURE 3.
Apoptosis in S49 (Neo) cells is both a rapid and synchronous under osmotic stress. S49 (Neo) cells were treated with 500 mOsm mannitol for 30, 60, 90, or 120 min, prior to being returned to normal media for various periods of time where they were examined for a loss of membrane integrity. Cells treated for 30 min with 500 mOsm mannitol did not result in a significant increase in dead cells, however cells treated with for either 60, 90, or 120 min resulted in a time dependent rapid increase in the number of dead cells in a synchronous manner. Data represent the mean (± S.E.) of three independent experiments. *, p < 0.01; **, p < 0.001 versus time matched control.
Generation of S49 (OS 4–15) Cells
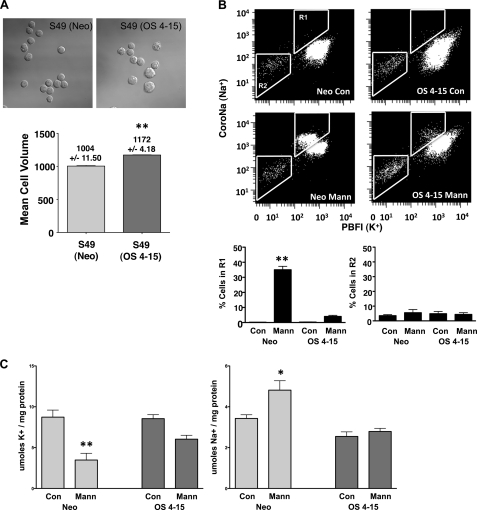
The ability of a few cells to survive hyperosmotic conditions was exploited by exposing S49 (Neo) cells to media containing mannitol, and then returning them to normal media for culture as illustrated in supplemental Fig. S1. A 4-h hyperosmotic stress results in greater than 95% of the cells undergoing cell death. However, over a period of 7–14 days of recovery in normal media, not all cells died, and the small remaining viable population proliferated. Repeating this process for 15 generations of “kill and recovery” resulted in fewer cells undergoing cell death in response to hyperosmotic stress and the development of a cell line designated S49 (OS 4–15). Microscopic examination of the S49 (OS 4–15) cells showed that they were of an inherent larger cell size when compared with the S49 (Neo) cells (Fig. 4A). Analysis of the mean cell volume for both the S49 (Neo) and S49 (OS 4–15) cells showed an ∼15% increase in cell capacity for the latter cells (Fig. 4A). This increase in cell size led us to examine these cells for changes in their intracellular ions, specifically potassium and sodium. Initially, using 2 fluorescent ionic dyes to simultaneously examine sodium and potassium concentrations in these cells, we observed no significant change in intracellular sodium or potassium between the parental cells and the S49 (OS 4–15) cells (Fig. 4B). Interestingly after 4 h of hyperosmotic stress, the S49 (Neo) cells had a reversal in the normal Na+/K+ ratio followed by a decrease in intracellular concentration of both ions previously attributed to the apoptotic volume decrease (Fig. 4B). This reversal of intracellular is similar to our previous studies using different cells and apoptotic agents (16). In marked contrast however, the S49 (OS 4–15) cells did not have this ionic response to hyperosmotic stress (Fig. 4B).
FIGURE 4.
Characterization of S49 (Neo) and S49 (OS 4–15) cells show differences in cell size and intracellular ionic flux under hyperosmotic stress. A, S49 (Neo) and S49 (OS 4–15) cells were initially examined for changes in cell size using DIC microscopy and the Cell Lab Quanta flow cytometer. Microscopic examination of S49 (Neo) and S49 (OS 4–15) cells shows a morphological increase in cell size for the S49 (OS 4–15) cells compared with the parent S49 (Neo) cells. Cell size measurements using flow cytometry shows that the S49 (OS 4–15) cells are ∼15% larger then the S49 (Neo) cells. B, examination of changes in intracellular sodium and potassium in S49 (Neo) and S49 (OS 4–15) cells by flow cytometry after 4 h. Osmotic stress resulted in an initial increase in intracellular sodium accompanied by a decrease in intracellular potassium in S49 (Neo) cells, resulting in the eventual loss of both intracellular ions. In contrast, S49 (OS 4–15) cells did not show this flux in intracellular ions. C, analysis of changes in intracellular sodium and potassium by atomic absorption after 2.5 h. A significant decrease in intracellular potassium and increase in intracellular sodium was only observed in the S49 (Neo) cells after osmotic stress. Data represent the mean (± S.E.) of three independent experiments (A and B) and 11 to 12 independent experiments (C). *, p < 0.01; **, p < 0.001 versus control.
To confirm the results from our studies with the fluorescent ionic dyes, we examined the intracellular ion concentrations in S49 (Neo) and S49 (OS 4–15) cells under control and hyperosmotic conditions by atomic absorption spectrophotometry. S49 (Neo) cells treated cells with 250-mOsm osmotic stress for 150 min, a time prior to the loss of membrane integrity, showed a significant decrease in intracellular potassium coupled to a significant increase in intracellular sodium (Fig. 4C), similar to the observations made by flow cytometry. Treatment of S49 (OS 4–15) cells did not result in a significant change in intracellular sodium and potassium, suggesting that the response is selective for the S49 (Neo) cells.
S49 (OS 4–15) Cells Are Resistant to Hyperosmotic Stress and Multiple Intrinsic Apoptotic Stimuli
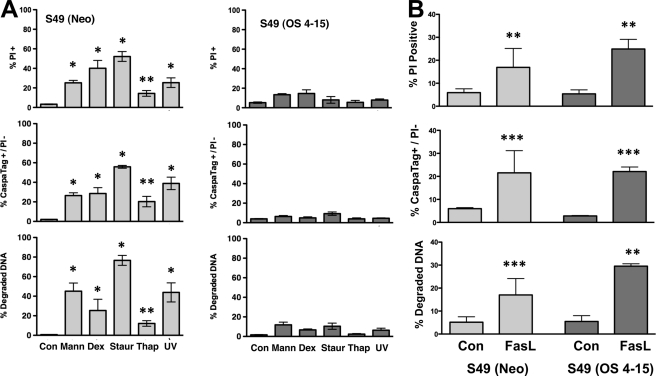
The loss of intracellular sodium and potassium during cell death are known to play a critical role in the activation of the apoptotic machinery (7–10). The apparent absence of this ionic alteration upon hyperosmotic stress in S49 (OS 4–15) cells led us to examine apoptosis in these cells. Exposure of S49 (OS 4–15) cells to hyperosmotic stress for 4 h did not result in a change in viability (Fig. 5A), in marked contrast to the S49 (Neo) cells that died rapidly after identical treatment. We also examined the ability of the S49 (OS 4–15) cells to undergo cell death in response to other apoptotic stimuli. When S49 (Neo) cells were treated with known apoptotic agents including dexamethasone, staurosporine, thapsigargin, or UV, we observed an increase in the percent of PI-positive cells, caspase activity, and degraded DNA establishing their sensitivity to apoptosis (Fig. 5A). In contrast, when S49 (OS 4–15) cells were examined under the same conditions, apoptosis failed to occur (Fig. 5A). Interestingly, all these cell death agents are known to activate apoptosis through the intrinsic mitochondria pathway. Thus, we also examined both S49 (Neo) and S49 (OS 4–15) cells following activation of the extrinsic death receptor pathway with Fas ligand. Treatment with Fas ligand resulted in apoptosis in both osmotic-sensitive and osmotic-resistant cells (Fig. 5B), suggesting that the apoptotic resistance acquired in the S49 (OS 4–15) cells is specific for the intrinsic apoptotic signaling pathway. Clearly the extrinsic apoptotic-signaling pathway remains intact in both of these cell types.
FIGURE 5.
S49 (OS 4–15) cells are resistant to multiple intrinsic apoptotic stimuli, but sensitive to FasL. A, S49 (Neo) and S49 (OS 4–15) cells treated with either 250 mOsm mannitol (4 h), 2.5 × 10⁻⁷ m dexamethasone (48 h), 0.5 μm staurosporine (6 h), 10 μm thapsigargin (6 h), or 75 mJ/cm2 UV (6 h) was examined for cell viability, caspase activity, and DNA degradation. Only the S49 (Neo) cells underwent apoptosis, while the S49 (OS 4–15) cells were resistant to these apoptotic stimuli. B, S49 (Neo) and S49 (OS 4–15) cells treated in the presence and absence of 100 ng/ml Fas ligand for 24 h had a similar degree of apoptosis. Data represent the mean (± S.E.) of at least three independent experiments, Data represent the mean (± S.E.) of three independent experiments. *, p < 0.001; **, p < 0.01; ***, p < 0.05 versus control.
Apoptotic Pathway Analysis in S49 (OS 4–15)-resistant Cells
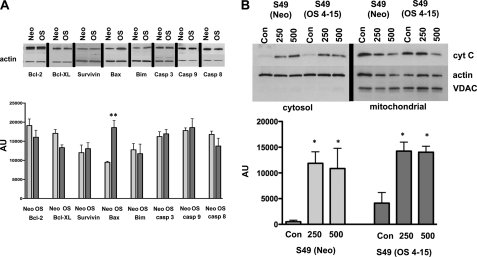
Cell life/death decisions are often thought to be based on a balance between pro- and anti-apoptotic factors. Thus, we examined the expression of various pro-and anti-apoptotic proteins including Bcl-2, Bcl-XL, Survivin, Bim, caspase-3, caspase-9, and caspase-8 in both the osmotically sensitive and osmotically resistance lymphoid cells. Analysis of protein expression showed no significant difference in the level of these proteins between the S49 (Neo) and S49 (OS 4–15) cells (Fig. 6A), with the exception of an increased expression in the pro-apoptotic protein Bax in the S49 (OS 4–15) cells, suggesting that these apoptotic resistant cells should be more sensitive to a cell death stimulus (Fig. 6A). However, our data suggest that the apoptotic resistance does not appear to be associated with an increase in anti-apoptotic or a decrease in pro-apoptotic protein expression that we have analyzed in our experiments.
FIGURE 6.
Analysis of the apoptotic pathway in S49 (Neo) and S49 (OS 4–15) cells. A, examination of the expression level various pro- and anti-apoptotic proteins in S49 (Neo) and S49 (OS 4–15) cells showed no significant change, with the exception of Bax that was increased in the apoptotic resistant S49 (OS 4–15) cells. B, examination of the cytosolic fraction of S49 (Neo) and S49 (OS 4–15) cells shows the occurrence of cytochrome c in both the S49 (Neo) and S49 (OS 4–15) samples after osmotic stress. Data represent the mean (± S.E.) of 3 to 4 independent experiments. *, p < 0.05; **, p < 0.01 versus control.
Additionally, the lack of caspase activity in S49 (OS 4–15) cells under multiple intrinsic apoptotic stimuli lead us to examine if cytochrome c was released from the mitochondria during the intrinsic cell death process. When S49 (Neo) and S49 (OS 4–15) cells were treated with media containing either 250 or 500 mm mannitol for 4 h, and then divided into a cytosolic and mitochondrial fractions, cytochrome c release occurred in both cells (Fig. 6B). These data indicate that the resistance of the S49 (OS 4–15) cells likely lies downstream of the mitochondria, and further suggest that the release of cytochrome c is not sufficient to induce apoptosis in these osmotically resistant cells.
Analysis of Signaling Modules in Osmotic Sensitive and Osmotic Resistant Cells
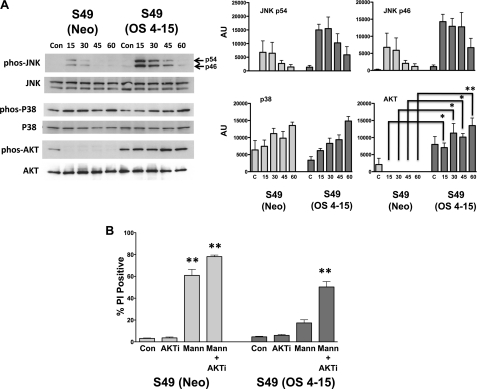
Because the S49 (OS 4–15) cells were resistant to multiple intrinsic apoptotic stimuli, including osmotic stress (19, 20) we sought to determine if these cells still mounted a response to a hypertonic stress. Stress-activated protein kinase (SAPK) pathways can be activated by a variety of environmental agents including osmotic pressure. In general, p38 MAPK and JNK are thought to be pro-apoptotic, while ERK 1/2 and the cell survival-promoting protein kinase B (AKT) are thought to be anti-apoptotic. Therefore, we examined the osmotic sensitive and osmotic resistant cells for changes in these signaling proteins in the presence of osmotic stress. Fig. 7A shows no significant difference in the activation or phosphorylation of p38 between the S49 (Neo) and S49 (OS 4–15) cells upon osmotic stress when compared with their time-matched controls. A general increase in JNK phosphorylation was observed in the S49 (OS 4–15) cells compared with the S49 (Neo) cells following hypertonic stress, however this difference was not significant when compared with the time-matched controls. Additionally, we also observed a small increase in the phosphorylation of ERK upon osmotic stress between the two cells, however similar to the JNK phosphorylation, no significant difference was observed (supplemental Fig. S2). Interestingly, phospho-AKT is observed in both the parent and osmotic resistant cells, however hyperosmotic stress resulted in the constitutive activation of AKT in the S49 (OS 4–15) cells, whereas this activity was rapidly diminished in the S49 (Neo) cells (Fig. 7A). To understand the basis for this sustained phosphorylation of AKT in the S49 (OS 4–15) cells, we examined the activity of up stream kinases PDK1 and mTOR, known to phosphorylate AKT. A significant increase in phosphorylated PDK1 in the S49 (OS 4–15) cells was observed early upon hyperosmotic stress, while a significant increase in phosphorylated mTOR occurred at later times (supplemental Fig. S3). These data suggest that both kinases may play a role in the sustained increased phosphorylation of AKT. Interestingly, inhibition of AKT resulted in the sensitization of the S49 (OS 4–15)-resistant cells to undergo apoptosis in response to osmotic stress (Fig. 7B). Thus the S49 (OS 4–15) cells still respond to osmotic stress, but in a manner distinct from the parental osmotic-sensitive cells.
FIGURE 7.
Analysis of apoptotic signal modules in the S49 (Neo) and S49 (OS 4–15) cells shows a sustained increase in AKT activation. A, changes in various stress-activated protein kinase pathways along with in the AKT pathway were examined after an acute exposure to 250 mm mannitol. No significant difference was observed between the S49 (Neo) and S49 (OS 4–15) cells for either JNK or p38 activation. A sustained increase in AKT activation was observed in the S49 (OS 4–15) cells that were absent in the parental cells. B, inhibition of AKT (AKTi; 5 μm) resulted in the re-sensitization of S49 (OS 4–15) cells to apoptosis upon 250 mm mannitol exposure after 6 h. Data represent the mean (± S.E.) of at least three independent experiments. *, p < 0.01; **, p < 0.001 versus time matched control.
S49 (OS 4–15) Cells Have Developed an Inherent RVI
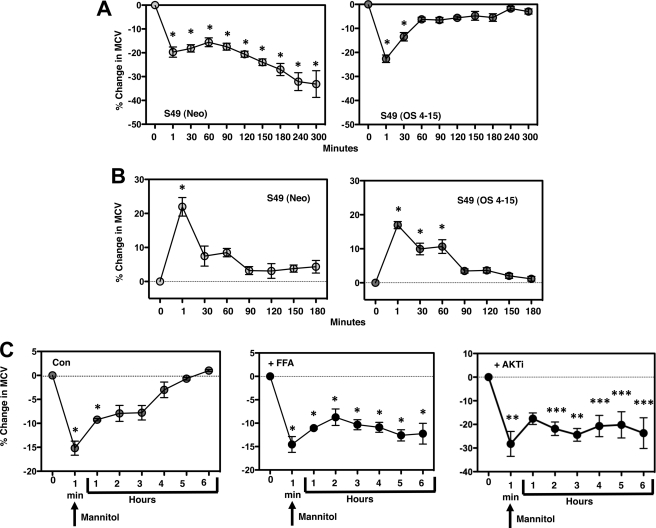
To understand the mechanism of apoptotic resistance in S49 (OS 4–15) cells, specifically in regards to the activation of the apoptotic machinery, we examined their ability to compensate for the change in cell volume during apoptosis. We have shown that maintaining a normal intracellular ionic composition prevents caspase activation and apoptotic nuclease activity (7, 8). S49 (Neo) cells do not respond with an RVI upon hyperosmotic exposure (Fig. 8A). Interestingly, when S49 (OS 4–15) cells were examined under hyperosmotic stress, these cells elicited a robust RVI response (Fig. 8A). While the S49 (OS 4–15) cells have gained an inherent RVI response, these cells showed a similar response in their ability to regulate their volume upon hypoosmotic stress when compared with the S49 (Neo) cells (Fig. 8B), suggesting that this osmotic response remained intact in the S49 (OS 4–15) cell.
FIGURE 8.
S49 (OS 4–15) cells gained a robust RVI response, sensitive to inhibition with flufenamic acid. A, S49 (OS 4–15) cells treated with 250 mOsm mannitol showed a robust inherent RVI compared with the S49 (Neo) cells. B, in contrast, no change in the ability of S49 (OS 4–15) cells was observed in regards to their inherent RVD response upon hypoosmotic treatment. C, RVI response in S49 (OS 4–15) cells was inhibited using FFA (200 μm), a known inhibitor of hypertonic-induced cation channels, or the AKT inhibitor (AKTi; 5 μm). Data represent the mean (± S.E.) of 3 to 4 independent experiments. *, p < 0.001; **, p < 0.01; ***, p < 0.05 versus control.
Inhibition of RVI Re-sensitizes Osmotically Resistant Cells to Apoptosis
Several ionic transport mechanisms including the Na+/H+ exchanger, the Na+/K+/2Cl− cotransporter, and hypertonicity-induced cation channels (HICC) have been implicated in the regulation of cell volume in response to a hyperosmotic condition in a cell type-specific manner (13, 17, 18, 21–23). Interestingly, the addition of flufenamic acid (FFA), a known inhibitor of HICCs (24), resulted in the inhibition of the RVI response upon acute exposure to hyperosmotic stress (Fig. 8C), suggesting non-selective cation channels may play a role in cell volume recovery of the S49 (OS 4–15) cells after cell shrinkage. Establishing that inhibition of AKT in conjunction with hyperosmotic stress sensitized the osmotic-resistant cells to undergo apoptosis (Fig. 7B), we were interested in determining if this inhibition affected the ability of the S49 (OS 4–15) cells to elicit an RVI response. Inhibition of AKT activity prevented the S49 (OS 4–15) cells to respond with an RVI upon hyperosmotic stress, similar to our observation with FFA (Fig. 8C). Because AKT activity was rapidly decreased in the S49 (Neo) cells upon osmotic stress, and a sustained level of phospho-AKT was observed in the osmotic resistant cells (Fig. 7A), we examined if FFA turned off active AKT in the osmotic resistant cells. FFA had no effect on eliminating the phospho-AKT either the presence or absence of osmotic stress (supplemental Fig. S4). Thus the ability of FFA to prevent RVI in the presence of phospho-AKT suggests that AKT is upstream of RVI.
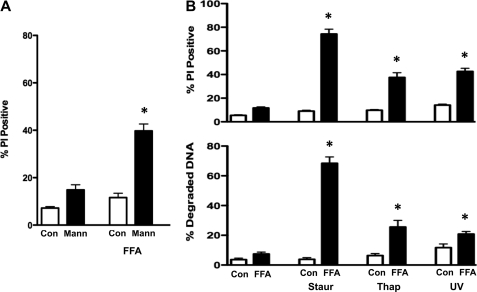
Based on these findings, we wished to determine if the newly acquired RVI had an anti-apoptotic role in the S49 (OS 4–15) cells. Specifically, we examined if inhibition of RVI in S49 (OS 4–15) cells upon FFA treatment would sensitize these cells to undergo apoptosis. In the presence of osmotic stress, S49 (OS 4–15) cells did not undergo cell death (Fig. 9A). However, the addition of FFA in combination with hyperosmotic stress resulted in an increase in the percent of cells that loss viability (Fig. 9A), suggesting the inhibition of the inherent RVI response in osmotic resistant S49 (OS 4–15) cells sensitizes them to die. To examine the specificity FFA has on this sensitization, we also analyzed several amiloride compounds such as 5-(N-methyl-N-isobutyl)-amiloride (MIA) and 5-(N-ethyl-N-isopropyl)-amiloride (EIPA) known to inhibit the Na+/H+ exchanger, along with other non-steroidal anti-inflammatory drugs related to FFA such as mefenamic acid and sodium salicylate. None of these drugs sensitized S49 (OS 4–15) cells to undergo cell death (supplemental Fig. S5). Additionally, we examined the ability of the Na+/H+ exchanger inhibitors to prevent the RVI in S49 (OS 4–15) cells. Neither MIA nor EIPA blocked the RVI response in the S49 (OS 4–15) cells (supplemental Fig. S5), suggesting a specific role of hypertonicity-induced cation channels in the RVI process in these osmotic resistant cells. Subsequently, we examined the ability of FFA to sensitized S49 (OS 4–15) cells to other apoptotic stimuli. As shown in Fig. 9B, FFA also sensitized S49 (OS 4–15) cells to die with agents such as staurosporine, thapsigargin, and UV, suggesting that the gain of an RVI response in the osmotic resistant cells results in an inhibition of intrinsic-induced apoptosis.
FIGURE 9.
Flufenamic acid sensitizes S49 (OS 4–15) cells to intrinsically induced apoptosis. A, S49 (OS 4–15) cells were treated with 250 mOsm mannitol for 6 h in the presence and absence of 200 μm FFA and examined for the loss of membrane integrity. The addition FFA to inhibit the RVI response sensitized S49 (OS 4–15) cells to undergo cell death. B, S49 (OS 4–15) cells were treated with 0.5 μm staurosporine, 10 μm thapsigargin, or 75 mJ/cm2 UV for 10 h in the presence and absence of 220 μm FFA and examined for the loss of membrane integrity (top) and degraded DNA (bottom) using flow cytometry. Again, the presence of FFA sensitized the S49 (OS 4–15) cells to undergo apoptosis. Data represent the mean (± S.E.) of three independent experiments. *, p < 0.001 versus control.
DISCUSSION
Our study shows that osmotic stress in lymphoid cells can activate the apoptotic program in a caspase-dependent manner resulting in a very rapid and synchronous cell death response. Taking advantage of the fact that these lymphoid cells do not have an RVI, we generated a novel cell line of osmotic resistant cells that show resistance to a variety of intrinsic apoptotic stimuli. This resistance to cell death is not reflective of changes in pro- or anti-apoptotic proteins or the inability to release cytochrome c from the mitochondria. Interestingly, these cells remain sensitive to apoptosis induced via the extrinsic or death receptor pathway, suggesting that the overall apoptotic machinery is not compromised, including the ionic changes that occur during the apoptotic volume decrease. A unique feature of the S49 (OS 4–15) cells is a newly gained ability to compensate for a loss of cell volume through the activation of an RVI response, a regulatory mechanism absent in parent S49 (Neo) cells. Elimination of this compensatory RVI mechanism results in a re-sensitization of these cells to intrinsically induced apoptosis. These data suggest that the ability of cells to compensate for a change in cell volume can afford protection from apoptosis depending on the signal used to activate the cell death program.
A widespread belief is that all cells have the ability to undergo cell death through an internally encoded suicide process. Therefore, apoptosis must remain dormant to avoid inappropriate activation of the cell death program. The ability of cells to evade apoptosis and grow exponentially is thought to be a driving force for the progression of cancer, and overcoming this apoptotic resistance has been a focus for countless therapeutics. Cells have developed a variety of mechanisms to repress inadvertent apoptosis including the expression of inhibitors of apoptosis proteins (IAPs), specific caspase inhibitors such as FLIP, CrmA, and p35, and various anti-apoptotic Bcl-2 proteins (25). However, an overall inhibition of the apoptotic program does not appear to have been generated in the S49 (OS 4–15) cells as shown by our analysis of the expression level of various pro- and anti-apoptotic proteins where no significant difference between wild type and osmotic-resistant cells was observed, and the ability of extrinsic stimuli to induce apoptosis.
Lymphoid cells when placed in a hyperosmotic environment shrink and fail to regain their original volume (3, 17, 18), however in cells that have an inherent volume regulatory response, this mechanism must be either inhibited or overridden for the cells to die (3). The sustained state of cell volume loss that occurs simultaneously in lymphoid cells synchronizes the activation of the cell death process. The synchrony and speed of apoptosis allowed us to develop a unique model system to understand the relationship between compensatory volume regulatory mechanisms and apoptotic signaling as it relates to AVD. In our current study, we exposed lymphoid cells to multiple rounds of hyperosmotic stress followed by the recovery of viable cells in normal media that lead to a distinct cell line with the inherent ability to volume regulate upon acute exposure to hyperosmotic stress.
Our characterization of the newly generated S49 (OS 4–15) cells suggests that these cells should in fact be more sensitive to apoptotic stimuli resulting from increased expression of the pro-apoptotic Bax and the release of cytochrome c from the mitochondria. However as shown in Fig. 5, these cells are resistant to a variety of intrinsic apoptotic stimuli. Thus the repression of the apoptotic machinery likely occurs at a point downstream of these typical cell death events. Based on our results, we postulate that the ability to repress unwanted cell death relies on the cells ability to regulate and maintain a constant, or normal cell volume. A universal characteristic of apoptosis is the loss of cell volume, shown to occur through the loss of intracellular ions, specifically potassium, sodium, and chloride during the cell death process (5, 16). This loss of intracellular ions in turn permits the activation of apoptotic machinery (7–10). Therefore, our findings indicate cell shrinkage or AVD during apoptosis is not a passive event as is normally presumed, but rather plays an active role in the life and death decisions of a cell, and our data suggest that the ability to compensate for an early ion flux can protect cells from apoptosis.
We show that the addition of flufenamic acid, a known inhibitor of osmotic HICC activation (24), prevents the newly gained RVI response in S49 (OS 4–15) cells and sensitizes these cells to undergo apoptosis. The ionic changes that occur during RVI are consistent with the activation of a non-selective cation channel. Because these channels do not discriminate between various cations, a resulting increase in intracellular Na+ is achieved in the cell due to the overall negative plasma membrane potential. Furthermore, inhibition of the sustained activation of AKT, known to be anti-apoptotic in many cell types (26–28), also resulted in cell death. In a study by Subramanyam et al. (28), hyperosmotic stress was found to induce phosphorylation of AKT and was essential for RVI in HeLa cells. Our current study supports and extends this conclusion by showing that in S49 (OS 4–15 cells) inhibition of AKT resulted in the inactivation of the RVI response. Interestingly, hyperosmotic stress did not result in the induction of phospho-AKT in the S49 (Neo) cells that are extremely sensitive to undergo apoptosis. The inability of flufenamic acid to directly inactivate AKT suggests multiple pathways are active and play a role in regulating the RVI response to osmotic stress.
Collectively, our results support the conclusion that apoptotic resistance is linked to the compensatory volume regulatory mechanism, and is differently regulated given the specific apoptotic pathway that is induced. This acquired compensatory mechanism observed in the osmotic resistant cells likely impedes the characteristic ion flux required not only for AVD, but also for caspase activation and apoptotic nuclease activity. Maintenance of a homeostatic ionic balance is an energy demanding process, requiring high levels of ATP, however this expense is essential for a cell to maintain viability. The idea of compensatory ionic mechanisms to protect cells from changes in cell volume, whether induced via an anisotonic environment, or the activation of apoptosis, can be viewed as an anti-apoptotic mechanism and suggests a discrete functional role of RVI and AVD during the signaling of cell death. Thus maintaining a normal ionic balance through the activation of compensatory volume regulatory mechanisms may be considered a first line of defense in combating a cell death signal.
Supplementary Material
This research was supported by the Intramural Research Program of the National Institutes of Health, NIEHS.

This article contains supplemental Figs. S1–S5.
- AVD
- apoptotic volume decrease
- RVI
- regulatory volume increase
- MCV
- mean cell volume
- PI
- propidium iodide
- HICC
- hypertonicity-induced cation channel
- EV
- electronic volume
- FFA
- flufenamic acid.
REFERENCES
- 1. Kerr J. F., Wyllie A. H., Currie A. R. (1972) Apoptosis: a basic biological phenomenon with wide-ranging implications in tissue kinetics. Br. J. Cancer 26, 239–257 [DOI] [PMC free article] [PubMed] [Google Scholar]
- 2. Maeno E., Ishizaki Y., Kanaseki T., Hazama A., Okada Y. (2000) Normotonic cell shrinkage because of disordered volume regulation is an early prerequisite to apoptosis. Proc. Natl. Acad. Sci. U.S.A. 97, 9487–9492 [DOI] [PMC free article] [PubMed] [Google Scholar]
- 3. Bortner C. D., Cidlowski J. A. (1996) Absence of volume regulatory mechanisms contributes to the rapid activation of apoptosis in thymocytes. Am. J. Physiol. 271, C950–C961 [DOI] [PubMed] [Google Scholar]
- 4. Shimizu T., Maeno E., Okada Y. (2007) Prerequisite role of persistent cell shrinkage in apoptosis of human epithelial cells. Acta Physiologica Sinica 59, 512–516 [PubMed] [Google Scholar]
- 5. Bortner C. D., Cidlowski J. A. (2007) Cell shrinkage and monovalent cation fluxes: role in apoptosis. Arch. Biochem. Biophys. 462, 176–188 [DOI] [PMC free article] [PubMed] [Google Scholar]
- 6. Ernest N. J., Habela C. W., Sontheimer H. (2008) Cytoplasmic condensation is both necessary and sufficient to induce apoptotic cell death. J. Cell Sci. 121, 290–297 [DOI] [PMC free article] [PubMed] [Google Scholar]
- 7. Bortner C. D., Hughes F. M., Jr., Cidlowski J. A. (1997) A primary role for K+ and Na+ efflux in the activation of apoptosis. J. Biol. Chem. 272, 32436–32442 [DOI] [PubMed] [Google Scholar]
- 8. Hughes F. M., Jr., Bortner C. D., Purdy G. D., Cidlowski J. A. (1997) Intracellular K+ suppresses the activation of apoptosis in lymphocytes. J. Biol. Chem. 272, 30567–30576 [DOI] [PubMed] [Google Scholar]
- 9. Thompson G. J., Langlais C., Cain K., Conley E. C., Cohen G. M. (2001) Elevated extracellular [K+] inhibits death-receptor- and chemical-mediated apoptosis prior to caspase activation and cytochrome c release. Biochem. J. 357, 137–145 [DOI] [PMC free article] [PubMed] [Google Scholar]
- 10. Cain K., Langlais C., Sun X. M., Brown D. G., Cohen G. M. (2001) Physiological concentrations of K+ inhibit cytochrome c-dependent formation of the apoptosome. J. Biol. Chem. 276, 41985–41990 [DOI] [PubMed] [Google Scholar]
- 11. Hersey P., Zhang X. D. (2003) Overcoming resistance of cancer cells to apoptosis. J. Cell. Physiol. 196, 9–18 [DOI] [PubMed] [Google Scholar]
- 12. Fulda S. (2009) Tumor resistance to apoptosis. Int. J. Cancer 124, 511–515 [DOI] [PubMed] [Google Scholar]
- 13. Hoffmann E. K., Lambert I. H., Pedersen S. F. (2009) Physiology of cell volume regulation in vertebrates. Physiol. Rev. 89, 193–277 [DOI] [PubMed] [Google Scholar]
- 14. Roti Roti L. W., Rothstein A. (1973) Adaptation of mouse leukemic cells (L5178Y) to anisotonic media. I. Cell volume regulation. Exp. Cell Res. 79, 295–310 [DOI] [PubMed] [Google Scholar]
- 15. Hempling H. G., Thompson S., Dupre A. (1977) Osmotic properties of human lymphocyte. J. Cell. Physiol. 93, 293–302 [DOI] [PubMed] [Google Scholar]
- 16. Bortner C. D., Sifre M. I., Cidlowski J. A. (2008) Cationic gradient reversal and cytoskeleton-independent volume regulatory pathways define an early stage of apoptosis. J. Biol. Chem. 283, 7219–7229 [DOI] [PMC free article] [PubMed] [Google Scholar]
- 17. Grinstein S., Clarke C. A., Rothstein A. (1983) Activation of Na+/H+ exchange in lymphocytes by osmotically induced volume changes and by cytoplasmic acidification. J. Gen. Physiol. 82, 619–638 [DOI] [PMC free article] [PubMed] [Google Scholar]
- 18. Grinstein S., Rothstein A., Sarkadi B., Gelfand E. W. (1984) Responses of lymphocytes to anisotonic media: volume-regulating behavior. Am. J. Physiol. 246, C204–C215 [DOI] [PubMed] [Google Scholar]
- 19. Brady S. C., Allan L. A., Clarke P. R. (2005) Regulation of caspase 9 through phosphorylation by protein kinase Cζ in response to hyperosmotic stress. Mol. Cell. Biol. 25, 10543–10555 [DOI] [PMC free article] [PubMed] [Google Scholar]
- 20. Burg M. B., Ferraris J. D., Dmitrieva N. I. (2007) Cellular response to hyperosmotic stresses. Physiol. Rev. 87, 1441–1474 [DOI] [PubMed] [Google Scholar]
- 21. Shimizu T., Wehner F., Okada Y. (2006) Inhibition of hypertonicity-induced cation channels sensitizes HeLa cells to shrinkage-induced apoptosis. Cell. Physiol. Biochem. 18, 295–302 [DOI] [PubMed] [Google Scholar]
- 22. Wehner F., Bondarava M., ter Veld F., Endl E., Nurnberger H. R., Li T. (2006) Hypertonicity-induced cation channels. Acta Physiol. 187, 21–25 [DOI] [PubMed] [Google Scholar]
- 23. Numata T., Sato K., Okada Y., Wehner F. (2008) Hypertonicity-induced cation channels rescue cells from staurosporine-elicited apoptosis. Apoptosis 13, 895–903 [DOI] [PMC free article] [PubMed] [Google Scholar]
- 24. Wehner F., Shimizu T., Sabirov R., Okada Y. (2003) Hypertonic activation of a non-selective cation conductance in HeLa cells and its contribution to cell volume regulation. FEBS Lett. 551, 20–24 [DOI] [PubMed] [Google Scholar]
- 25. Bortner C. D., Cidlowski J. A. (2002) Cellular mechanisms for the repression of apoptosis. Annu. Rev. Pharmacol. Toxicol. 42, 259–281 [DOI] [PubMed] [Google Scholar]
- 26. Franke T. F., Hornik C. P., Segev L., Shostak G. A., Sugimoto C. (2003) PI3K/Akt and apoptosis: size matters. Oncogene 22, 8983–8998 [DOI] [PubMed] [Google Scholar]
- 27. Sugden P. H., Clerk A. (2001) Akt like a woman: gender differences in susceptibility to cardiovascular disease. Circ. Res. 88, 975–977 [DOI] [PubMed] [Google Scholar]
- 28. Subramanyam M., Takahashi N., Hasegawa Y., Mohri T., Okada Y. (2010) Inhibition of protein kinase Akt1 by apoptosis signal-regulating kinase-1 (ASK1) is involved in apoptotic inhibition of regulatory volume increase. J. Biol. Chem. 285, 6109–6117 [DOI] [PMC free article] [PubMed] [Google Scholar]
Associated Data
This section collects any data citations, data availability statements, or supplementary materials included in this article.


