

Abstract
Objective
To gain insights into individual variations in acute inflammation and physiology.
Design
Large-animal study combined with mathematical modeling.
Setting
Academic large-animal and computational laboratories.
Subjects
Outbred juvenile swine.
Interventions
Four swine were instrumented and subjected to endotoxemia (100 μg/kg), followed by serial plasma sampling.
Measurements and Main Results
Swine exhibited various degrees of inflammation and acute lung injury (ALI), including one death with severe ALI (P/F ratio <200 and static compliance <10 L/cmH2O). Plasma interleukin (IL)-1β, IL-4, IL-6, IL-8, IL-10, tumor necrosis factor (TNF)-α, high mobility group box-1 (HMGB1), and NO2−/NO3−,, were significantly (p <0.05) elevated over the course of the experiment. Principal Component Analysis (PCA) was used to suggest principal drivers of inflammation. Based in part on PCA, an Ordinary Differential Equation (ODE) model was constructed, consisting of the lung and the blood (as a surrogate for the rest of the body), in which endotoxin induces TNF-αin monocytes in the blood, followed by the trafficking of these cells into the lung leading to the release of HMGB1, which in turn stimulates the release of IL-1βfrom resident macrophages. The ODE model also included blood pressure, PaO2, and FiO2, and a damage variable that summarizes the health of the animal. This ODE model could be fit to both inflammatory and physiologic data in the individual swine. The predicted time course of damage could be matched to the Oxygen Index in 3 of the 4 swine.
Conclusions
The approach described herein may aid in predicting inflammation and physiological dysfunction in small cohorts of subjects with diverse phenotypes and outcomes.
Keywords: Endotoxemia, Sepsis, Swine, Inflammation, Models, Theoretical, Systems Biology
INTRODUCTION
Sepsis can result in excessive and maladaptive inflammation that is responsible for more than 215,000 deaths in the United States per year, with an annual healthcare cost of over $16 billion (1, 2). Treatment of sepsis currently relies on anti-microbial agents and management of symptoms. In order to develop effective treatment strategies, we must first understand sepsis-induced Multiple Organ Dysfunction Syndrome (MODS) (3–5), thought to be due, in part, to excessive or maladaptive activation of inflammatory pathways (6) that are also necessary for the removal or reduction of challenges to the organism and subsequent restoration of homeostasis (2).
Sepsis-induced acute inflammation manifests with high variability among critically ill patients and the complex, compartmentalized interplay of inflammatory mediators and physiological functions. The large variability in the levels of mediators or in measurable physiological variables often confounds standard data-driven analyses except in relatively large cohorts (7, 8) and these methods are generally not applicable to the prediction of individual outcomes (9–11). Systems biology approaches (12) may offer a solution for addressing complex biological processes such as the acute inflammatory response in sepsis and trauma (4, 5, 10, 11, 13–16, 16–18).
The present study was focused on a large-animal experimental preparation (porcine endotoxemia), and its goal was to test the hypothesis that a single, compartmentalized mathematical model could explain not only key interactions among inflammatory mediators and physiological function/dysfunction, but could also explain the causes of subject-to-subject variability as a function of differing initial conditions or relative strengths of certain interactions. A second hypothesis that was tested in the present study was that insights into key interactions could be gleaned from data-driven methods such as Principal Component Analysis (PCA), serving as an objective means for inclusion of defined interactions/modules into mechanistic mathematical models.
MATERIALS AND METHODS
Experimental Endotoxemia in Swine
IACUC
The studies described were conducted in adherence with the National Institute of Health guidelines on the use of experimental animals. The Committee for the Humane Use of Animals at SUNY Upstate Medical University, Syracuse, NY, approved the protocol.
Anesthesia
Healthy female Yorkshire pigs (21–38 kg) were pretreated with glycopyrrolate (10 μg/kg, intramuscular), Telazol (tiletamine hydrochloride and zolazepam hydrochloride, 5 mg/kg, intramuscular), and xylazine (2 mg/kg, intramuscular). A ketamine (3 mg/ml) plus xylazine (0.3 mg/ml) continuous infusion using an infusion pump (3M model 3000) was used to maintain anesthesia throughout the experiment. Ketamine and xylazine were injected into a 1-L bag of Ringers Lactate and infused at a rate of 100 ml/h for the duration of the experiment. This rate was lowered or raised to maintain adequate anesthesia.
Tracheostomy and Mechanical Ventilation
An open tracheostomy was performed and the animal connected to a mechanical ventilator (Hamilton G5, Hamilton Medical, Reno, NV) with initial settings during the surgical preparation as follows: tidal volume (Vt) of 12 cc/kg, respiratory rate (RR, breaths/minute) of 15, titrated to maintain arterial CO2 (PaCO2, mmHg) within the normal range (35–45 mmHg), fraction of inspired O2 (FiO2, %) of 21% and positive end-expiratory pressure (PEEP, cmH2O) of 3 cmH2O. Low tidal volume protective mechanical ventilation was not utilized since we did not wish to ‘protect’ the lung with the ventilator, but rather to measure the development of lung injury if it occurred.
Surgical Preparation
A left carotid artery catheter was placed for blood chemistry and gas content measurements (Cobas b211; Roche, Inc.), and systemic arterial pressure monitoring. A venotomy was performed on the right internal jugular vein for placement of a triple lumen catheter, allowing anesthesia, fluid, and antibiotic administration, as well as blood sampling. A right internal jugular Swan-Ganz catheter (7 French) was placed for measurement of pulmonary artery (PAP, mmHg) and wedge pressures (PAW, mmHg), sampling of mixed venous blood gases, and cardiac output (CO, L/min; Agilent, CMS-2001). A Foley catheter was inserted into the bladder for measurement of urine output (UOP, ml/min), collection of urine samples, and was connected to a pressure transducer leveled at midline to measure bladder pressure. All animals received a regimen of intravenous fluids as described below. During the surgical procedure, pigs received a fluid bolus of Lactated Ringers (1 liter IV) over 30 min.
All administered fluids were warmed to 36oC in a water bath (Precision 280 Series, Thermo Electronic Corp). Ketamine + Xylazine anesthesia mixed in Ringers Lactate (see Anesthesia for details) was infused at a rate of 100 ml/h. Hydration was deemed inadequate if UOP decreased to less than 0.5 cc/kg/h or if MAP decreased to less than 60 mmHg. If either of these effects occurred, pigs received an additional fluid bolus of Lactated Ringers (500 cc IV).
Hemodynamic measurements
ECG monitoring, pulse oximetry, MAP, central venous pressure (CVP, mmHg), PAP, and PAW were measured (Agilent, CMS-2001, System M1176A, with Monitor M1094B, Böblingen, Germany) using Edwards transducers (Pressure Monitoring Kit [PXMK1183], Edwards Lifesciences). CO was measured by thermodilution (Agilent, CMS-2001, System M1176A, with Monitor M1094B, Böblingen, Germany). Three separate boluses of cold solution (Dextrose 5% and Sodium Chloride 0.45%) were injected at end-expiration and the average of the three measurements recorded. Physiologic measurements were made every 30 min.
Ventilator Adjustments
If arterial oxygenation saturation (SaO2, %) fell below 92%, the FiO2 was increased to maintain adequate oxygenation in increments of 21, 40, to 60%). If 100% FiO2 did not maintain adequate oxygenation, the PEEP was increased in 2-cmH2O increments (maximum PEEP allowed was 15 cmH2O) until adequate oxygenation was obtained or hemodynamics were comprised (i.e. a significant fall in MAP occurred). If the animal was triggering breaths during the surgical procedure while fully anesthetized, Pancuronium (0.1 mg/kg IV) was given to prevent spontaneous breathing. No additional pancuronium was given following the surgery.
Pulmonary Function Measurements
Pulmonary parameters (RR, peak airway pressure [Pip, cmH2O], mean airway pressure (Pm, cmH2O), plateau pressure [Pplat, cmH2O], Vt, PEEP, auto PEEP, expiratory minute volume [EMV, L/min], and static compliance [Cstat,L/cmH2O]) were measured or calculated by the Hamilton G5 ventilator (Hamilton Medical, Reno, NV) at baseline and every 30 min for 6 h or until death. Lung function was also assessed via arterial blood gases (partial arterial O2 pressure [PaO2, mmHg] and partial arterial CO2 pressure [PaCO2, mmHg]) and oxygenation expressed as a P/F ratio (PaO2/FiO2) every 30 min.
Endotoxin Infusion
Immediately following baseline measurements, 100 μg/kg of endotoxin (E. coli 111:B4, Sigma Chemical Co., St Louis, MO) was mixed in a 1-L bag of Ringers Lactate and infused intravenously over a 1-h period.
Blood Chemistry
Measurement of blood gases and chemistries were made with a Roche Blood gas analyzer (Cobras b221). Both arterial and mixed venous samples were measured at baseline and every 30min for pH, pCO2, pO2, oxygen saturation (SO2%), hematocrit, hemoglobin, sodium, potassium, chloride, ionized calcium, glucose, BUN, and lactate.
Biofluid sampling
In order to prepare plasma for subsequent analyses, blood was drawn and put into blue-topped (sodium citrate) tubes at Baseline and every 30 min for the first 3 h and every hour from 3 – 6 h. The samples were spun at 3000 rpm (1734×g) at 15oC for 10 min. Plasma was separated and snap-frozen in liquid nitrogen for mediator analysis. Bronchoalveolar lavage fluid (BALF) was obtained at necropsy. The right middle lobe was lavaged with 60 ml of normal saline (3 injections of 20 ml flushed into the right middle lobe bronchus and aspirated out) and the volume collected was recorded. The BALF was centrifuged for 10 min at 2360×g at15°C.
Necropsy
The bronchus to the right middle lobe was exposed and cannulated with a small endotracheal tube. The lobe was lavaged with 60 ml normal saline (three 20-ml injections) and collected. The BALF was centrifuged and frozen for measurement of inflammatory mediators as described below. The right mainstem bronchus was clamped and the left lung was filled with 10% neutral buffered formalin for 24 h, at which time tissue blocks were harvested for standard hematoxylin & eosin staining. Histological analyses from both dependent and non-dependent lung areas were made. The histologist was blinded to outcome during morphometric measurements.
Tissue Edema
Organ edema was measured using the W/D ratio described in detail previously (19).
Assays of Inflammatory Mediators
The following cytokines were assayed in both plasma and BALF using a Luminex™ 100 IS System (Luminex, Austin, TX) and commercially available, pig-specific beadsets (Panomics): IL-1β, IL-4, IL-6, IL-8, IL-10, and TNF-α). HMGB1 was assayed using a commercially available ELISA (Shino Test, Kanagawa, Japan). Nitric oxide reaction products (NO2−/NO3−) were assayed using the nitrate reductase method (Cayman, Ann Arbor, MI).
Data-Driven and Mathematical Analyses
Statistical Analysis
All values are presented as mean ± SEM. Determination of statistically significant differences were made using one-way ANOVA on ranks, with P < 0.05 considered significant.
Principal Component Analysis (PCA)
The goal of this analysis was to identify the subsets of mediators (in the form of orthogonal normalized linear combinations of the original mediator variables, called principal components) that are most strongly correlated with the response to endotoxin in swine, and that thereby might be considered principal drivers of the inflammatory response in this setting. We have recently demonstrated the utility of PCA based on the levels of circulating mediators for suggesting key inflammatory influences in a mouse model of trauma/hemorrhagic shock (20). To perform this analysis, the cytokine and NO2−/NO3− data were first normalized for each inflammatory mediator (i.e. a given value divided by the maximum value for a given inflammatory mediator), so that all inflammatory mediator levels were converted into the same scale (from 0 to 1). In this way, any artifactual effects on variance due to the different ranges of concentration observed for different cytokines were eliminated. Only sufficient components to capture at least either 70% or 95% of the variance in the data were considered. From these leading principal components, the coefficient (weight) associated with each cytokine was multiplied by the eigenvalue associated with that principal component. This product represented the contribution of a given cytokine to the variance accounted for in that principal component. The overall score given to each cytokine is the sum of its scores in each component. This gives a measure of a cytokine’s contribution to the overall variance of the system. The cytokines with the largest scores are the ones who contributed most to the variance of the process being studied. More specifically, the overall PCA score was calculated in the following way: , where i is the index of component and j is the index of cytokine. Wi,j is the amount that jth cytokine contributes to the ith component. ei is the percentage of total variance accounted by ith component. For the complete Matlab® code for carrying out the PCA as described above, please see Supplementary Materials in reference (20).
Mathematical Model of Porcine Endotoxemia
In order to create a mathematical model of porcine endotoxemia, we augmented an existing mathematical model of mouse endotoxemia (21–24). Our previous single-compartment mathematical model of inflammation was capable of making qualitative and quantitative predictions with regard to endotoxin-induced inflammation and a single measure of physiology (mean arterial pressure) in genetically identical mice (21–24). Our goal in the present study was to examine both inflammation and physiology in greater detail, including additional inflammatory cytokines as well as lung pathophysiology, in genetically diverse swine. The model was also extended to support clinical interventions administered such as a fluid resuscitation and mechanical ventilation. The mathematical modeling involved six main tasks:
Extension of the mouse inflammation model to reproduce additional analytes
Use of Principal Component Analysis to help define main interactions and inflammatory drivers
Re-tuning model parameters to porcine endotoxemia data
Identifying a small subset of parameters to vary to produce variability between swine
Varying the subset to reproduce the experimentally measured data of each swine
Clustering solutions to determine ensembles of model solutions
Extension of a mouse model of acute inflammation
A previously published mouse model (21) provided the framework for cell-cell signaling through cytokines, the production of NO and its effect on blood pressure, and a general damage term to quantify adverse effects of inflammation. Alterations were necessary to adapt the mouse model to porcine inflammation time course behavior. Furthermore, the model was extended to include an additional lung compartment, allowing the model to reproduce changes in gas exchange dynamics. Gas exchange dynamics gave the ability to predict hypoperfusion, which contributes to the overall damage function. The model was also extended to support clinical interventions administered such as a fluid resuscitation and mechanical ventilation. The model is detailed in Appendix I (Supplementary Materials).
Parameter estimation to a generic porcine endotoxemia model
Since the base mathematical model was trained to mouse data, it was expected that further parameter optimization would be necessary to reproduce porcine endotoxemia data. Therefore, all parameters were re-estimated using a genetic algorithm, such that the model output resembled the time course of porcine endotoxemia data for the healthiest swine following administration of endotoxin. All generic parameters in the mathematical model are detailed in Appendix II (Supplementary Materials).
Selection of parameter subset estimated to produce individual swine outcomes
Using the model obtained from the large fit in the previous step, a small set of parameters (~20 out of 200 parameters) were varied in the next phase to make the model fit the observed time course data of each individual swine. The subset of parameters chosen to be varied per swine was selected on the basis of expected maximum inter-swine variability and maximum parameter sensitivity in the model. Mathematical analysis of model sensitivity was completed using Immunetrics Inc. proprietary software that executes an algorithm similar to PCA. The parameters chosen were mostly related to cytokine production (e.g. rate of production of TNF by macrophages) and the effect of inflammation on oxygen transport etc. The use of a small number of parameters (~ 10%) demonstrates the robustness of the model to reproduce large surface of response as observed. All parameter values in individual swine are detailed in Appendix II (Supplementary Materials).
Estimation of parameters in individual swine
To increase the accuracy of individual fits, clinical interventions were applied to each swine to mimic the unique clinical care it received. Clinical markers such as P/F ratio, oxygen saturation, and mean arterial pressure were fit simultaneously with measured cytokines. Multiple iterations of fits were executed until each of the four experimental swine had its own unique model that produced time courses that accurately matched experimental data.
Model Solution Clustering
As is typical in estimation exercises involving large numbers of parameters, many sets of parameter combinations match the experimental data. To deal with this problem, Immunetrics Inc. proprietary software uses k-means clustering techniques to find multi-dimensional centroids to the solutions. The clustering alone reduces large numbers of solutions to an ensemble of models. Solutions with large changes in the model parameters were generally avoided.
RESULTS
Endotoxemia in swine results in dynamic changes in the inflammatory response
Endotoxin had a profound effect on both hemodynamics and lung function (Table 1). There was a large decrease in mean arterial pressure (MAP) and cardiac output (CO) over time. Lung function was compromised, with increases in peak (Ppeak), plateau (Pplat) and mean (Pmean) airway pressures and fall in static compliance (Cstat). Oxygenation was impaired as indicated by a fall in the PaO2/FiO2 ratio. The FiO2 was increased to 60% by the end of the experiment on pigs 2583 and 2588 and to 40% in pigs 2589 and 2595. Heat rate (HR), central venous (CVP), pulmonary wedge (PAW) and bladder (Pbladder) pressures showed little change following endotoxin infusion (Table 1). PEEP remained at 3 cmH2O in all animals, since attempts to increase PEEP lead to an immediate hemodynamic compromise.
Table 1. Hemodynamic and pulmonary function.
Swine (n=4) were subjected to endotoxemia as described in the Materials and Methods. Assessments of hemodynamic and pulmonary function were performed at the indicated time points (in hours).
| BL | 0.5 | 1.0 | 1.5 | 2.0 | 2.5 | 3.0 | 3.5 | 4.0 | 4.5 | 5.0 | 5.5 | 6.0 | |
|---|---|---|---|---|---|---|---|---|---|---|---|---|---|
| HR (beats min−1) | 100.5±8.8 | 99.3±10.0 | 110.0±13.4 | 114.8±11.0 | 119.8±16.2 | 118.0±18.2 | 115.3±30.6 | 112.3±26.9 | 109.7±25.6 | 104.0±18.2 | 99.7±14.2 | 98.3±9.3 | 109.7±6.4 |
| MAP (mmHg) | 117.3±4.4 | 98.0±18.9 | 110.8±2.3 | 93.7±6.4 | 72.0±12.6 | 77.3±17.6 | 76.7±12.2 | 82.7±11.1 | 87.7±10.8 | 100.7±8.5 | 109.0±5.0 | 104.3±6.7 | 98.3±16.7 |
| PAP (mm Hg) | 23.3±4.6 | 44.8±2.3 | 36.5±3.8 | 30.3±3.5 | 33.3±3.8 | 37.3±6.4 | 34.3±2.3 | 37.0±1.5 | 37.3±3.3 | 38.7±4.8 | 38.7±4.9 | 36.3±4.2 | 37.3±5.8 |
| CVP (mm Hg) | 6.5±1.3 | 7.0±0.7 | 6.0±1.1 | 4.3±1.1 | 5.8±1.3 | 7.0±2.5 | 5.3±0.9 | 6.0±1.0 | 5.7±0.9 | 5.0±1.0 | 6.0±1.2 | 5.3±1.2 | 5.0±0.6 |
| PAW (mm Hg) | 7.0±1.3 | 9.3±1.2 | 7.3±1.3 | 7.3±2.4 | 8.3±2.3 | 8.0±1.2 | 7.0±0.6 | 9.0±2.1 | 9.7±3.2 | 9.3±1.9 | 8.7±2.7 | 8.3±1.8 | 9.3±1.8 |
| CO (L min−1) | 3.8±0.5 | 2.3±0.5 | 3.4±0.7 | 3.7±0.4 | 2.9±0.6 | 3.2±0.9 | 2.3±0.6 | 2.4±0.3 | 2.7±0.2 | 2.0±0.6 | 1.8±0.6 | 1.5±0.9 | 1.2±0.6 |
| Ppeak (cm H2O) | 22.5±2.6 | 21.5±1.0 | 22.3±1.4 | 25.5±3.6 | 29.3±6.7 | 23.3±2.0 | 24.3±2.1 | 25.7±3.2 | 27.7±4.7 | 28.3±5.5 | 29.3±5.8 | 29.7±6.2 | 30.0±7.0 |
| Pplat (cm H2O) | 18.8±0.8 | 20.3±0.9 | 21.0±1.2 | 23.8±3.3 | 26.8±5.5 | 22.0±1.5 | 23.3±1.2 | 24.3±2.8 | 26.0±4.5 | 26.0±5.1 | 27.7±5.2 | 28.0±5.6 | 28.3±6.4 |
| Pmean (cm H2O) | 6.4±0.5 | 7.3±0.2 | 7.3±0.3 | 7.9±0.8 | 9.9±2.4 | 7.6±0.4 | 7.9±0.5 | 8.5±0.7 | 8.9±1.5 | 8.9±1.6 | 9.0±1.5 | 9.3±1.9 | 9.7±1.6 |
| Cstat (ml cm H2O−1) | 23.7±3.4 | 21.6±3.4 | 20.9±3.9 | 19.4±4.4 | 17.8±4.5 | 19.9±4.3 | 19.1±4.3 | 19.1±4.9 | 18.1±4.6 | 18.4±4.9 | 16.9±4.4 | 17.3±4.7 | 17.0±4.8 |
| Pbladder (mm Hg) | 5.5±1.7 | 4.5±1.6 | 5.8±1.1 | 8.0±3.5 | 6.5±1.2 | 5.3±1.8 | 8.0±1.2 | 7.7±2.3 | 6.0±1.2 | 6.7±2.2 | 5.7±1.3 | 7.5±1.5 | 8.7±1.2 |
| PaO2/FiO2 | 425.5±25.4 | 362.7±30.6 | 370.4±59.4 | 329.1±49.7 | 351.1±66.0 | 334.8±17.4 | 382.1±60.0 | 391.1±57.7 | 366.6±66.2 | 348.3±69.8 | 325.0±82.2 | 312.9±109.1 | 290.9±105.0 |
All data are mean ± SEM. BL = baseline, HR = heart rate, MAP = mean arterial pressure, PAP = pulmonary artery pressure, CVP = central venous pressure, PAW = pulmonary artery wedge pressure, CO = cardiac output, Ppeak= peak airway pressure, Pplat = plateau airway pressure, Pmean = mean airway pressure, Cstat = static lung compliance, Pbladder = bladder pressure.
As seen in Fig. 1, all of the circulating inflammatory mediators assessed (HMGB1, IL-1β, IL-6, IL-8, IL-10, and TNF-α) exhibited statistically significant changes at some point in the 6-h time course of this experiment. Circulating TNF-αand IL-10 exhibited early peaks (~90 min from the time of infusion of endotoxin). Interleukin-8 exhibited a later peak (~3 h from the time of infusion of endotoxin). Interleukin-6 levels reached a plateau by ~3 h, which lasted until the end of the experiment. However, two notable exceptions to prior studies were observed: IL-1β peaked at ~5 h, later than what was expected from prior studies (e.g an expected peak at 2–3 h following endotoxin administration). HMGB1 exhibited a biphasic behavior, with an early (~1 h) peak, with a rise that reached its highest level at the end of the experiment (6 h). Circulating NO2−/NO3− were not changed significantly during the time course of this study (data not shown).
Figure 1. Mean circulating levels of inflammatory mediators in endotoxemic swine.

Swine (n = 4) were subjected to endotoxemia as described in the Materials and Methods. The indicated inflammatory mediators were assessed in serial plasma samples obtained at the indicated time points. Values are mean ± SEM. *P < 0.05 vs. t = 0 (one-way ANOVA on ranks)
We also assessed these mediators in the bronchoalveolar lavage fluid (BALF) at the end of the experiment (6 h post-endotoxin infusion). The BALF levels of the mediators were as follows: IL-1β(2022 ± 1083 pg/ml; range: 177 – 5133 pg/ml); IL-6 (780 ± 502 pg/ml; range: 125 – 1992 pg/ml); IL-8 (2426 ± 1307 pg/ml; range: 213 – 6876 pg/ml); TNF-α(260 ± 255 pg/ml; range: 93 – 437 pg/ml); HMGB1 (64 ± 35 ng/ml; range: 11 – 177 ng/ml), and NO2−/NO3− (13 ± 13 μM; range: 5 – 20 μM). Interleukin-10 was below the limit of detection in the BALF.
Principal Component Analysis suggests that IL-1βis a principal driver of inflammation in porcine endotoxemia and acute lung injury
Figure 2A shows the results of PCA, in which the contribution of each cytokine to the total variance in the data is rank-ordered from greatest to least. This analysis suggested that the contributors to the systemic inflammatory response, in order of effect from greatest to least, were IL-1β> IL-10 > IL-8 > TNF-α> IL-6 > NO2−/NO3−. This finding was surprising, since the pro- inflammatory cytokine TNF-αwas elevated sooner than IL-1β, and since many prior studies (including those involving mathematical modeling (21, 22, 25)) suggested that TNF-αshould be the primary driver of inflammation in the setting of endotoxemia. Based on PCA as well as the relative timing of production of TNF-αand IL-1β, we hypothesized the sequence of events depicted in Fig. 2B. In this schematic, infused endotoxin stimulates the production of TNF-αfrom monocytes in the blood. These cells traffic to the lung, where in the absence of endotoxin the TNF-αthey produce leads to the production of HMGB1 from local cells. In turn, HMGB1 leads to the production of IL-1βat high levels, which then spills over to the systemic circulation. These pro-inflammatory signals create a positive feedback loop that is either regulated by anti-inflammatory mediators such as IL-10, or self-amplifies and leads to hemodynamic collapse, ARDS, and death.
Figure 2. Principal drivers of inflammation and schematic of a mathematical model of endotoxemia.

Swine were subjected to endotoxemia followed by serial blood sampling and measurement of cytokines and NO2−/NO3− as described in the Materials and Methods. Panel A: Principal Component Analysis (PCA) was carried out on the time courses of all inflammatory analytes. The figure shows the sorted overall PCA score for each inflammatory mediator. Panel B: Schematic of hypothetical trans-compartmental inflammatory interactions inferred from PCA. Panel C: Schematic depicting overall structure of mathematical model of porcine endotoxemia.
This hypothetical mechanism is supported by the BALF data described above, and formed the basis of a mechanistic mathematical model of endotoxin-induced inflammation and organ, physiologic impairment (hypotension and lung function), and overall health status, (Fig. 2C; for details, see Supplementary Materials, Appendix I).
Individual-specific mathematical models of inflammation, lung injury, and health status in porcine endotoxemia
We next sought to create individual-specific variants of our core mathematical model, in an attempt to fit to the data of individual endotoxemic swine and thereby to gain insights into diverse responses that spanned the gamut from mild physiological derangements, to severe ARDS-like symptoms, to death
Pig 2588
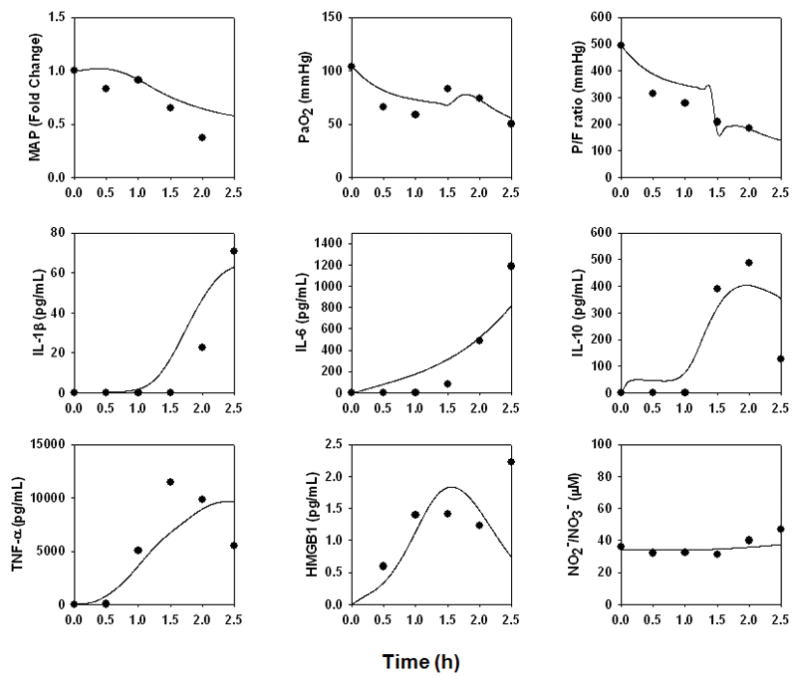
This animal survived until the conclusion of the study, exhibiting transient hypotension; normal lung pressure; a transient fall in P/F ratio; and transient elevations in TNF-α, IL-10, and HMGB1 with more persistent elevations of IL-1β, IL-6, and NO2−/NO3− (Fig. 3). However, this animal did not exhibit ARDS-like symptoms (P/F ratio = 397; Cstat = 20.0 L/cmH2O; Pplat, = 21 cmH2O) or ALI (Fig. 7A). The data from this animal were used to parameterize the “baseline inflammation” version of the mathematical model described above (see Supplementary Materials, Appendix II), as this pig appeared to have a healthy, resolving inflammatory response to endotoxin.
Figure 3. An individual-specific mathematical model of a “healthy” porcine response to endotoxin.
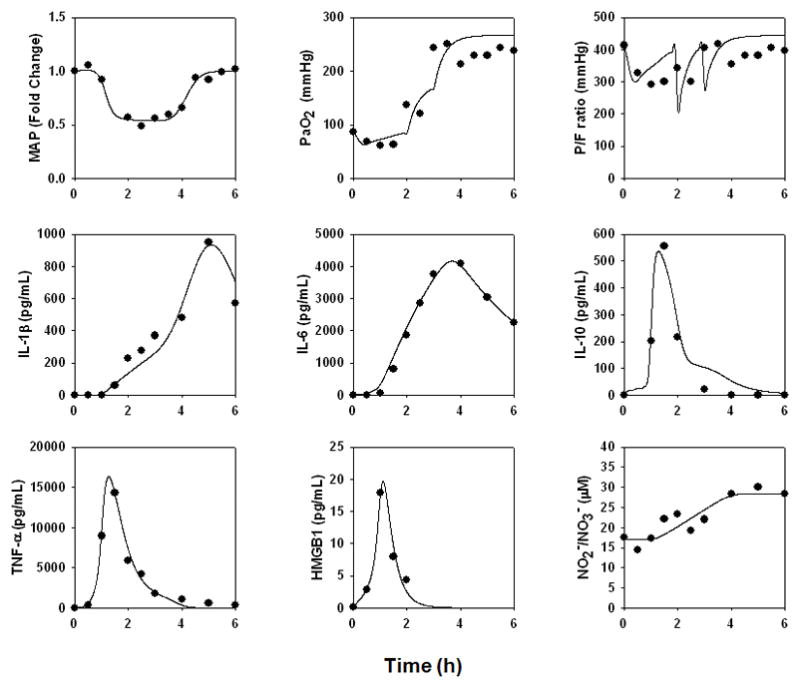
A mathematical model of porcine endotoxemia was created as described in Fig. 2C and detailed in the Supplementary Materials, Appendix I. The data from the “healthiest” responder to endotoxin, Pig 2588, were used to determine parameter values as described in the Materials and Methods and Supplementary Materials, Appendix II. Symbols depict actual data points, and lines indicate model fits.
Figure 7. Histopathologic assessment of lung tissue.
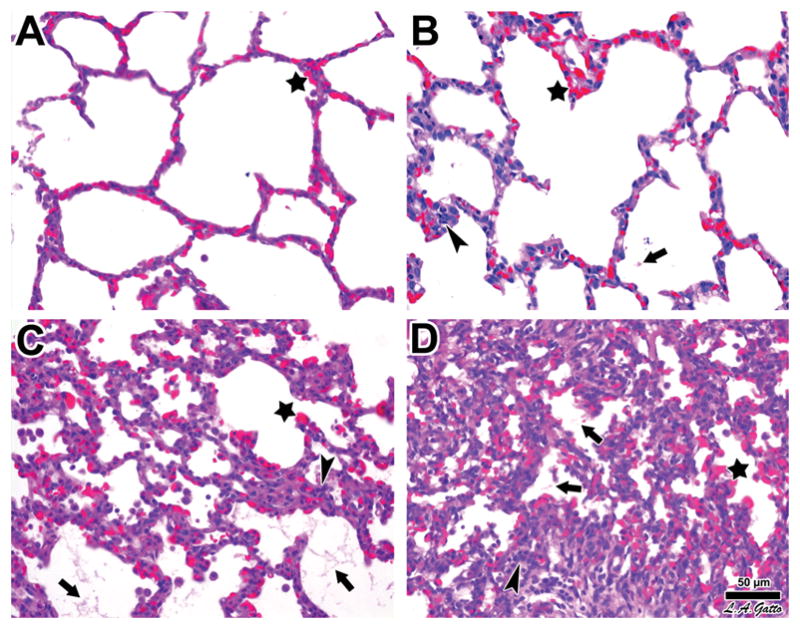
Swine were subjected to endotoxemia and survivor animals sacrificed at the end of the experimental period. Upon death, their lungs were processed for histology and hematoxylin & eosin staining as described in the Materials and Methods. Panel A. The lungs of Pig 2588 demonstrated normal histology except for blood vessel congestion conspicuous at all levels, including alveolar capillaries (star). Panel B. The lungs of Pig 2595 exhibited a higher level of histological involvement marked by the focal presence of fibrinous deposits in the alveolar lumen (arrow), along with greater infiltration of leukocytes (arrowhead), in addition to alveolar capillary congestion (star). Panel C. The lungs of Pig 2583 showed all signs of ARDS, including alveolar capillary congestion (star), fibrinous deposits (arrows), and abundant leukocyte infiltration (arrowhead). Panel D. The lungs of Pig 2589 showed the most pronounced signs of acute lung injury, with widespread alveolar capillary congestion (star), fibrinous deposits in the air compartment (arrows), and marked cellularity associated with more severe leukocyte infiltration (arrowhead). The progression from A to D is also marked by increased atelectasis. Bar = 50 μm.
Pig 2595
This animal survived until the conclusion of the study, and exhibited very low cardiac output; a normal MAP; and transient elevations in TNF-α, IL-10, and HMGB1 with more persistent elevations of IL-1β, IL-6, and NO2−/NO3− (Fig. 4). Like pig 2588, this animal did not exhibit ARDS-like symptoms (P/F ratio = 394; Cstat = 21.8 L/cmH2O; Pplat, = 22 cmH2O) or ALI (Fig. 7B). In order to fit this animal’s data, the “baseline inflammation” model required the changes in parameters and initial conditions detailed in the Supplementary Materials, Appendix II. The greatest increases (defined as two-fold or higher) to the values required to fit the mathematical model to the data from Pig 2595 occurred in parameters governing the production rate of IL-6 bym activated lung epithelial cells; the contributing effect of PaO2 drop on damage; the production rate of IL-6 by activated neutrophils; the pro-inflammatory effects of damage on macrophages and neutrophils; the production rate of IL-1β by activated lung epithelial cells; the pro-inflammatory effect of IL-6 on macrophages; and, to a lesser extent, the saturation term for the pro-inflammatory effect of IL-6 on IL-1β production.
Figure 4. An individual-specific mathematical model of a mild physiological derangement and no ARDS-like symptoms (i.e. Low P/F ratio and Cstat with high Pplat) in a pig.
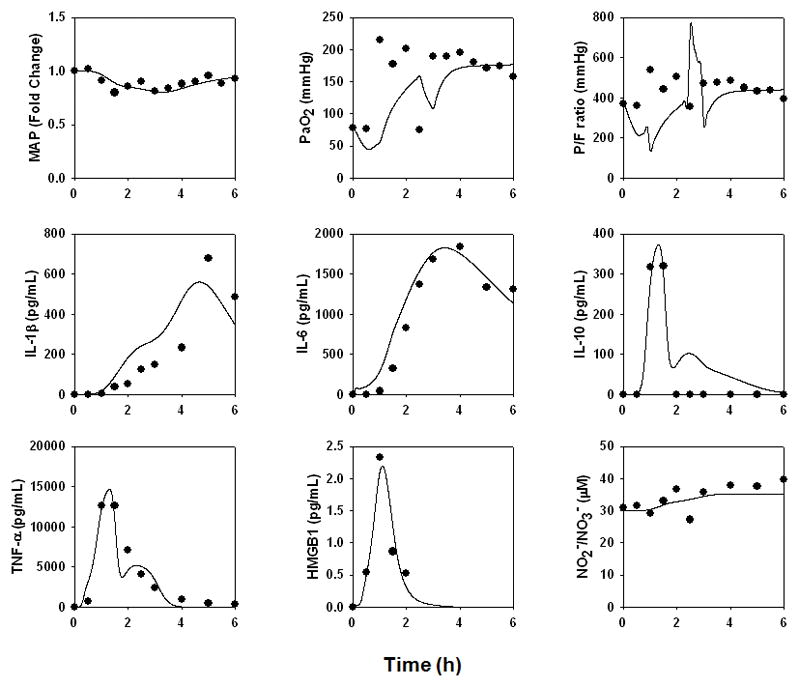
The data from a pig undergoing mild physiological derangement but not ARDS (Pig 2595) in response to endotoxin were used to re-fit the model described in Fig. 3.
Pig 2583
This animal survived until the conclusion of the study, but had a large fall in cardiac output and transient elevations in HMGB1, with more persistent elevations of TNF-α, IL-10, IL-1β, IL-6, and NO2−/NO3− (Fig. 5). This animal exhibited ARDS-like symptoms (P/F ratio = 163; Cstat = 7.5 L/cmH2O; Pplat, = 41 cmH2O) (Fig. 7C). In order to fit this animal’s data, the “baseline inflammation” model required the changes in parameters and initial conditions detailed in the Supplementary Materials, Appendix II. The “baseline inflammation” model required the greatest increases in the parameters governing the production rate of IL-6 by activated lung epithelial cells and neutrophils; the effect of lung inflammation on gas exchange; the pro-inflammatory effect of endotoxin on macrophages; the contributing effect of PaO2 drop on damage; the saturation term for the inflammatory effect of IL-6 on IL-1β production; the production rate of HMGB1 by activated neutrophils; and the pro-inflammatory effects of damage on macrophages and neutrophils.
Figure 5. An individual-specific mathematical model of hemodynamic collapse and ARDS-like symptoms in a pig.
The data from a pig undergoing hemodynamic collapse and exhibiting ARDS-like symptoms (Pig 2583) in response to endotoxin were used to re-fit the model described in Fig. 3.
Pig 2589
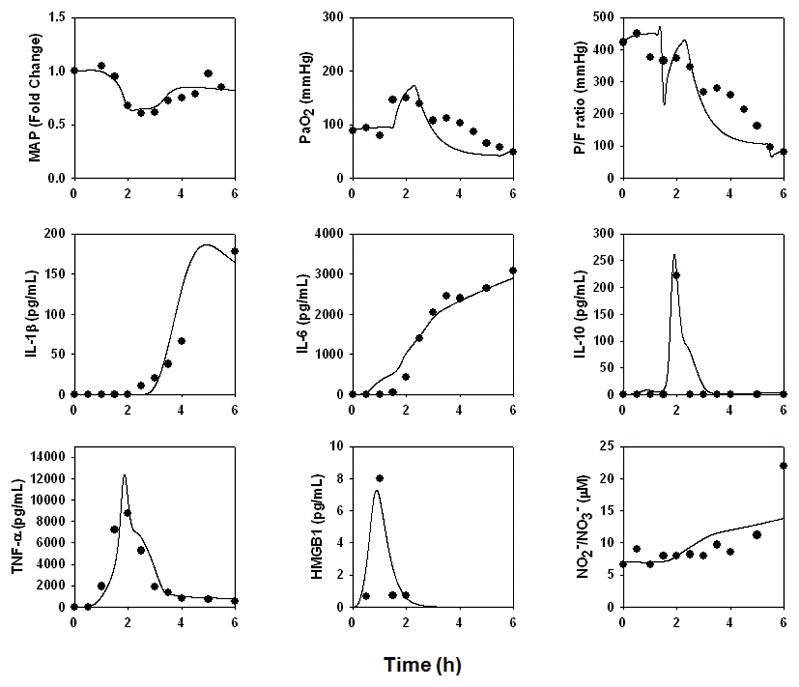
This animal did not survive beyond 2.5 h, exhibiting hemodynamic collapse and transient -elevations in HMGB1, with more persistent elevations of TNF-α, IL-10, IL-1β, IL-6, and NO2 /NO3− (Fig. 6). This animal also exhibited ARDS-like symptoms (P/F ratio = 184; Cstat = 8.6 L/cmH2O; Pplat, = 43 cmH2O) (Fig. 7D). In order to fit this animal’s data, the “baseline inflammation” model required the greatest increases in the parameters governing the production rates of IL-6 by activated lung epithelial cells and neutrophils; the effect of lung inflammation on gas exchange; the production rate of IL-1β by activated lung epithelial cells; the saturation term for the pro-inflammatory effect of IL-1β on IL-6 production; the production rate of IL-10 by activated neutrophils; the pro-inflammatory effect of IL-6 on macrophages; the pro-inflammatory effects of damage on macrophages and neutrophils; and the baseline eNOS level.
Figure 6. An individual-specific mathematical model of hemodynamic collapse, ARDS-like symptoms, and death.
The data from a pig undergoing hemodynamic collapse, exhibiting ARDS-like symptoms, and who died 2.5 h into the study (Pig 2589) in response to endotoxin were used to re-fit the model described in Fig. 3.
Prediction and validation of individual health trajectories
Having demonstrated that a mathematical model of inflammation and physiology could be fit to data from endotoxemic swine exhibiting widely divergent phenotypes, we next sought to test the ability of the model to predict overall health outcomes of these animals. Accordingly, we sought to compare against actual data a variable not calibrated a priori with data from the four swine, and we further sought to test the ability to predict individual health outcomes. The mathematical model includes a “damage” variable, which is a combination of decreased PaO2, elevated inflammatory cytokines, and decreased MAP – all of which cause overall damage to the system (Fig. 2C; Supplementary Materials, Appendix I); we considered this variable to be a surrogate for the health status of the animal. Out of the many primary and calculated physiological variables determined in the experimental animals, the Oxygen Index (OI = FiO2 * Pm / PaO2) is the only routine measure that takes into account both oxygenation and lung pressures (26). The OI has also been found to be predictive of acute hypoxic respiratory failure in children, suggesting that this metric may be a valuable predictor of lung health (27).
As seen in Fig. 8, predicted “damage” trajectories matched OI trajectories qualitatively in 3 of 4 swine. These studies included a striking, non-intuitive prediction that similar peak “damage” levels (but very different trajectories) would be observed in both the healthiest animal (Pig 2588; Fig. 8A) and the animal that died with ARDS-like symptoms (Pig 2589; Fig. 8D). Indeed, peak OI levels were quite similar between these two animals, and in fact the predicted OI trajectories were different, peaking earlier for Pig 2588 vs. Pig 2589. Likewise, predicted “damage” and OI had very similar trajectories in Pig 2583, the sickest surviving animal. However, there was little correspondence between model-predicted “damage” and OI for Pig 2595 (Fig. 8B).
Figure 8. Correspondence between individual model-predicted “damage” and Oxygen Index.
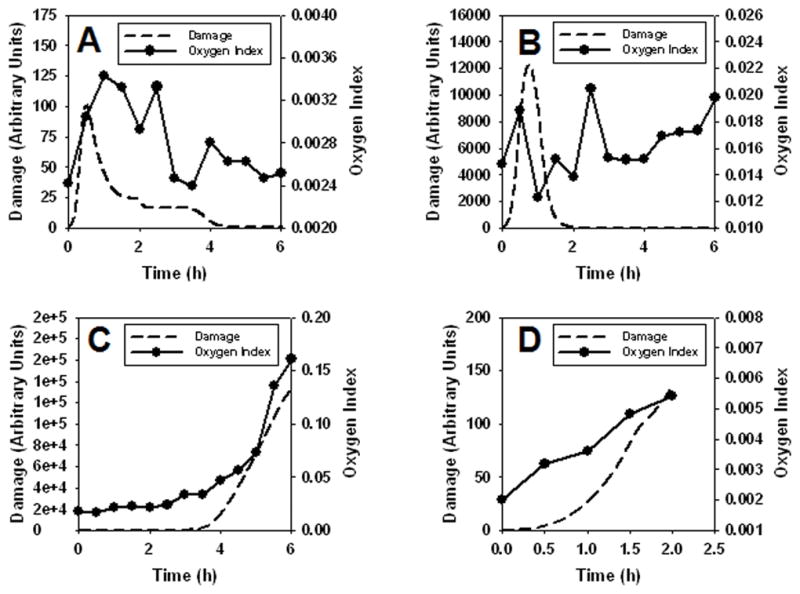
The damage variable, a combination of decreased PaO2, elevated inflammatory cytokines, and decreased MAP, causes overall damage to the system (dashed lines); this was compared to Oxygen Index (filled circles, solid lines) in four individual swine. Panel A: Pig 2588. Panel B: Pig 2595. Panel C: Pig 2583. Panel D: Pig 2589.
DISCUSSION
We have focused on the use of mechanistic computational modeling as a tool to decipher the complexity of acute inflammation and related organ pathophysiology, reasoning that an appropriately-constructed and -calibrated mathematical model, which captures dynamic interactions involving inflammation and physiology at the whole-animal level, could be of use in predicting individual health status (11, 16, 28). In our prior work, we calibrated and validated aspects of various one-compartment, equation-based mathematical models using data in mice (21–24) and rats (25). These mathematical models consider the entire host as a single, well-mixed space in which cells and inflammatory mediators diffuse freely. Importantly, these models suggested the presence of many common mechanisms in diverse inflammatory insults such as endotoxemia and hemorrhagic shock, with different outcomes being due to differences in initial conditions and strengths of interactions rather than intrinsically different biological mechanisms (21–24). Using this type of model, our work supported an emerging hypothesis regarding the role of underlying trauma in the host’s response to subsequent hemorrhagic shock (23). In addition, we showed that we could adapt a mathematical “baseline inflammation” model (calibrated for data in C57Bl/6 mice) to data obtained in CD-14-deficient mice, and thereby gain some insights into the role of this molecule in the inflammatory response in vivo (22).
Despite the successes of the initial one-compartment models, a more realistic view of inflammation needs to take into consideration the interplay among biological compartments. Studies from various groups have suggested that, in the setting of endotoxemia and sepsis, inflammation is altered differentially depending on the particular compartment being examined (29). In the present study, accordingly, we expanded our mathematical model to encompass two compartments, the lung and the remainder of the body, in order to gain insights into the role of inter-compartment interplay in the setting of a large-animal paradigm of acute inflammation. Moreover, we sought to revise the method by which biological mechanisms are incorporated into our mathematical models of inflammation. Our initial models were based on an extensive review of the literature, which was used to define the variables to be included and infer their interactions (15, 21–24). However, a more objective method involves querying an appropriate dataset and inferring principal drivers, using objective, quantitative methods as much as possible. Accordingly, inflammation biomarkers were analyzed in serial plasma samples from endotoxemic pigs. Key drivers of certain responses were inferred using PCA, a data-driven modeling technique that, though not intrinsically mechanistic, can be used to infer key drivers of a time-varying (dynamic) response (30). This methodology was crucial for the mathematical model described herein. For example, our data showed that, as expected, TNF-αwas elevated in the circulation to a high degree in all animals in response to endotoxin infusion, and reached a peak prior to IL-1β in response to endotoxin. However, PCA suggested that IL-1βrather than TNF-αmay be a main driver of the observed inflammatory response. We note that unpublished studies from our group on trauma patients suggest that IL-1β is a principal mediator in trauma/hemorrhage as well, suggesting that this observation is not an artifact of the relatively small number of inflammatory mediators assessed in the present study.
A mathematical model was constructed based on these inferences from PCA. This model consisted of relevant cells, pro- and anti-inflammatory cytokines, blood pressure, lung functional parameters (e.g. PaO2/FiO2 ratio), and a damage variable that recapitulates the health of the animal as a compendium of inflammation and deranged physiology.
Though the dynamics of plasma cytokines and NO2−/NO3− from all four animals appeared reasonably uniform over the time course of this study, there were major differences among animals with regard to physiologic alterations, ALI/inflammation, and survival. One animal (Pig 2588) survived until the conclusion of the study, exhibiting transient changes in physiology and inflammation, and no histological sign of ALI or features of ARDS. Since we interpreted these observations to mean that this animal exhibited an “appropriate” inflammatory response to endotoxin, the data from this animal were therefore used to parameterize the “baseline inflammation” version of the mathematical model described above. With changes to specific parameter values consistent with differences in injury or individual-specific differences in a restricted set of cellular inflammatory responses, this “baseline inflammation” model was capable of fitting the data of pigs with very different profiles. These animals ranged in phenotypes/outcomes, with increasing severity of physiologic impairments and ALI, and even death. Our ability to match the inflammatory and physiologic dynamics of these different endotoxemic swine using a common “wiring diagram” supports the hypothesis that the response to endotoxin in diverse individuals is due to differences in initial conditions and strengths of interactions among biological components, rather than being due to intrinsically different biological mechanisms in individual animals.
Though we were highly encouraged by the ability to fit variants of our two-compartment mathematical model to data from individual, outbred animals with diverse physiological trajectories and ultimate outcomes, we nonetheless sought to validate our mathematical model using data on which the model was not trained. Moreover, one of our long-term goals is to utilize mechanistic modeling to predict the health outcomes of individuals (10, 11, 16, 17, 31). Accordingly, we sought to test the ability of the model to predict overall health outcomes of these animals. Out of the many primary and calculated physiological variables determined in the experimental animals, the Oxygen Index is the only routine measure that takes into account both oxygenation and lung pressures (26). In addition, the OI was chosen as an index of animal health since if one obtains adequate oxygenation only by applying very high airway pressures, then the possibility exists that the lung will be further damaged by a secondary ventilator-induced lung injury (VILI). Thus, a normal or low OI indicates the presence of adequate oxygenation without the risk causing a secondary VILI.
Predicted “damage” trajectories matched OI trajectories qualitatively in 3 of 4 swine. These studies included a striking, non-intuitive prediction that similar peak “damage” levels (but very different trajectories) would be observed in both the healthiest animal (Pig 2588) and the animal that died with ARDS-like symptoms (Pig 2589). Peak OI levels were quite similar between these two animals, and in fact the predicted OI trajectories were different, peaking earlier for Pig 2588 vs. Pig 2589. Likewise, predicted “damage” and OI had very similar trajectories in Pig 2583, the sickest surviving animal. However, there was little correspondence between model-predicted “damage” and OI for Pig 2595, for reasons that are not clear at this time. In many previous experiments using multiple animal models, we have noted a discrepancy between clinically measurable pathology (P/F ratio) and ALI (G.F. Nieman, unpublished observations). Occasionally, animals show minimal changes in P/F but have significant lung histopathology at necropsy. We believe that this is due to the capacity of the lung to match ventilation with perfusion, which normalizes P/F in spite of significant ALI. This is a possible explanation for the observation in this study in which “damage” and OI did not correspond in Pig 2595. Clearly, further studies are needed in order to fully elucidate this issue; we do note that dynamics of standard markers of organ damage or physiological dysfunction, e.g. AST, ALT, lactate, pH, and base excess did not match the model-predicted “damage” curves in any of the animals (data not shown).
There are several limitations to our study, including pro-inflammatory paradigm, the number of animals involved, and mediators/functions assessed and modeled mathematically. We discuss each of these points below.
As our inflammatory paradigm in swine, we chose endotoxemia. We have previously shown that a large dose of Endotoxin (100 μg/kg) causes a massive inflammatory response in pigs, leading to a rapid onset of pulmonary edema, ARDS-like symptoms, and death within 6 h (32). This rapid onset of systemic inflammation and organ pathology were desirable for our initial mathematical modeling of the porcine acute inflammatory response. It is by now quite clear that endotoxemia is not the same as true sepsis (33).
For modeling purposes, the various biologic compartments of relevance to acute inflammation in porcine endotoxemia (intra-alveolar, intravascular, intraperitoneal) were simplified to consider only a “lung” and a “blood” compartment. Various factors could transition between these two simplified compartments. However, in vivo there are extensive interactions among compartments, especially in pathologic states such as sepsis. Microvascular permeability is significantly increased during sepsis, such that intravascular inflammatory mediators can “leak” into the intra-alveolar compartment. For the purposes of the model, we considered the inflammatory mediators found in the BALF to be derived exclusively from the intra-alveolar compartment, but it is possible that some of these mediators were actually generated in the intravascular space. Also, we concentrated on a relatively limited number of inflammatory mediators, partially because we sought to constrain the size of our mathematical model and partially because we were constrained by commercially available reagents for porcine mediators. Thus, it is possible that the PCA and modeling results may have turned out differently had additional mediators been included.
CONCLUSIONS
In conclusion, the present study highlights the potentially translational utility of dynamic mathematical modeling in the setting of small cohorts of genetically distinct individuals undergoing acute inflammation. We have suggested that mathematical modeling could streamline clinical studies by defining characteristics of individuals to be included in or excluded from clinical trials, as well as providing for personalized therapy for inflammatory conditions (9, 11, 16, 31, 34). Importantly, as patient cohorts become increasingly complex and multi-factorial in their presentation, and as clinical studies increase in cost, mathematical modeling may serve to infer more from fewer patients.
Supplementary Material
Acknowledgments
Financial Support: This work was supported by NIH grants R33-HL-089082, P50-GM-53789, and R01-HL080926.
Footnotes
Dr. Vodovotz consulted for Immunetrics, and holds equity interest and stock options in Immunetrics. Drs. Chang, Sarkar, and Brown are employees of Immunetrics. Dr. Constantine is an employee of the University of Pittsburgh, Department of Mathematics. The remaining authors have not disclosed any potential conflicts of interest.
References
- 1.Angus DC, Linde-Zwirble WT, Lidicker J, et al. Epidemiology of severe sepsis in the United States: analysis of incidence, outcome, and associated costs of care. Crit Care Med. 2001;29:1303–1310. doi: 10.1097/00003246-200107000-00002. [DOI] [PubMed] [Google Scholar]
- 2.Namas R, Zamora R, Namas R, et al. Sepsis: Something old, something new, and a systems view. J Crit Care. 2011 doi: 10.1016/j.jcrc.2011.05.025. [DOI] [PMC free article] [PubMed] [Google Scholar]
- 3.Freeman BD, Natanson C. Anti-inflammatory therapies in sepsis and septic shock. Expert Opin Investig Drugs. 2000;9:1651–1663. doi: 10.1517/13543784.9.7.1651. [DOI] [PubMed] [Google Scholar]
- 4.Buchman TG, Cobb JP, Lapedes AS, et al. Complex systems analysis: a tool for shock research. Shock. 2001;16:248–251. doi: 10.1097/00024382-200116040-00002. [DOI] [PubMed] [Google Scholar]
- 5.Tjardes T, Neugebauer E. Sepsis research in the next millennium: concentrate on the software rather than the hardware. Shock. 2002;17:1–8. doi: 10.1097/00024382-200201000-00001. [DOI] [PubMed] [Google Scholar]
- 6.Bone RC. The sepsis syndrome. Definition and general approach to management. Clin Chest Med. 1996;17:175–181. doi: 10.1016/s0272-5231(05)70307-5. [DOI] [PubMed] [Google Scholar]
- 7.Kellum JA, Kong L, Fink MP, et al. Understanding the inflammatory cytokine response in pneumonia and sepsis: results of the Genetic and Inflammatory Markers of Sepsis (GenIMS) Study. Arch Intern Med. 2007;167:1655–1663. doi: 10.1001/archinte.167.15.1655. [DOI] [PMC free article] [PubMed] [Google Scholar]
- 8.Angus DC, Yang L, Kong L, et al. Circulating high-mobility group box 1 (HMGB1) concentrations are elevated in both uncomplicated pneumonia and pneumonia with severe sepsis. Crit Care Med. 2007;35:1061–1067. doi: 10.1097/01.CCM.0000259534.68873.2A. [DOI] [PubMed] [Google Scholar]
- 9.Whitcomb DC, Aoun E, Vodovotz Y, et al. Evaluating disorders with a complex genetics basis: The future role of meta-analysis and systems biology. Dig Dis Sci. 2005;50:2195–2202. doi: 10.1007/s10620-005-3033-7. [DOI] [PubMed] [Google Scholar]
- 10.Vodovotz Y, An G. Systems Biology and Inflammation. In: Yan Q, editor. Systems Biology in Drug Discovery and Development: Methods and Protocols. Totowa, NJ: Springer Science & Business Media; 2009. pp. 181–201. [Google Scholar]
- 11.Mi Q, Li NYK, Ziraldo C, et al. Translational systems biology of inflammation: Potential applications to personalized medicine. Personalized Medicine. 2010;7:549–559. doi: 10.2217/pme.10.45. [DOI] [PMC free article] [PubMed] [Google Scholar]
- 12.Kitano H. Systems biology: a brief overview. Science. 2002;295:1662–1664. doi: 10.1126/science.1069492. [DOI] [PubMed] [Google Scholar]
- 13.Buchman TG. The community of the self. Nature. 2002;420:246–251. doi: 10.1038/nature01260. [DOI] [PubMed] [Google Scholar]
- 14.Neugebauer E, Tjardes T the Multidisciplinary Working Group on Complexity. New Approaches to Shock and Trauma Research: Learning from Multidisciplinary Exchange. J Trauma. 2004;56:1156–1165. doi: 10.1097/01.ta.0000119207.14267.63. [DOI] [PubMed] [Google Scholar]
- 15.Vodovotz Y, Clermont G, Chow C, et al. Mathematical models of the acute inflammatory response. Curr Opin Crit Care. 2004;10:383–390. doi: 10.1097/01.ccx.0000139360.30327.69. [DOI] [PubMed] [Google Scholar]
- 16.Vodovotz Y, Csete M, Bartels J, et al. Translational systems biology of inflammation. PLoS Comput Biol. 2008;4:1–6. doi: 10.1371/journal.pcbi.1000014. [DOI] [PMC free article] [PubMed] [Google Scholar]
- 17.Vodovotz Y, Constantine G, Rubin J, et al. Mechanistic simulations of inflammation: Current state and future prospects. Math Biosci. 2009;217:1–10. doi: 10.1016/j.mbs.2008.07.013. [DOI] [PMC free article] [PubMed] [Google Scholar]
- 18.An G, Faeder J, Vodovotz Y. Translational systems biology: Introduction of an engineering approach to the pathophysiology of the burn patient. J Burn Care Res. 2008;29:277–285. doi: 10.1097/BCR.0b013e31816677c8. [DOI] [PMC free article] [PubMed] [Google Scholar]
- 19.Kubiak BD, Albert SP, Gatto LA, et al. Peritoneal negative pressure therapy prevents multiple organ injury in a chronic porcine sepsis and ischemia/reperfusion model. Shock. 2010 doi: 10.1097/SHK.0b013e3181e14cd2. [DOI] [PubMed] [Google Scholar]
- 20.Mi Q, Constantine G, Ziraldo C, et al. A dynamic view of trauma/hemorrhage-induced inflammation in mice: Principal drivers and networks. PLoS ONE. 2011;6:e19424. doi: 10.1371/journal.pone.0019424. [DOI] [PMC free article] [PubMed] [Google Scholar]
- 21.Chow CC, Clermont G, Kumar R, et al. The acute inflammatory response in diverse shock states. Shock. 2005;24:74–84. doi: 10.1097/01.shk.0000168526.97716.f3. [DOI] [PubMed] [Google Scholar]
- 22.Prince JM, Levy RM, Bartels J, et al. In silico and in vivo approach to elucidate the inflammatory complexity of CD14-deficient mice. Mol Med. 2006;12:88–96. doi: 10.2119/2006-00012.Prince. [DOI] [PMC free article] [PubMed] [Google Scholar]
- 23.Lagoa CE, Bartels J, Baratt A, et al. The role of initial trauma in the host’s response to injury and hemorrhage: Insights from a comparison of mathematical simulations and hepatic transcriptomic analysis. Shock. 2006;26:592–600. doi: 10.1097/01.shk.0000232272.03602.0a. [DOI] [PubMed] [Google Scholar]
- 24.Torres A, Bentley T, Bartels J, et al. Mathematical modeling of post-hemorrhage inflammation in mice: Studies using a novel, computer-controlled, closed-loop hemorrhage apparatus. Shock. 2009;32:172–178. doi: 10.1097/SHK.0b013e318193cc2b. [DOI] [PubMed] [Google Scholar]
- 25.Daun S, Rubin J, Vodovotz Y, et al. An ensemble of models of the acute inflammatory response to bacterial lipopolysaccharide in rats: Results from parameter space reduction. J Theor Biol. 2008;253:843–853. doi: 10.1016/j.jtbi.2008.04.033. [DOI] [PubMed] [Google Scholar]
- 26.Funk DJ, Lujan E, Moretti EW, et al. A brief report: the use of high-frequency oscillatory ventilation for severe pulmonary contusion. J Trauma. 2008;65:390–395. doi: 10.1097/TA.0b013e31817f283f. [DOI] [PubMed] [Google Scholar]
- 27.Trachsel D, McCrindle BW, Nakagawa S, et al. Oxygenation index predicts outcome in children with acute hypoxemic respiratory failure. Am J Respir Crit Care Med. 2005;172:206–211. doi: 10.1164/rccm.200405-625OC. [DOI] [PubMed] [Google Scholar]
- 28.Vodovotz Y. Deciphering the complexity of acute inflammation using mathematical models. Immunologic Res. 2006;36:237–246. doi: 10.1385/IR:36:1:237. [DOI] [PubMed] [Google Scholar]
- 29.Cavaillon JM, Annane D. Compartmentalization of the inflammatory response in sepsis and SIRS. J Endotoxin Res. 2006;12:151–170. doi: 10.1179/096805106X102246. [DOI] [PubMed] [Google Scholar]
- 30.Janes KA, Yaffe MB. Data-driven modelling of signal-transduction networks. Nat Rev Mol Cell Biol. 2006;7:820–828. doi: 10.1038/nrm2041. [DOI] [PubMed] [Google Scholar]
- 31.Vodovotz Y, Constantine G, Faeder J, et al. Translational systems approaches to the biology of inflammation and healing. Immunopharmacol Immunotoxicol. 2010;32:181–195. doi: 10.3109/08923970903369867. [DOI] [PMC free article] [PubMed] [Google Scholar]
- 32.Lutz C, Carney D, Finck C, et al. Aerosolized surfactant improves pulmonary function in endotoxin-induced lung injury. Am J Respir Crit Care Med. 1998;158:840–845. doi: 10.1164/ajrccm.158.3.9801089. [DOI] [PubMed] [Google Scholar]
- 33.Parker SJ, Watkins PE. Experimental models of gram-negative sepsis. Br J Surg. 2001;88:22–30. doi: 10.1046/j.1365-2168.2001.01632.x. [DOI] [PubMed] [Google Scholar]
- 34.An G, Bartels J, Vodovotz Y. In silico augmentation of the drug development pipeline: Examples from the study of acute inflammation. Drug Dev Res. 2010;72:1–14. doi: 10.1002/ddr.20415. [DOI] [PMC free article] [PubMed] [Google Scholar]
Associated Data
This section collects any data citations, data availability statements, or supplementary materials included in this article.