Background: Profilin binds actin and regulates actin polymerization partly in a formin-dependent manner.
Results: A profilin mutation compensates for an actin mutation causing mitochondrial dysfunction possibly via a formin-dependent process.
Conclusion: The profilin-actin interface packing affects utilization of the actin-profilin complex by formin.
Significance: Regulation of actin polymerization by formin requires its ability to recognize the entire actin-profilin complex not its separate parts.
Keywords: Actin, Cytoskeleton, Microfilaments, Mitochondria, Yeast, Hydrogen-Deuterium Exchange, Formin, Mutagenesis, Nucleotide Exchange, Profilin
Abstract
In the Saccharomyces cerevisiae actin-profilin interface, Ala167 of the actin barbed end W-loop and His372 near the C terminus form a clamp around a profilin segment containing residue Arg81 and Tyr79. Modeling suggests that altering steric packing in this interface regulates actin activity. An actin A167E mutation could increase interface crowding and alter actin regulation, and A167E does cause growth defects and mitochondrial dysfunction. We assessed whether a profilin Y79S mutation with its decreased mass could compensate for actin A167E crowding and rescue the mutant phenotype. Y79S profilin alone caused no growth defect in WT actin cells under standard conditions in rich medium and rescued the mitochondrial phenotype resulting from both the A167E and H372R actin mutations in vivo consistent with our model. Rescue did not result from effects of profilin on actin nucleotide exchange or direct effects of profilin on actin polymerization. Polymerization of A167E actin was less stimulated by formin Bni1 FH1-FH2 fragment than was WT actin. Addition of WT profilin to mixtures of A167E actin and formin fragment significantly altered polymerization kinetics from hyperbolic to a decidedly more sigmoidal behavior. Substitution of Y79S profilin in this system produced A167E behavior nearly identical to that of WT actin. A167E actin caused more dynamic actin cable behavior in vivo than observed with WT actin. Introduction of Y79S restored cable movement to a more normal phenotype. Our studies implicate the importance of the actin-profilin interface for formin-dependent actin and point to the involvement of formin and profilin in the maintenance of mitochondrial integrity and function.
Introduction
The profilins are a family of actin monomer-binding proteins that play a major role in the regulation of actin filament dynamics in the cell. In vitro, they can display a wide range of activities. They can sequester actin monomers in essence acting like an actin buffer (1–3). Profilins, except for those from plants, can facilitate nucleotide exchange from actin in a profilin isoform-specific fashion (4–8). Under some conditions, profilin alone can accelerate actin polymerization (8, 9), whereas under other conditions, it can retard actin polymerization by interfering with filament nucleation (10). Finally, profilin can work with a set of proteins called formins to facilitate actin filament elongation following nucleation by the formin (11). However, the relative contribution of each of these profilin-dependent activities to cytoskeletal function is uncertain.
Profilin binds to actin across subdomains 1 and 3 at what is known as the barbed end of the actin monomer (12–15). This term is derived from the polarity of the actin filament, and this end is the preferred end for addition of a new monomer in the filament (16). Hence, this area is very involved in the regulation of actin filament dynamics.
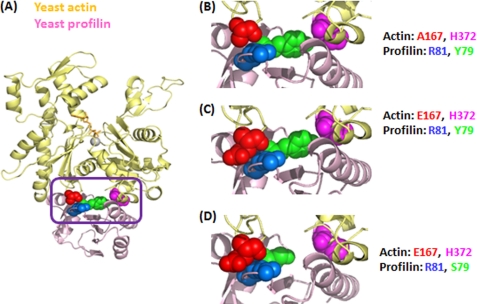
The profilin-actin interface involves actin residue 167 on one end and residue 372 near the C terminus on the other end surrounding two antiparallel β-pleated sheets linked by a β-sheet on profilin (Fig. 1). The actin thus forms essentially a clamp around these secondary structures of profilin, creating a link from the front to the rear faces of the planar actin structure. Residue 167 is one end of a loop, known as the W-loop (17), which has been shown recently to influence the binding of nucleotide in the interdomain cleft that separates the two halves of the actin protein (18). It also lies very near a patch of hydrophobic residues called the “hot spot” (19) that constitutes part of a binding site for a number of actin regulatory proteins besides profilin, such as cofilin (20), twinfilin (21), CapZ (22), formin (23), and proteins containing a WH2 domain(s) (24).
FIGURE 1.
Molecular model of interaction between yeast actin and yeast profilin. A, the molecular structure of the β-actin and bovine profilin complex (Protein Data Bank code 2BTF) was used as a starting structural framework. These coordinates were replaced by the coordinates of yeast actin (Protein Data Bank code 1YAG) and yeast profilin (Protein Data Bank code 1YPR) individually using PyMOL Version 1.3. The purple box highlights the region containing the four residues in either actin or profilin located at the binding interface between these two proteins, and this region was further enlarged in B–D. B–D, actin residues 167/372 and profilin residues 79/81 described in this study are highlighted using space-filling notation and different colors.
Despite the fact that actins from the budding yeast Saccharomyces cerevisiae and skeletal muscle are 87% identical (25), muscle actin cannot complement yeast viability in the absence of yeast actin (26). We hypothesized that part of this incompatibility might be derived from an altered actin-profilin relationship. Previous work from our laboratory and other groups showed that with either yeast or muscle actin human profilin 1 could accelerate nucleotide exchange from actin about 3–1000-fold (10), whereas yeast profilin could only accelerate exchange 2–3-fold (4, 27). Furthermore, the energetics of profilin binding to actin were profilin-dependent. For yeast profilin, the interaction was enthalpically driven, whereas for human profilin, it was entropically driven, independent of the actin (4, 27).
In yeast actin, the part of the W-loop at the actin-profilin interface is Ala167-Gly168-Phe169-Ser170, whereas in muscle actin, it is Glu-Gly-Tyr-Ala. The opposing sequences for the two profilins at the actin-profilin interface are also different to accommodate variations in the W-loop. Fig. 1 shows that with the two yeast proteins there is some room around Ala167 of actin in terms of its relationship with Arg81 of profilin. Substitution of the muscle glutamate to make A167E actin may have a number of consequences. First, in terms of actin alone, this change could alter the entire W-loop, thereby affecting the dynamics of the hinge region separating the two halves of the protein and the hydrophobic hot spot. This would possibly alter the effects of a number of regulatory proteins that bind there. Second, with respect to the actin-profilin interface, this substitution appears to significantly increase steric crowding between the Glu167 of actin and Arg81 of profilin. Such crowding could lead to propagated conformational changes into the interdomain cleft in an attempt to reduce the strain. Such changes could potentially impact the ability of profilin to either affect nucleotide exchange or regulate actin polymerization alone or with formin.
We demonstrated previously that both the A167E and H372R actin mutations had significant and similar deleterious consequences for cell growth and cytoskeletal organization consistent with the packing hypothesis discussed above (28, 29). In this study, we tested the profilin-actin steric packing hypothesis by introducing an alteration into profilin, Y79S, designed to reduce crowding introduced by the actin A167E alteration. We then tested the ability of this mutation to rescue the A167E phenotype in vivo and to alter the actin-profilin interaction in vitro.
EXPERIMENTAL PROCEDURES
Engineering Haploid Mutant Yeast Cells
Mutagenesis was performed on a S. cerevisiae yeast profilin-containing plasmid, pMW172, as described (4) using the Stratagene QuikChange kit (La Jolla, CA) to create the Y79S yeast profilin mutant. A fragment containing the mutant profilin plus the Kan gene as the selection marker was amplified by PCR using primers obtained from Integrated DNA Technologies (Coralville, IA). The fragment was then transformed into yeast strains containing the mutant actins A167E and H372R individually with selection on YPD Geneticin plates. PCR using genomic DNA and sequencing confirmed the integration and maintenance of Y79S profilin.
To create a 3XGFP-ABP140 plasmid containing a URA3 marker, the BamHI/XhoI fragment from PG1994 containing the last 654 bp of ABP140 without the stop codon was subcloned into plasmid 1966 containing 3XGFP and URA3. For chromosomal integration, the resulting plasmid was digested with MscI and transformed into either WT or mutant yeast strains, and colonies were selected on Ura− plates. Several colonies were screened based on the level of fluorescence.
Assessing Growth Defects
The procedures to assess possible growth defects of each mutant cell in rich medium (YPD) or under different stress conditions were described previously (26). Briefly, cells cultured overnight were diluted with fresh YPD to a cell density (A600 nm) of ∼0.1 and regrown with agitation at 30 °C. The increase in cell density as a function of time was monitored by measuring A600 nm. Meanwhile, fresh cultured cells at A600 nm ∼0.3 were serially diluted in 10-folds steps, and 3 μl of each diluted cell sample was spotted on an agar plate containing normal YPD medium, YPG medium (using glycerol as the only carbon source instead of dextrose in YPD), or YPD medium with either 0.5 or 0.9 m NaCl. The culture plates were allowed to grow either at 30 or 37 °C for 72 h. The results were documented by scanning with a commercial scanner. Each experiment was repeated twice with virtually identical outcomes.
Cytology
The actin cytoskeletal pattern and the morphology of mitochondria and nuclei were monitored as described previously with minor modifications (30, 31). Briefly, cells were cultured with agitation to early log phase in YPD medium. Cells were formaldehyde-fixed and stained with Texas Red-phalloidin (Invitrogen) for observation of the actin cytoskeleton. Furthermore, live cells expressing citrate synthase-GFP were cultured in synthetic medium for observing mitochondrial morphology as described (32). Finally, cells cultured overnight were alcohol-fixed and stained with DAPI for observation of DNA localization. An Olympus IX81 inverted microscope with a PlanApo 60× 1.45 oil immersion TIRF2 lens and Hamamatsu ORCA-R2 camera were used to record the fluorescence images. The images of the actin cytoskeleton, mitochondria, and DNA distribution from 20 z-sections obtained at 0.2-μm intervals through the entire cell were first deconvoluted and then stacked to generate a two-dimensional image.
We established the normal pattern for the actin cytoskeleton by counting budding cells in which the size of the bud was less than one-third the size of the mother cells when there is maximum asymmetry of patch distribution and the greatest degree of polarization of actin cables. Because mitochondria were observed as long branched tubular structures, we classified mitochondria where the images coalesced in a globular shape as aggregated and mitochondria with short and isolated segments as fragmented. All cellular statistical analyses were based on cell counts of more than 100 for each sample.
Protein Preparation
Y79S yeast profilin was generated as described above and expressed in Escherichia coli BL21. The His-tagged Bni1 yeast formin FH1-FH2 C-terminal fragment was expressed in and purified from S. cerevisiae strain (BDY502) as described (33, 34). All profilins were purified by polyproline affinity chromatography (poly-l-proline from Sigma), conjugated on Affi-Gel 10 resin from Bio-Rad, and subjected to DE52 ionic exchange chromatography (Whatman) as described in Wen et al. (27). The concentration of profilin was determined by measuring A280 nm using ϵ280 nm = 20,300 m−1 cm−1 (27). WT and A167E actins were purified from either yeast cakes purchased from a local bakery store or laboratory-cultured cells, respectively, with DNase I affinity chromatography (DNase I (Grade D) from Worthington was conjugated to Affi-Gel 10), DE52 anion exchange chromatography, and polymerization/depolymerization cycling as described previously (27). The concentration of the globular actins (G-actins) was determined by measuring A290 nm using ϵ290 nm = 25,600 m−1 cm−1, and the actin was stored in G buffer (10 mm Tris-HCl, pH 7.5, 0.2 mm CaCl2, 0.1 mm ATP, and 0.1 mm DTT) at 4 °C for no more than 4 days. Covalent attachment of N-(1-pyrenyl)maleimide (Sigma) to actins at Cys374 (pyrene-actin) was performed as described in Feng et al. (35).
In Vitro Assays of Actin and Profilin Functions
Thermal Stability of Profilins
A 3 μm profilin sample in G buffer was placed in an AVIV 62DS spectropolarimeter with a thermostated cuvette chamber. The sample was heated at a constant rate of 1 °C/min from 25 to 85 °C with constant stirring, and the change in ellipticity was monitored at 222 nm as a function of increasing temperature. Data were normalized as the fraction of native protein based on the net change in ellipticity and then fitted to a two-state protein denaturation model (36) using Excel. The apparent Tm was defined as the temperature at which 50% of the net change in ellipticity was attained. All the measurements were repeated twice with identical results.
Actin-bound ϵATP Exchange
To study nucleotide exchange, ϵATP-bound actin was prepared as described in Wen et al. (27) and used within 1 day. A 1 μm ϵATP G-actin solution either alone or with 15 μm profilin in ATP-free G buffer at 25 °C was added to 50 μm ATP with gentle agitation. The fluorescence change due to the release of bound ϵATP was recorded with a Fluorolog-3 (Jobin Yvon Inc., Edison, NJ) fluorescence spectrometer equipped with a thermostated cuvette chamber using excitation and emission wavelengths of 340 and 410 nm, respectively. The rate constant (k) for ϵATP release was obtained by fitting the fluorescence decrease curves with a first-order reaction equation using Biokine (Bio-Logic SA, Claix, France). The t½ was then calculated by the following equation: t½ = 0.693/k. The experiments were repeated at least twice with similar results.
Isothermal Titration Calorimetry (ITC)
ITC measurements were performed using a VP-ITC calorimeter (MicroCal, Northampton, MA) similarly to the procedure described in Wen et al. (27) with modifications. Briefly, titrations were performed in 2 mm PIPES, pH 7.5, 0.2 mm ATP, 0.2 mm CaCl2, and 1 mm DTT with a constant 20 μm G-actin and varying profilin concentration at 25 °C. Heats of dilution were calculated by averaging the last three to five injections and then were subtracted from the raw data. The data sets were then analyzed individually using a single site binding model from the ORIGIN ITC analysis software package provided by the VP-ITC calorimeter manufacturer. In this analysis, the values for stoichiometry (n), change in enthalpy (ΔH), affinity constant Ka, and ΔS were obtained using non-linear least squares analysis of the curves generated. The reported values for n, ΔH, and Ka are the average and S.D. of all injections for an individual interaction. The Kd values in Table 1 were obtained by simply inverting the Ka value, and TΔS was calculated by multiplying the ΔS value by 298 K. Each individual binding experiment was repeated twice with similar results.
TABLE 1.
Thermodynamic parameters obtained by ITC for interaction of WT and mutant profilin with actins
Hydrogen-Deuterium Exchange Analyzed by Mass Spectrometry
Hydrogen-deuterium exchange analyzed by mass spectrometry was performed as described previously (37). Briefly, 40 μm G-actin was diluted 16-fold in deuterated G buffer at room temperature to start the exchange reaction. Aliquots (300 pmol of protein) were taken at specific time points, mixed with 100 mm potassium phosphate buffer, pH 2.5 to quench the reaction, and stored at −80 °C for less than 1 day. The labeled proteins were digested on a pepsin column made in house. The digested peptide products were desalted on a peptide macrotrap (Michrom Bioresources, Inc.) and then separated on a Jupiter Proteo C12 column. The masses of individual peptides were determined on an LCQ Deca mass spectrometer (Thermo Scientific, Waltham, MA) in the University of Iowa High Resolution Mass Spectrometry Facility. Mass spectra were analyzed with Bioworks Browser and Xcalibur Qual Browser (Thermo Scientific) to identify the peptides. The centroid mass of the peaks was determined with MagTran (38) and plotted as a function of time. Data were not adjusted for back-exchange, and therefore all changes in masses were reported as uncorrected changes. The experiments were repeated at least twice with similar results. The differences in hydrogen-deuterium exchange of identical peptides between experimental and control samples were determined, and the extents are displayed in Table 3.
TABLE 3.
Summary of hydrogen-deuterium exchange peptides with identical primary sequence from WT and A167E actins
| Peptide | Percent exchangea |
Difference | |
|---|---|---|---|
| 167E actin | WT actin | ||
| 8–31 (22) | 15 ± 0.6b | 15 ± 1 | 0 |
| 32–44 (10) | 40 ± 5 | 55 ± 2 | −15 |
| 95–104 (7) | 19 ± 2 | 28 ± 1 | −9 |
| 124–132 (7) | 5 ± 1 | 8 ± 2 | −3 |
| 143–153 (10) | 21 ± 4 | 32 ± 5 | −11 |
| 154–168 (13) | 12 | 18 | −6 |
| 154–176 (20) | 10 ± 3 | 22 ± 3 | −12 |
| 169–176 (6) | 19 | 33 | −14 |
| 177–189 (12) | 5.7 ± 0.4 | 8.9 ± 0.9 | −3.2 |
| 236–261 (23) | 28 ± 1 | 32 ± 3 | −4 |
| 284–299 (15) | 27 | 32.9 ± 0.8 | −5.9 |
| 326–340 (12) | 39 | 39 ± 2 | 0 |
| 347–355 (8) | 63 ± 2 | 62 ± 5 | 1 |
a Change in mass after 10 min was calculated as follows: change in mass = ml − mu where ml is the mass of peptide at 10 minutes of labeling and mu is the mass of unlabeled peptide. Positions of the peptides in the actin structure are represented in Fig. 7.
b ± indicates the S.D. when at least three runs were compared. In some cases, no S.D. is indicated. In one scenario, the value is averaged from two runs. Alternatively, the value is based on a single determination in which the peptide from one sample was compared with a similar related peptide from another sample differing in length by one amino acid.
Actin Polymerization
A sample with 5 μm 10% pyrene-G-actin alone or with profilin at various concentrations as described in Fig. 5 was induced to polymerize by the addition of MgCl2 and KCl to final concentrations of 2 and 50 mm, respectively. The subsequent change in fluorescence was recorded as a function of time. The polymerization assays were performed in a final volume of 120 μl in a microcuvette housed in a thermostated sample compartment of a FluoroMax-3 spectrometer (Jobin Yvon-Spex) using excitation and emission wavelengths of 365 and 385 nm, respectively. The experiments were repeated at least twice with similar results.
FIGURE 5.
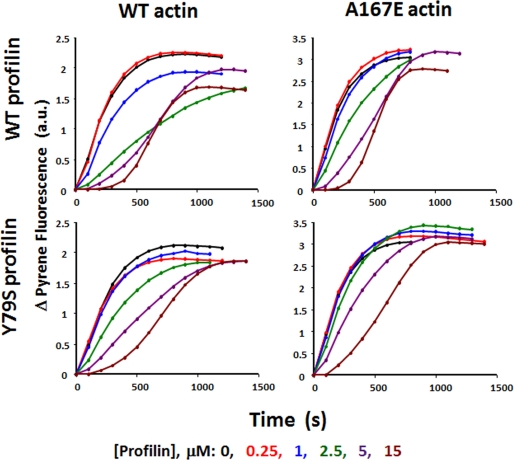
WT or A167E actin polymerization in presence of WT and mutant profilins. 5 μm 10% pyrene-labeled G-actin in the presence of various concentration of different profilins was induced to polymerize by the addition of salt. The polymerization-dependent increase in pyrene fluorescence was recorded with time as described under “Experimental Procedures.” a.u., absorbance units.
Tracking Tip Movement of Actin Cables by TIRF
We tracked actin cable ends visualized by binding of 3XGFP-ABP140 in a manner similar to that published previously by Yang and Pon (39) with modifications. We used early log phase cells co-expressing 3XGFP-tagged ABP140 and grown in YAPD (YPD rich medium plus 60 mg/liter adenine hemisulfate) medium. Movement of GFP-ABP140-marked cables was monitored using an Olympus TIRF microscope as described above. Serial TIRF images of each cell were recorded for 30 s at a rate of 0.15s/frame by Slidebook5 (3i Inc., Denver, Co.). We observed two similarly sized populations of actin cables. In one, the cables were stationary with no observable extension of cable tips. In the second, cable tips moved with a variety of rates. These movements were captured digitally, the images were traced, the rates of cable tips were determined from the tracings using the NIH ImageJ Manual Tracker plug-in, and data were analyzed by Excel. At least 100 cables exhibiting liner movement from at least 10 single cells of each strain studied in this report were analyzed.
RESULTS
The focus of our study was to use site-directed mutagenesis to examine our hypothesis that alterations in steric packing within the actin-profilin interface could differentially affect the influence of profilin on actin behavior. To guide our work, we first constructed a depiction of this interface based on a previously published model of the corresponding interface between human β-actin and bovine profilin as described by Schutt et al. (15) and Eads et al. (4). We used PyMOL software (Version 1.3, Schrödinger, LLC.) and replaced the structure of β-actin with that of yeast actin (Protein Data Bank code 1YAG) and that of bovine profilin with the structure of yeast profilin (Protein Data Bank code 1YPR). Conversion of Ala167 to Glu led to a significant increase the in van der Waals contact with profilin Arg81 (Fig. 1C) compared with the case of WT yeast actin (Fig. 1B). Such packing might create strain that would be transmitted to the actin nucleotide cleft, possibly altering cleft dynamics and actin conformation. These changes in actin dynamics might well lead to the altered yeast growth behavior we observed previously (29).
Effects of Y79S Profilin on Growth of Cells Expressing WT or A167E Actin
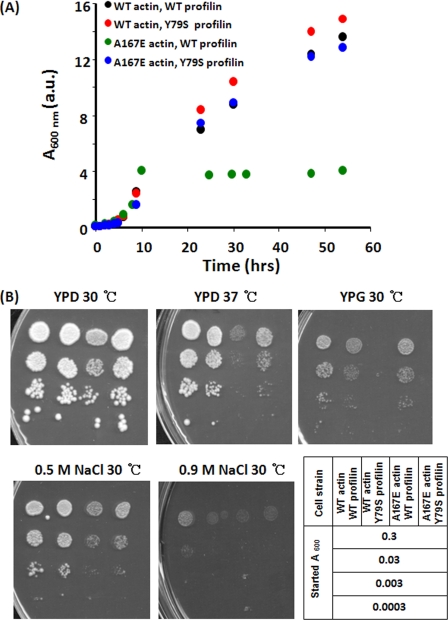
To test our hypothesis, we replaced WT profilin with Y79S profilin to diminish packing effects within the clamp caused by the actin A167E mutation. For cells with WT actin grown in liquid YPD, Y79S profilin caused little if any phenotype (Fig. 2A). The same results (Fig. 2B) were obtained following exposure of the cells to hyperthermic stress or growth on glycerol to test for mitochondrial function. Finally, hyperosmolar stress (0.9 m NaCl) caused growth retardation in the Y79S cells. We obtained a very surprising result, however, when we assessed the effects of Y79S profilin in an A167E actin background. We previously demonstrated (29) and reconfirmed here that the A167E mutation leads to early growth arrest in rich liquid medium and prevents growth on glycerol. However, as seen in Fig. 2A, substitution of Y79S profilin alone for WT profilin in these mutant actin cells resulted in rescue of growth to essentially normal levels in liquid YPD. It also restored the ability of the cell to grow on glycerol and to grow at elevated temperature (Fig. 2B). It did rescue growth in moderately hyperosmolar medium (0.5 m NaCl), but it did not restore growth in 0.9 m NaCl. Thus, a strain-relieving profilin mutation largely overcomes the effect of the A167E W-loop alteration, underscoring the importance of the profilin-actin complex in cytoskeletal function and the regulation of the interface of this complex by steric packing.
FIGURE 2.
Effect of Y79S profilin on growth of cells expressing either WT or A167E actin. A, cells cultured overnight were diluted and grown in YPD medium with constant agitation at 30 °C, and cell growth was monitored by the increase in A600 nm over time. B, an overnight culture was serially diluted in 10-fold steps. 3 μl of each dilution was spotted on agar plates under different culture conditions as described, and the plates were incubated for 72 h. a.u., absorbance units.
Cytological Assessment of Y79S Profilin Substitution
Based on phalloidin staining of fixed cells, Y79S profilin had little if any effect on cells containing WT yeast actin in terms of polarized cables and endocytic patches (supplemental Fig. S1). Supplemental Fig. S1 also shows that the A167E mutation alone led to only about 25% of the cells with a decidedly abnormal actin cytoskeletal morphology, and this number was unchanged in the presence of Y79S profilin.
The Y79S profilin exerted striking effects in terms of rescuing the mitochondrial phenotype associated with the A167E actin mutation. Mitochondrial integrity, movement, and inheritance are associated with actin cytoskeletal function in S. cerevisiae (32, 40, 41). We assessed mitochondrial morphology in vivo by observing the fluorescence of a GFP-tagged citrate synthase mitochondrial targeting peptide as described (32). The results are shown in supplemental Fig. S2. In WT cells, mitochondria appear as an array of tubular structures, which generally are in a loosely polar pattern extending from the mother cell to the bud. With Y79S profilin, there appears to be a small amount of aggregation of these structures. In A167E cells, there is a much greater degree of aggregation of these tubules, affecting about 80% of the cells, and another small component where these structures appear fragmented, corresponding to the failure of the cells to grow on glycerol as a sole carbon source. Introduction of Y79S profilin into A167E cells substantially reverted this phenotype to a much more normal morphology (80% of the cells) commensurate with restoration of the ability to grow on glycerol.
Another assessment of mitochondrial integrity is through visualization of the mitochondrial genome via DAPI staining. In this setting, mitochondrial DNA appears as small extrachromosomal spots apart from the large stained nucleus in each cell. As seen in supplemental Fig. S3, nuclei appear as single spots in all of our strains tested here. Extrachromosomal mitochondrial spots are present in WT cells and in WT cells carrying Y79S profilin. In A167E cells, these spots are missing, indicating an absence of intact mitochondrial DNA. Introduction of Y79S profilin restored DNA integrity to these cells again in line with recovery of mitochondrial function.
Effect of Y79S Profilin on Growth of Cells Expressing H372R Actin
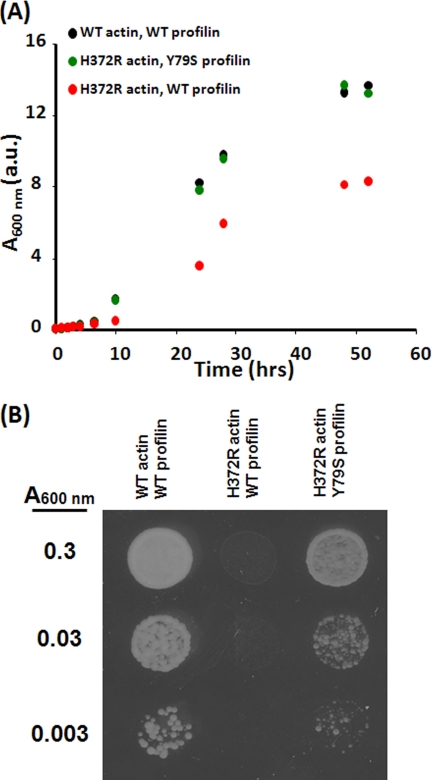
We proposed in the Introduction that actin residues 167 and 372 formed a clamp around an antiparallel β-pleated sheet segment in profilin, resulting in the formation of a conduit between the front and rear faces of actin. In earlier work involving the creation of a yeast-muscle hybrid actin, we demonstrated that the H372R mutation created a phenotype in vivo much like that we observed with the A167E mutation (28). Molecular modeling suggested that this increased bulk from the arginine would create the same propagated packing within the clamp as would the A167E mutation (Fig. 1). If so, the phenotype might also be rescued with the profilin Y79S mutation. We thus introduced the Y79S profilin into cells expressing H372R actin. This combination restored growth of the mutant actin cells in liquid YPD medium to near normal rates (Fig. 3), and it rescued the deleterious effects of the actin mutation on growth under stress conditions as well. These results further validate our hypothesis that the degree of packing within this profilin-actin interface extending from residue 167 to the rear of the protein near residue 372 can modulate profilin activity toward actin.
FIGURE 3.
Effect of Y79S profilin on growth of cells expressing H372R actin. A, diluted overnight cultures were grown in YPD medium with constant agitation at 30 °C, and the growth of each strain was monitored by the increase in A600 nm over time. B, cells cultured overnight were further diluted as indicated on the left. 3 μl of each diluted culture was spotted on a YPG agar plate, which was then incubated for 72 h at 30 °C. a.u., absorbance units.
Effects of Profilin Mutations on WT and A167E Actin Dynamics in Vitro
We then set out to elucidate the biochemical basis of the rescue provided by Y79S profilin from the perspective of the mutant A167E actin. As a first step, we assessed the effects of Y79S mutation on the integrity of recombinant profilin made in E. coli. We determined the thermal stability of the profilin by observing the molar ellipticity at 222 nm as a function of increasing temperature (6). The apparent Tm (or temperature at which half of the protein was denatured) was 71 and 65 °C for the WT and Y79S profilins, respectively, indicating a less tightly constrained conformation for the mutant protein.
We next determined the effect of the Y79S mutation on the ability of profilin to bind to WT and A167E actins using isothermal titration calorimetry to determine the binding constants (4, 27). Table 1 shows that for a given profilin the affinity for either WT or mutant actin was about the same. However, the affinity of WT profilin for a given actin was about 3× tighter than the affinity of Y79S profilin.
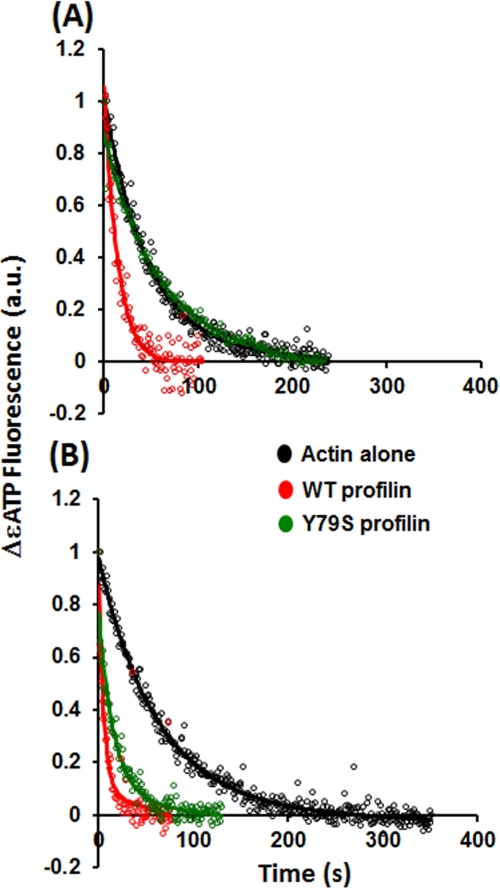
A distinguishing feature of non-plant profilins in vitro is the ability to increase the rate of exchange of actin-bound nucleotide in vitro. Based on genetic evidence, Wolven et al. (43) argued for the importance of profilin facilitation of actin nucleotide exchange for yeast well being. We thus determined the ability of Y79S profilin to facilitate the exchange of bound fluorescent ϵ-ATP from WT actin in the presence of a large excess of ATP. Saturating concentrations of profilin were used. Fig. 4 and Table 2 demonstrate that WT profilin accelerated nucleotide exchange from WT actin about 2–3-fold consistent with previous studies (4, 27). However, Y79S profilin showed no effect on nucleotide exchange from WT actin despite being able to bind to it even though in vivo it caused no adverse phenotype under normal growth conditions. This result is in contrast to the assertion of Wolven et al. (43). With A167E actin, however, the results were quite different. WT profilin, as shown in Fig. 4B and Table 2, accelerated this exchange rate about 5-fold, showing an increased response of the mutant actin to profilin compared with WT actin. This increased ability to accelerate nucleotide exchange may result from propagation of strain at the actin-profilin interface into the nucleotide cleft, resulting in an opening or loosening of the nucleotide-binding site. Interestingly, Y79S profilin did accelerate nucleotide exchange from A167E actin about 2× even though it was inactive against WT actin. These results suggest that complementing mutations between the actin and profilin as suggested by our steric packing hypothesis form a more functionally normal actin-profilin interface at least with respect to proper mitochondrial behavior.
FIGURE 4.
Effect of mutant profilin on actin-bound ϵATP exchange. 1 μm of ϵATP WT (A) or A167E (B) G-actin was mixed with 10 μm WT or mutant profilin. The release of actin-bound ϵATP was induced by the addition of free ATP at a final concentration of 50 μm, and the decrease in the ϵATP fluorescence intensity was recorded by a Fluorolog-3 fluorescence spectrometer as described under “Experimental Procedures.” The solid lines are the exponential fits of the experimental data. a.u., absorbance units.
TABLE 2.
Effects of mutant profilin on actin-bound ϵ-ATP exchange rate of either WT or A167E G-actin
|
t½ |
||
|---|---|---|
| WT actin | A167E actin | |
| s | ||
| No profilin | 38.5 ± 1 | 42 ± 3 |
| WT profilin | 14.5 ± 1.6 | 8 ± 2.1 |
| Y79S profilin | 35 ± 3 | 25 ± 1.1 |
Through its ability to sequester actin monomers, profilin can inhibit nucleation of actin polymerization, but it does not inhibit filament elongation (44). Fig. 5 demonstrates that WT profilin alters the polymerization of both WT and A167E actins in a concentration-dependent fashion. As the profilin concentration increases, so does the lag time for the onset of nucleation, although the result is more pronounced in the case of WT actin. Comparable results were observed with the effects of Y79S profilin on the polymerization of WT and A167E actins. In these studies, the lack of effect of mutant profilin on the extent of polymerization of a given actin indicated no significant profilin-dependent alteration of critical concentration for polymerization. Furthermore, for a given actin at saturating profilin concentration, the similar slopes in the elongation phase are consistent with a lack of effect of the profilin on elongation rate. At maximum WT profilin concentration, the elongation rate ratio for WT:A167E actin is 1:1.4. For Y79S profilin, the ratio is 1:1.2. These differences cannot be explained by alterations in the Kd for the binding of different profilins to actin because profilin was saturating at the higher concentrations used.
The pyrene fluorescence change due to the polymerization of A167E actin was about 1.3× higher than that observed with WT actin (Fig. 5 and supplemental Fig. S4) despite the fact that light scattering results showed that A167E actin has a critical concentration similar to that of WT actin (29). C-terminal pyrene fluorescence is believed to be influenced by the monomer-monomer interface involving the C-terminal actin peptide. Thus, this enhanced fluorescence with the mutant suggests that the A167E mutation induces a change in conformation of F-actin structure, potentially explaining the differences observed with the different actins on profilin activity.
Hydrogen-Deuterium Exchange Analysis of Effects of A167E Mutation on Actin Conformation
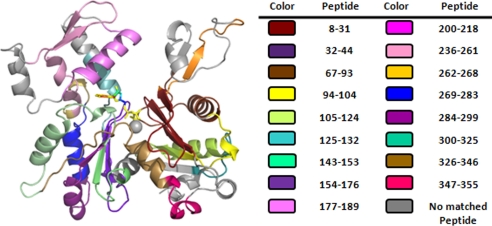
We wished to gain insight into the molecular basis for the changes in actin behavior caused by the A167E mutation in vivo and in vitro. Toward this goal, we analyzed the effects of the mutation on actin conformation by looking for differences in hydrogen-deuterium exchange of backbone amide protons assessed by mass spectrometry. A map of the actin peptides used for the comparison is shown in Fig. 6.
FIGURE 6.
Maps of specific peptides used in comparison of hydrogen-deuterium exchange between WT and A167E actin. The peptides fragments with specific sequences are highlighted by different colors, and the peptide numbering and corresponding color are in the tables on the right.
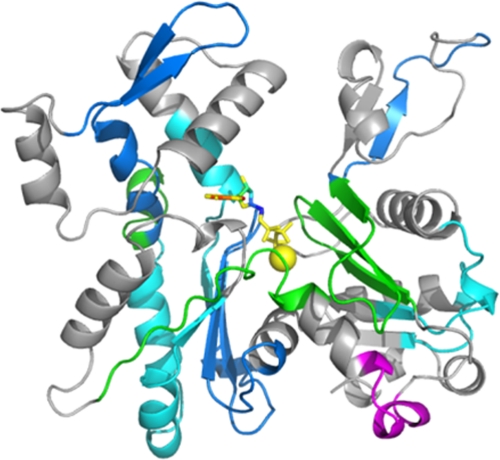
The results (Fig. 7 and Table 3) demonstrate that the A167E switch resulted in a general compaction of the entire protein as indicated by a decrease in the extent of exchange rate across a large part of the actin. This result is consistent with the decreased mutant ϵATP exchange rate relative to WT actin that we documented previously (29) and have included in Fig. 4 and Table 2.
FIGURE 7.
Effects of A167E mutation on G-actin polypeptide backbone hydrogen-deuterium exchange detected by mass spectrometry. Samples of actin were placed in deuterated solvent, and aliquots were withdrawn over time. Following acid quenching of the exchange reaction, the proteins were digested on a pepsin column, and the resulting peptides were analyzed by mass spectrometry as described under “Experimental Procedures.” The color scheme shown represents the difference in extent of hydrogen-deuterium exchange between the A167E and WT G-actins using the data displayed in Table 3. Red and magenta signify extents of exchange between mutant and WT actin, noted as Δ, of at least 1 Da (Δ ≥1 Da) and between 0.1 and 1 Da (0.1 < Δ <1 Da), respectively. Green signifies exchange between 0.1 and −0.1 Da (−0.1≤ Δ ≤0.1 Da) in mutant compared with WT actin, which we take as equal exchange between the two samples. Blue and cyan signify decreased exchange of more than 1 Da (Δ ≤−1 Da) or between 1 and 0.1 Da (−1< Δ <−0.1 Da) in the mutant compared with WT actin, respectively. Gray indicates that the peptide was not detected in one or the other of the samples. The actin structural model used is Protein Data Bank code 1YAG.
We attempted to assess the effects of the WT and mutant profilins on the actin hydrogen-deuterium exchange pattern. However, the large amount of profilin we needed to include to ensure saturable binding prevented detection of many of the actin peptides. This result prevented us from making a meaningful comparison of the effects of the two profilins on actin conformation.
Effect of Actin A167E Mutation on Interaction of Profilin-Actin Complex with Formin
One possibility for the origin of the A167E phenotype and its rescue by a mutant profilin is an effect of the actin mutation on the actin-formin interaction. To test this possibility, we utilized the FH1-FH2 C-terminal fragment of the yeast formin Bni1.
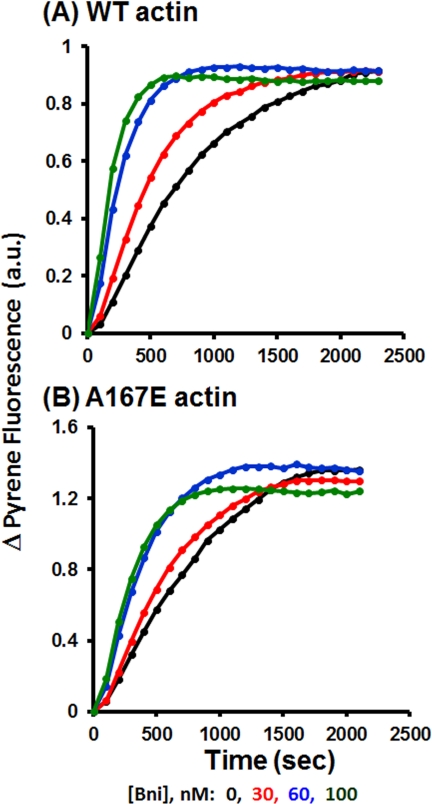
Fig. 8 shows that the polymerization of both WT and A167E actin can be accelerated in a dose-dependent fashion by increasing amounts of the Bni1 fragment and that the extent of polymerization is about the same for both actins. However, the time required for the polymerization to reach steady state is longer for mutant than for the WT actin at both 60 and 100 nm Bni1 concentrations. This result suggests that the A167E mutation at the barbed end of the protein altered somewhat the nature of the actin-formin interaction.
FIGURE 8.
In vitro actin polymerization in presence of Bni1 formin FH1-FH2 fragment. 2 μm 10% pyrene-labeled WT or A167E actin was induced to polymerize by the addition of salt (as described under “Experimental Procedures”) in the presence of various concentrations of the Bni1 FH1-FH2 fragment as described in the figure. The polymerization-dependent increase in pyrene fluorescence was recorded with time as described under “Experimental Procedures.” This is an example of one of two repeats, each with essentially the same results. a.u., absorbance units.
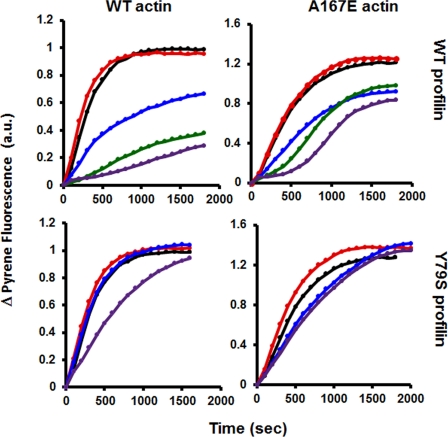
We next determined the effect of adding either WT or Y79S profilin to polymerizing mixtures containing Bni1 fragment and either WT or mutant actin. Fig. 9 shows that with WT profilin and WT actin there appears to be initially a small stimulation of polymerization. This is followed by a nest of hyperbolic curves showing increasing inhibition as profilin concentration increases. With A167E actin, the result was clearly different. At the higher profilin concentrations, the polymerization curves became much more sigmoidal, increasing very rapidly after a shortened initial lag phase.
FIGURE 9.
Effect of profilin on Bni1-dependent actin polymerization. 2 μm 10% pyrene-labeled WT or A167E actin, 30 nm Bni1 FH1-FH2 fragment, and various concentrations of either WT or Y79S profilin as indicated were mixed and subjected to salt-induced polymerization as described above. The polymerization-dependent increase in pyrene fluorescence was recorded with time as described under “Experimental Procedures.” This is an example of one of two repeats, each with essentially the same results. a.u., absorbance units.
We then substituted Y79S profilin, which rescues the A167E phenotype. Both with WT and A167E actins, the family of polymerization curves generated were markedly similar, and the times required to reach steady state are very close for both actins at the highest profilin concentrations. In both cases, the inhibition associated with increasing profilin was greatly decreased compared with WT profilin results. The sigmoidal nature of the A167E curves seen with WT profilin was converted to more of a hyperbolic curve. Finally, the residual inhibition observed was slightly greater with the mutant than with the WT actin.
Effects of Actin and Profilin Mutations on Actin Cable Dynamics in Vivo
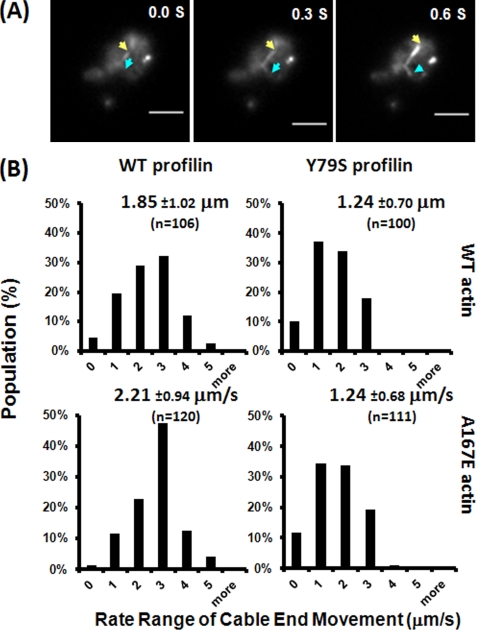
Our profilin-actin-formin results in vitro led us to explore the effect of these mutations on actin cable dynamics in the cell because cable behavior is associated with formin function (45). We observed actin cables in living cells by following the binding of the fluorescent cable-binding protein GFP-ABP140 and quantitating cable tip behavior as a function of time. Fig. 10 shows that with WT profilin A167E cable ends were distinctly more dynamic than were those of WT actin in terms of average movement. In cells with Y79S profilin, the movements for both actins were significantly slowed.
FIGURE 10.
Actin cable end movement in vivo. A, the end movement of actin cables in early log phase cells grown in YAPD medium was followed by using GPF-tagged ABP140 as the probe and recorded with TIRF microscopy at a rate of 0.15 s/frame for 30 s. The yellow and blue arrows point to the moving tips of two actin cables with the time indicated on the top right corner of each image. B, the rate of movement of individual actin cable ends was measured by ImageJ as described under “Experimental Procedures.” n shows the number of cables from at least 10 different single cells from each line measured. The population distribution and the average rate of movement were derived from analysis of the data by Excel. Each number on the x axis represents a range of rates; for example, 1 represents rates between 1 and 2 μm/s. The error estimates are standard deviations.
With WT actin/WT profilin cells, we saw a broad distribution of rates of cable end movement for individual filaments. About 50% of these rates were in the 1–3 μm/s range. With A167E actin, there was a shift in the distribution to faster rates of movement so that only about 30% of the rates were in this range. Substitution of Y79S profilin resulted in increasing the population of the 1–3 μm/s group for both WT and mutant actins such that the distributions for each were virtually overlapping. This result is consistent with the rescue of the A167E growth phenotype we observed with the Y79S profilin. It also correlates with the effect of Y79S in restoring a more normal behavior in our in vitro assays involving formin and profilin.
DISCUSSION
Our results are to a large extent consistent with our hypothesis concerning altered steric packing in the profilin-actin interface. They also provide insight into the relative contribution of the different activities of profilin within the budding yeast cell and the basis for their regulation.
We initially focused on residue 167. The side chain of this residue faces away from the protein body (Fig. 1), and one might not expect that it would have a substantial influence on overall G-actin conformation. However, hydrogen-deuterium exchange results demonstrate that the A167E mutation causes conformational changes extending from the W-loop to the top of subdomains 2 and 4 at the pointed end of the protein. The W-loop is conformationally and functionally connected to the nucleotide-binding site (17, 18). Our results showing the effects of the actin mutation on C-terminal F-actin fluorescence are consistent with the idea that W-loop alterations affect the conformation of the filament. Consistent with this hypothesis is the observation that two other loop mutations at residues 169 and 170 also lead to filament instability (18).
One possible explanation for our observed specificity of rescue by profilin may lie in how the profilin interacts with the W-loop. Most barbed end actin-binding proteins bind to the front face of the hydrophobic hot spot above the W-loop, whereas only profilin seems to bind to the rear face of the protein in this region (19). An altered actin-profilin interaction caused by the A167E loop mutation could result in a specific set of propagated conformational changes throughout the actin molecule, possibly explaining the profilin-dependent effects on actin polymerization kinetics alone or in conjunction with other proteins.
This conformational linkage may also provide insight into the problem articulated by Vavylonis et al. (46). Based on kinetics simulations, they concluded that the off-rate of profilin from actin is 400-fold too slow to account for the formin-dependent actin filament elongation rates observed in the presence of profilin. If there are reciprocal effects of profilin on the G-actin pointed end, interaction of the formin-actin filament complex with a newly added G-actin bound to profilin could affect the profilin actin interface. The result might well lead to the accelerated profilin release needed to explain the polymerization rates they observed. Unfortunately, technical difficulties arising from the inclusion of large amounts of mutant and WT profilin in our hydrogen-deuterium studies prevented us from obtaining comparative evidence for such structural changes in the interaction of the WT and mutant profilins with the WT and mutant actins.
Amazingly, considering the number of proteins that interact with this loop, the adverse phenotype associated with this mutation could largely be rescued by a mutation in yeast profilin in which substitution of a smaller residue at Tyr79, Ser, compensated for the larger mass of the actin A167E substitution. This result leads to two important conclusions. First, it demonstrates that of all the possible involvements of the W-loop outlined above its proper interaction with profilin is critical for cell well being. Second, it demonstrates the sensitivity of steric packing in this interface in governing the actin-profilin interaction.
An earlier study based on indirect genetic evidence suggested that the ability of profilin to facilitate actin nucleotide exchange was important in S. cerevisiae (43). However, our results suggest that in S. cerevisiae enhancement of nucleotide exchange from actin is not a critical role of profilin. Plant profilins do not catalyze nucleotide exchange either from muscle actin (5, 47) or from yeast actin.3 It has also been shown that plant profilins will rescue a profilin-deficient phenotype in yeast, although the nature and the extent of the rescue were not fully reported (48), consistent with our Y79S profilin results. S. cerevisiae actin with a 10–15-fold greater rate of nucleotide exchange than actins in higher eukaryotic cells is very conformationally dynamic (27). Possibly, in yeast, the additional enhancement of nucleotide exchange provided by profilin is not essential. Ti and Pollard (49) have recently demonstrated that profilin from the fission yeast Schizosaccharomyces pombe does not accelerate nucleotide exchange from S. pombe actin, also a very dynamic actin isoform, in agreement with our own results.
We demonstrated that altered actin nucleotide exchange or direct effects of profilin on actin polymerization were probably not responsible for the A167E mitochondrial phenotype or its rescue by Y79S profilin. These results together indicated that perhaps the actin A167E mutation altered the interaction of formin with either actin or the actin-profilin complex. Our results show that polymerization of A167E actin is somewhat less sensitive than WT actin to stimulation by the formin Bni1 FH1-FH2 fragment. The small extent of the effect again suggested that it was not the cause of the in vivo phenotype.
Importantly, we saw a much more striking formin-dependent difference in the presence of profilin. In an actin-profilin-formin polymerization system, there is both formin-independent and -dependent actin polymerization. First, profilin can act as a G-actin-sequestering agent, thereby making less actin available for formin-independent polymerization. Second, profilin as part of the actin-profilin complex coupled with its ability to interact with the formin FH1 site can accelerate formin-dependent actin polymerization. Whether recruitment of the profilin simply raises the local concentration of actin available for formin or whether the profilin actually causes an actin conformation change enabling formin to better incorporate it has not been established. Another complication is that at higher profilin:actin ratios, the binding of profilin alone to the formin FH1 region can compete for binding of the actin-profilin complex and slow down polymerization (46).
In our experiments, higher concentrations of WT profilin led to a shortened lag phase and faster polymerization of A167E actin than seen with WT actin. In essence, in this coupled system with formin, the A167E change behaves like a gain-of-function mutation, suggesting that the altered actin allows greater accessibility of the profilin-actin complex to the formin-bound barbed end. This result is also consistent with an increased ability of the formin at the filament barbed end to discriminate in favor of the profilin-actin complex over profilin alone. Substitution of Y79S profilin, although enhancing polymerization of both actins, largely eliminates these kinetic differences consistent with the phenotypic rescue observed in vivo. Importantly, our results argue against the simple idea of profilin increasing the local actin concentration through binding to the FH1 region. The actin-binding and polyproline-binding sites of profilin are not conformationally connected (50). Thus, the effects we observed are dependent on actin-profilin complex formation and probably affect the effects of profilin on actin conformation.
Our in vitro results suggest that the mutant proteins might affect formin-dependent actin cable behavior in vivo. Our in vivo data suggest that proper mitochondrial function depends somehow on a population of less dynamic cables that may be subject to the spatial constraints and regulation needed for proper mitochondrial interaction. The A167E mutation causes conversion of these slower cables to more dynamic cables possibly due to enhanced and less regulated formin activity in the presence of WT actin. Substitution of the compensating Y79S mutant profilin repopulates this slower moving population, producing a profile similar to that with WT actin, thereby allowing more normal mitochondrial function.
It had long been established that the actin cytoskeleton was necessary for mitochondrial integrity and function (51). Recent work has begun to identify important components in this regulatory system. Yeast Myo2 has also been shown to be necessary for mitochondrial movement (32, 53). Pon and co-workers (54) demonstrated that elimination of the formin Bni1 led to loss of actin cables and mitochondrial function. Our combined in vivo and in vitro results suggest that an altered actin-profilin interaction can perturb this formin-dependent mitochondrial regulatory system while cables are still present.
The adverse effect of the Y79S profilin on growth of WT actin cells in hyperosmolar medium and the failure of the combination of Y79S profilin and A167E actin to rescue the phenotype were very interesting. Either one or the other of the two yeast formins is necessary for cell growth in hyperosmolar medium, and formin has been shown to be part of the polarisome needed for restoration of polarity in cells grown in high salt (55). Profilin was not explicitly included in the polarisome model, but our results show that a profilin mutation might have a profound effect on the process. It is possible that in the context of the polarisome the Y79S profilin-actin complex is incapable of interacting productively with formin due to some type of steric constraint. However, growth in hyperosmolar medium also results in an altered cytosolic environment characterized by high intracellular glycerol concentrations (56). In this context, the adverse effects of Y79S profilin might stem from a formin-independent mode of action. A documented occurrence of such a mode is the involvement of profilin with Srv2 (42, 52). In summary, our work shows that judicious modification of the profilin-actin interface can be very useful in dissecting the various roles that profilin plays in actin regulation and the mechanisms governing these roles.
This work was supported, in whole or in part, by National Institutes of Health Grants GM33689 and DC8803 (to P. A. R.).

The on-line version of this article (available at http://www.jbc.org) contains supplemental Figs. S1–S4.
E. Stokasimov, K.-K. Wen, and P. A. Rubenstein, unpublished data.
- TIRF
- total internal reflection fluorescence
- G-actin
- globular actin
- ITC
- isothermal titration calorimetry
- YPD
- yeast extract-peptone-dextrose.
REFERENCES
- 1. Babcock G., Rubenstein P. A. (1993) Cell Motil. Cytoskeleton 24, 179–188 [DOI] [PubMed] [Google Scholar]
- 2. Pollard T. D., Blanchoin L., Mullins R. D. (2000) Annu. Rev. Biophys. Biomol. Struct. 29, 545–576 [DOI] [PubMed] [Google Scholar]
- 3. Yarmola E. G., Parikh S., Bubb M. R. (2001) J. Biol. Chem. 276, 45555–45563 [DOI] [PubMed] [Google Scholar]
- 4. Eads J. C., Mahoney N. M., Vorobiev S., Bresnick A. R., Wen K. K., Rubenstein P. A., Haarer B. K., Almo S. C. (1998) Biochemistry 37, 11171–11181 [DOI] [PubMed] [Google Scholar]
- 5. Kovar D. R., Yang P., Sale W. S., Drobak B. K., Staiger C. J. (2001) J. Cell Sci. 114, 4293–4305 [DOI] [PubMed] [Google Scholar]
- 6. Lu J., Pollard T. D. (2001) Mol. Biol. Cell 12, 1161–1175 [DOI] [PMC free article] [PubMed] [Google Scholar]
- 7. Mockrin S. C., Korn E. D. (1980) Biochemistry 19, 5359–5362 [DOI] [PubMed] [Google Scholar]
- 8. Perelroizen I., Didry D., Christensen H., Chua N. H., Carlier M. F. (1996) J. Biol. Chem. 271, 12302–12309 [DOI] [PubMed] [Google Scholar]
- 9. Pantaloni D., Carlier M. F. (1993) Cell 75, 1007–1014 [DOI] [PubMed] [Google Scholar]
- 10. Goldschmidt-Clermont P. J., Machesky L. M., Doberstein S. K., Pollard T. D. (1991) J. Cell Biol. 113, 1081–1089 [DOI] [PMC free article] [PubMed] [Google Scholar]
- 11. Kovar D. R., Harris E. S., Mahaffy R., Higgs H. N., Pollard T. D. (2006) Cell 124, 423–435 [DOI] [PubMed] [Google Scholar]
- 12. Baek K., Liu X., Ferron F., Shu S., Korn E. D., Dominguez R. (2008) Proc. Natl. Acad. Sci. U.S.A. 105, 11748–11753 [DOI] [PMC free article] [PubMed] [Google Scholar]
- 13. Cedergren-Zeppezauer E. S., Goonesekere N. C., Rozycki M. D., Myslik J. C., Dauter Z., Lindberg U., Schutt C. E. (1994) J. Mol. Biol. 240, 459–475 [DOI] [PubMed] [Google Scholar]
- 14. Chik J. K., Lindberg U., Schutt C. E. (1996) J. Mol. Biol. 263, 607–623 [DOI] [PubMed] [Google Scholar]
- 15. Schutt C. E., Myslik J. C., Rozycki M. D., Goonesekere N. C., Lindberg U. (1993) Nature 365, 810–816 [DOI] [PubMed] [Google Scholar]
- 16. Pollard T. D. (1986) J. Cell Biol. 103, 2747–2754 [DOI] [PMC free article] [PubMed] [Google Scholar]
- 17. Zheng X., Diraviyam K., Sept D. (2007) Biophys. J. 93, 1277–1283 [DOI] [PMC free article] [PubMed] [Google Scholar]
- 18. Kudryashov D. S., Grintsevich E. E., Rubenstein P. A., Reisler E. (2010) J. Biol. Chem. 285, 25591–25601 [DOI] [PMC free article] [PubMed] [Google Scholar]
- 19. Dominguez R. (2004) Trends Biochem. Sci. 29, 572–578 [DOI] [PubMed] [Google Scholar]
- 20. Grintsevich E. E., Benchaar S. A., Warshaviak D., Boontheung P., Halgand F., Whitelegge J. P., Faull K. F., Loo R. R., Sept D., Loo J. A., Reisler E. (2008) J. Mol. Biol. 377, 395–409 [DOI] [PMC free article] [PubMed] [Google Scholar]
- 21. Paavilainen V. O., Hellman M., Helfer E., Bovellan M., Annila A., Carlier M. F., Permi P., Lappalainen P. (2007) Proc. Natl. Acad. Sci. U.S.A. 104, 3113–3118 [DOI] [PMC free article] [PubMed] [Google Scholar]
- 22. Kim T., Cooper J. A., Sept D. (2010) J. Mol. Biol. 404, 794–802 [DOI] [PMC free article] [PubMed] [Google Scholar]
- 23. Otomo T., Tomchick D. R., Otomo C., Panchal S. C., Machius M., Rosen M. K. (2005) Nature 433, 488–494 [DOI] [PubMed] [Google Scholar]
- 24. Chereau D., Kerff F., Graceffa P., Grabarek Z., Langsetmo K., Dominguez R. (2005) Proc. Natl. Acad. Sci. U.S.A. 102, 16644–16649 [DOI] [PMC free article] [PubMed] [Google Scholar]
- 25. Greer C., Schekman R. (1982) Mol. Cell. Biol. 2, 1270–1278 [DOI] [PMC free article] [PubMed] [Google Scholar]
- 26. McKane M., Wen K. K., Meyer A., Rubenstein P. A. (2006) J. Biol. Chem. 281, 29916–29928 [DOI] [PubMed] [Google Scholar]
- 27. Wen K. K., McKane M., Houtman J. C., Rubenstein P. A. (2008) J. Biol. Chem. 283, 9444–9453 [DOI] [PMC free article] [PubMed] [Google Scholar]
- 28. McKane M., Wen K. K., Boldogh I. R., Ramcharan S., Pon L. A., Rubenstein P. A. (2005) J. Biol. Chem. 280, 36494–36501 [DOI] [PubMed] [Google Scholar]
- 29. Stokasimov E., McKane M., Rubenstein P. A. (2008) J. Biol. Chem. 283, 34844–34854 [DOI] [PMC free article] [PubMed] [Google Scholar]
- 30. Hill K. L., Catlett N. L., Weisman L. S. (1996) J. Cell Biol. 135, 1535–1549 [DOI] [PMC free article] [PubMed] [Google Scholar]
- 31. Pringle J. R., Preston R. A., Adams A. E., Stearns T., Drubin D. G., Haarer B. K., Jones E. W. (1989) Methods Cell Biol. 31, 357–435 [DOI] [PubMed] [Google Scholar]
- 32. Boldogh I. R., Fehrenbacher K. L., Yang H. C., Pon L. A. (2005) Gene 354, 28–36 [DOI] [PubMed] [Google Scholar]
- 33. Moseley J. B., Goode B. L. (2005) J. Biol. Chem. 280, 28023–28033 [DOI] [PubMed] [Google Scholar]
- 34. Wen K. K., Rubenstein P. A. (2009) J. Biol. Chem. 284, 16776–16783 [DOI] [PMC free article] [PubMed] [Google Scholar]
- 35. Feng L., Kim E., Lee W. L., Miller C. J., Kuang B., Reisler E., Rubenstein P. A. (1997) J. Biol. Chem. 272, 16829–16837 [DOI] [PubMed] [Google Scholar]
- 36. Santoro M. M., Bolen D. W. (1988) Biochemistry 27, 8063–8068 [DOI] [PubMed] [Google Scholar]
- 37. Stokasimov E., Rubenstein P. A. (2009) J. Biol. Chem. 284, 25421–25430 [DOI] [PMC free article] [PubMed] [Google Scholar]
- 38. Wang L., Pan H., Smith D. L. (2002) Mol. Cell. Proteomics 1, 132–138 [DOI] [PubMed] [Google Scholar]
- 39. Yang H. C., Pon L. A. (2002) Proc. Natl. Acad. Sci. U.S.A. 99, 751–756 [DOI] [PMC free article] [PubMed] [Google Scholar]
- 40. Frederick R. L., Shaw J. M. (2007) Traffic 8, 1668–1675 [DOI] [PMC free article] [PubMed] [Google Scholar]
- 41. Hales K. G. (2004) Mitochondrion 4, 285–308 [DOI] [PubMed] [Google Scholar]
- 42. Balcer H. I., Goodman A. L., Rodal A. A., Smith E., Kugler J., Heuser J. E., Goode B. L. (2003) Curr. Biol. 13, 2159–2169 [DOI] [PubMed] [Google Scholar]
- 43. Wolven A. K., Belmont L. D., Mahoney N. M., Almo S. C., Drubin D. G. (2000) J. Cell Biol. 150, 895–904 [DOI] [PMC free article] [PubMed] [Google Scholar]
- 44. Kang F., Laine R. O., Bubb M. R., Southwick F. S., Purich D. L. (1997) Biochemistry 36, 8384–8392 [DOI] [PubMed] [Google Scholar]
- 45. Chesarone M., Gould C. J., Moseley J. B., Goode B. L. (2009) Dev. Cell 16, 292–302 [DOI] [PMC free article] [PubMed] [Google Scholar]
- 46. Vavylonis D., Kovar D. R., O'Shaughnessy B., Pollard T. D. (2006) Mol. Cell 21, 455–466 [DOI] [PMC free article] [PubMed] [Google Scholar]
- 47. Stark B. C., Wen K. K., Allingham J. S., Rubenstein P. A., Lord M. (2011) J. Biol. Chem. 286, 30384–30392 [DOI] [PMC free article] [PubMed] [Google Scholar]
- 48. Christensen H. E., Ramachandran S., Tan C. T., Surana U., Dong C. H., Chua N. H. (1996) Plant J. 10, 269–279 [DOI] [PubMed] [Google Scholar]
- 49. Ti S. C., Pollard T. D. (2011) J. Biol. Chem. 286, 5784–5792 [DOI] [PMC free article] [PubMed] [Google Scholar]
- 50. Goode B. L., Eck M. J. (2007) Annu. Rev. Biochem. 76, 593–627 [DOI] [PubMed] [Google Scholar]
- 51. Boldogh I. R., Pon L. A. (2007) Trends Cell Biol. 17, 502–510 [DOI] [PubMed] [Google Scholar]
- 52. Bertling E., Quintero-Monzon O., Mattila P. K., Goode B. L., Lappalainen P. (2007) J. Cell Sci. 120, 1225–1234 [DOI] [PubMed] [Google Scholar]
- 53. Förtsch J., Hummel E., Krist M., Westermann B. (2011) J. Cell Biol. 194, 473–488 [DOI] [PMC free article] [PubMed] [Google Scholar]
- 54. Fehrenbacher K. L., Yang H. C., Gay A. C., Huckaba T. M., Pon L. A. (2004) Curr. Biol. 14, 1996–2004 [DOI] [PubMed] [Google Scholar]
- 55. Bettinger B. T., Clark M. G., Amberg D. C. (2007) Genetics 175, 1637–1648 [DOI] [PMC free article] [PubMed] [Google Scholar]
- 56. Blomberg A., Adler L. (1992) Adv. Microb. Physiol. 33, 145–212 [DOI] [PubMed] [Google Scholar]


