

Abstract
Recent experimental and modeling studies demonstrate the fine spatial scale, complex nature, and independent contribution of Ca2+ dynamics as a proarrhythmic factor in the heart. The mechanism of progression of cell-level Ca2+ instabilities, known as alternans, to tissue-level arrhythmias is not well understood. Because gap junction coupling dictates cardiac syncytial properties, we set out to elucidate its role in the spatiotemporal evolution of Ca2+ instabilities. We experimentally perturbed cellular coupling in cardiac syncytium in vitro. Coupling was quantified by fluorescence recovery after photobleaching, and related to function, including subtle fine-scale Ca2+ alternans, captured by optical mapping. Conduction velocity and threshold for alternans monotonically increased with coupling. Lower coupling enhanced Ca2+ alternans amplitude, but the spatial spread of early (<2 Hz) alternation was the greatest under intermediate (not low) coupling. This nonmonotonic relationship was closely matched by the percent of samples exhibiting large-scale alternans at higher pacing rates. Computer modeling corroborated these experimental findings for strong but not weak electromechanical (voltage-Ca2+) coupling, and offered mechanistic insight. In conclusion, using experimental and modeling approaches, we reveal a general mechanism for the spatial spread of subtle cellular Ca2+ alternans that relies on a combination of gap-junctional and voltage-Ca2+ coupling.
Introduction
Recent experimental evidence is increasingly supportive of the important role that intracellular Ca2+dynamics plays as an independent factor (1) in the development of diverse types of arrhythmias in inherited or acquired cardiac pathologies. Early intracellular Ca2+ instabilities, e.g., alternans, are now viewed as a prelude to the progression of life-threatening arrhythmias in heart failure (2), long QT syndrome type 2 (3), and in catecholaminergic polymorphic ventricular tachycardia (4,5).
Beat-to-beat alternans is a local (cell-level) phenomenon, revealed when a cell is stressed/driven at above a certain pacing rate. The origin of this rate-dependent dynamic instability has been traced to the steepness of the action potential duration (APD) restitution, if voltage (Vm) alternans are concerned (6), or to dynamic Ca2+ handling parameters, e.g., the steepness of Ca2+ release as a function of Ca2+ load (7) or a more elaborate set of conditions (8), if the source of instability lies with Ca2+. Inherent variability in cellular properties across the tissue is expected to result in a different threshold for alternans for each cell. Thus, seeds of early alternation can, in theory, form at relatively low rates, and graded alternans amplitude can be seen across different cells. Because of the syncytial properties of healthy cardiac myocardium, by virtue of cell-cell electrical coupling via gap junctions and its homogenizing effects, such isolated instabilities are likely to be suppressed for purely voltage-driven alternans, and the tissue is likely to become engaged in alternation only after a critical mass of cells reaches threshold. The effective wavelength for alternation (9) in such cases is large (on the cm-scale), determined by the high effective diffusion for voltage, Dv.
Instabilities (alternans) driven by intracellular Ca2+ cycling, on the other hand, can form spatially distinct patterns (10–12), due to the much slower effective diffusion for calcium, Dca. Considering the complexity brought about by the electromechanical coupling/feedback (i.e., Vm-Ca2+ coupling) in the heart through the Na/Ca exchanger and the L-type Ca2+ channels, it is unclear a priori to what degree can electrical diffusion (Dv, not Dca) act as a smoothing factor in the spatiotemporal evolution of local Ca2+ alternans, i.e., how does gap junction coupling influence the spread of early cell-level Ca2+ alternans?
Cellular coupling is not a parameter that factors directly into current general theories about alternans origin and evolution. Empirically, thus far it has been shown that 1), Ca2+ alternans can indeed form fine-scale spatial patterns even in intact hearts (10,12); a finding that has been corroborated by computer simulations (13,14), and 2), improved coupling may be alternans-suppressing and antiarrhythmic (15,16). Karma and colleagues (9) used a simplified amplitude equation for excitable tissue to analytically assess the effects of coupling—relating wavelength for alternans pattern formation to electrical diffusion (Dv) and APD. Yet, previously no clear relationship has been revealed (experimentally or theoretically) between intracellular Ca2+ instabilities and cell-cell (electrical) coupling.
In this work, we set out to dissect experimentally and computationally the role of electrical coupling in the spatiotemporal evolution of Ca2+ alternans at the multicellular level. We systematically varied and quantified coupling in a simplified in vitro model of a cardiac syncytium (neonatal rat cardiomyocyte culture) and used ultrahigh resolution optical mapping (capable of cell-level resolution over a cm-scale) and an alternans detection algorithm to trace experimentally the evolution of Ca2+ alternans. Computational modeling of diffusion of Ca2+ alternans was used to provide insight into the role of electrical coupling and reveal a general mechanism for their spatial spread.
Methods
A detailed description of the methods is available in the Supporting Material.
Cardiac syncytium in vitro
Primary cardiac cell culture was prepared as follows (17–20): The ventricles of the hearts of 3-day-old Sprague-Dawley rats were minced and placed in Hanks' balanced salt solution (GIBCO Invitrogen, Carlsbad, CA). Enzymatic digestion was applied using trypsin (1 mg/ml, 4°C overnight; US Biochemicals, Cleveland, OH), and then collagenase (1 mg/ml, 37°C; Worthington Biomedical, Lakewood, NJ). Two-step preplating (90 min) was used to eliminate fibroblasts. The cardiomyocytes were seeded on fibronectin-coated surfaces at a high density (0.4 × 10⁶ cells/cm2) and kept in M199 culture medium (GIBCO) with 10% fetal bovine serum at 37°C in 5% CO2. Surfaces were made of polydimethylsiloxane molded using metal templates. After day 2 cells were switched to culture medium with 2% serum and changed every other day.
Perturbation of cell-cell coupling and Na+ ion channels
Reduction in cellular coupling was done by acute treatment with very low doses of heptanol (Sigma-Aldrich, St. Louis, MO). Heptanol was diluted in Tyrode's solution to 0.25 and 0.50 mM, and at each concentration samples were perfused for 10 min before measurements. Increase in cellular coupling was done by a small molecule, 4-phenylbutyrate (4PB), which we recently found to act as a gap junction agonist (16). 4PB (Calbiochem, La Jolla, CA) was applied in culture medium at 1 mM for 48 h at 37°C. We have found that these treatment conditions result in upregulation of connexin 43.
In a subset of samples (n = 4), we tested the effect of sodium channel blocker TTX on wave propagation by applying TTX at concentrations: 0, 0.93, 2.8, and 8.33 μM, and measuring changes in conduction velocity (CV) during pacing at 1 Hz.
Quantification of cell-cell coupling using fluorescence recovery after photobleaching
Cardiomyocyte monolayers were stained with a low molecular weight dye; calcein-AM (Invitrogen, Carlsbad, CA) at 0.5 μM for 20 min. Quantification of diffusion properties at the multicellular level was done by a macroscale version of fluorescence recovery after photobleaching (FRAP) (21), using an Olympus confocal system with its FluoView FV1000 software package. A single cell within the field of view was bleached out at 100% laser power for 1 s, followed by measurements of recovery at 1% laser power (488 nm), acquiring data every 1 s for at least 120 s. An empirical approach was employed, where normalized fluorescence recovery curves were fit with a perturbation-relaxation equation (21,22) to extract quantitative measures of diffusion:
| (1) |
F(t), F0, and F∞ are the normalized fluorescence intensities at time t, t = 0 and t = ∞; τ is the time constant of recovery. Theoretical analysis (22) reveals that τ is inversely proportional to the effective diffusion constant and thus to cell-cell coupling.
Experimental measurements of Vm-Ca2+ coupling
In a subset of samples (n = 16), cells were costained for transmembrane voltage and intracellular calcium with di-8-ANEPPS and Fura-2-AM (Invitrogen), respectively. Cells were stimulated with a Pt line electrode at one end of the scaffold, initiating a planar wave. Pacing frequency was varied from 1 to 2 Hz in 0.5 Hz steps and thereafter in 0.2 Hz increments. Measurements of steady-state response in Vm and Ca2+ at the same location were done sequentially and a pacing signal was used to align beats, as previously reported (19). Fluorescence signals were recorded with a photomultiplier tube at a fixed distance (1.2–1.6 cm) from the electrode at a sampling rate of 1 kHz. Using an automatic pacing protocol and filter switching, cells were paced up through failure to follow 1:1 (occurrence of alternans or conduction block), and then down, decreasing pacing frequency. Hysteresis was measured as the difference between the frequencies of appearance of alternans upon increase in frequency minus the frequency of disappearance of alternans while decreasing frequency (see Fig. S3).
Ultrahigh resolution optical mapping of intracellular calcium
Ca2+ measurements were performed 4–6 days after culture in an experimental chamber perfused with oxygenated Tyrode solution (in mM: 1.33 CaCl2, 5 glucose, 5 HEPES, 1 MgCl2, 5.4 KCl, 135 NaCl, and 0.33 NaH2PO4, with pH = 7.4, 30 ± 1°C. Cells were stained with the Ca2+-sensitive dye Fluo-4 at room temperature for 20 min.
We applied ultrahigh resolution imaging with an intensified CMOS camera (1280 × 1024 pixels, pco camera) and Video Scope Gen III intensifier coupled to a high NA lens (Navitar Platinum, f/1). The field of view (FOV) was ∼2.2 × 2.2 cm; spatial resolution after 2 × 2 binning was (44 × 44 μm in x-y); temporal resolution was 200 fps. The system is able to achieve cell-level resolution, considering the average cell area of 400–600 μm2 (20), over a very large FOV.
Pacing was applied via Pt line electrodes on one side of each sample for a total duration of around 10 min: starting at 1 Hz with a step of 0.5 Hz, and then from 2 to 7.5 Hz, a step of 0.2 Hz. For each pacing frequency, the acquisition system was programmed to pause for 30 beats without recording so that steady state is reached, followed by a record of 30 beats.
Data processing
Preprocessing of the optical mapping recordings was done using custom-designed software in MATLAB (The MathWorks, Natick, MA). Signal filtering included a temporal Savitzky-Golay filter (second order, 7 frames window) and a spatial 3 × 3 Bartlett filter. Automatic beat detection was applied after baseline subtraction and enhancement of contrast. Ca2+ alternans were detected and stored with preservation of alternans ratio (AR) and representative phase using a recently published algorithm (23). Briefly, we used a combinatorics-derived definition of alternans in the presence of random noise that relies on temporal persistence (TP) criteria to assure high sensitivity and specificity (>99%) in the alternans detection. This algorithm provides reliable alternans detection in conditions of a low signal/noise ratio, such as occurring at an extremely fine spatial scale and for very small amplitude alternans (at the detection limit). This was essential for capture of early fine-scale Ca2+ alternation in this study. For a subset of samples, we applied a spatial clustering analysis based on the detected alternans phase. We used k-means cluster algorithm, implemented in MATLAB. It partitions points into k clusters by using a two-phase iterative algorithm to minimize the sum of point-to-centroid distances. Statistical analysis was done using analysis of variance with posthoc Tukey-Kramer correction or nonparametric tests as described.
Computer simulations of Ca2+ alternans and variable diffusion in a cardiac model
We modeled voltage and calcium dynamics in a two-dimensional tissue using the reaction-diffusion equation:
| (2) |
where Cm = 1, μF/cm2 is the membrane capacitance, D is the effective diffusion coefficient of membrane voltage, and where Iion is the total ionic current density. The reaction-diffusion equation was integrated with an operator splitting method, and adaptive time step method (24). The space step was 0.015 cm and the time step varied from 0.1 to 0.01 ms. The ionic current was modeled by integrating a model of Ca2+ cycling of Shiferaw et al. (25), with the canine action potential model of Fox et al. (26). Cellular alternans can be generated in this model either by a dynamical instability of Vm or by Ca2+ dynamics. In our simulations, model parameters were adjusted so that alternans were due to instability in Ca2+ cycling dynamics via a steep release load relationship (27). We modeled the case of electromechanically concordant alternans, in which a long APD is associated with a large Ca2+ transient, because this positive coupling scenario (27) agrees with the experimentally observed relationship between the Ca2+ transient and the APD in our neonatal rat culture (see Fig. S3). The strength of the electromechanical (Vm-Ca2+) coupling in the model was controlled by the timescale of recovery for the L-type Ca2+ channel, where a very fast kinetics makes it insensitive to the previous diastolic interval and abolishes voltage-driven APD alternans and its feedback on Ca2+ alternans.
A strip of cardiac tissue 150 cells long and 3 cells wide was considered. Heterogeneous Ca2+ cycling properties were incorporated by making a central zone of 20 × 3 cells unstable to Ca2+ alternans at a pacing rate of 250 ms, although cells outside this region were stable, i.e., they did not display alternans when uncoupled from the tissue and paced at 4 Hz. The tissue was paced for 70 beats to steady state, similar to the experiments. Spatial profiles of Ca2+ and APD alternans amplitude were measured and plotted for different values of the voltage diffusion coefficient in the range: Dv = 0.24∼1.8∗10−3 cm2/ms.
Two additional abstract modeling approaches were used in this study, described in the Supporting Material. First, we considered the classic diffusion equation for homogeneous isotropic two-dimensional medium with a closed-form solution by Crank (28). Ca2+ alternans were treated as a simple diffusing entity in this case, and their amplitude and spatial spread were quantified as a function of the diffusion coefficient (see Fig. S2). Furthermore, we used amplitude equations (11,29) to describe the spatiotemporal evolution of voltage and Ca2+ alternans under variable coupling conditions (see Fig. S6).
Results
Perturbation and quantification of cell-cell coupling
We employed an in vitro model of cardiac syncytium, neonatal rat cardiomyocyte culture, that has been successfully used in addressing a wide range of mechanistic questions related to multicellular cardiac function (17,18,20,30,31). Currently, there is no completely selective way of perturbing gap junction coupling without affecting other cell/tissue properties. To create a range of coupling conditions, in this study, we chose two perturbations known for relatively high selectivity in their action on cardiac cellular coupling: a classic gap junction uncoupler (32), heptanol, which when used at low doses, as here: 0.25 and 0.5 mM, has negligible effects on excitability (33) (see also Fig. S1), and a gap junction enhancer, 4PB, which we have shown recently to augment cellular coupling in cardiac tissue by upregulating connexin 43 (16), similar to reports in other tissues (34,35). Coupling under these perturbations was quantified by a macroscopic version of FRAP (21,31,36), Fig. 1 A. FRAP measures the diffusion of a low molecular weight dye, e.g., calcein-AM, to infer coupling via gap junctions. FRAP results are best presented in terms of the time constant of recovery, τ, obtained after nonlinear curve fit to a perturbation-relaxation curve (22), Fig. 1 B. As intended, we found that perturbation of coupling resulted in a range of τ-values from low (1 mM 4PB) to high (0.5 mM heptanol), both of which were significantly different from control, Fig. 1 C. Although the exact derivation of diffusion coefficients (D) from such FRAP measurements will depend on model assumptions (22), in general, D is inversely proportional to τ (see Methods in the Supporting Material). Therefore, throughout this study we use (1/τ) as a surrogate measure of coupling and indirectly of electrical diffusion, Dv.
Figure 1.

Perturbation and quantification of cell-cell coupling. The effects of gap junction agonist (4PB) and gap junction antagonist (heptanol) on cellular connectivity were quantified by FRAP. (A) Representative fluorescence images at different time points during the FRAP: before bleaching, at t = 0 s and at t = 20 s. Bleached cells are indicated by yellow arrows. Inset shows the applied FRAP protocol. (B) Averaged perturbation-relaxation recovery curves of 4PB (red), control (blue), and 0.25 mM heptanol-treated samples. Error bars are 95% confidence interval. (C) The time constant calculated from the recovery curve fitting for 4PB, control, and heptanol samples. Samples treated with 4PB and 0.5 mM heptanol have significantly different time constants compared to control samples. Error bars are 95% confidence interval; number of examined samples is shown for each group. Diffusion is inversely proportional to the calculated time constants.
Effects of coupling on macroscopic wave propagation
After quantifying coupling for the four experimental groups (4PB, control, 0.25 mM heptanol, and 0.5 mM heptanol), we measured macroscopic wave propagation using optical mapping of intracellular Ca2+. CV followed the FRAP-determined coupling trend, with 4PB and 0.5 mM heptanol-treated groups exhibiting significant and opposite changes in CV from control, Fig. 2, A and B.
Figure 2.

Effects of coupling on propagation. (A) CV measured at 30°C, 1 Hz pacing for each group in the rectangular samples; last bar shows recovery (wash out) after heptanol treatment. Error bars indicate standard deviation; (∗) significance at p < 0.05; the 95% CI for the slope of a regression line was (23.7, 46.9). (B) Example activation maps for the four groups; color indicates time of activation (0 to 0.1 s), isochrones (in black) are 0.02 s apart. Ca2+ transients are shown from each sample at the ∗ location. (C) Estimated relative effects of heptanol on CV via suppression of gNa and via gap junction block. The two diamonds indicate actual measured CV values (as % of control, from panel A) for the two heptanol concentrations used here; the three curves show expected reduction in CV via gNa block alone: analytical estimate (black), numerical solution (red), and our experimental data with TTX block (blue). See text and Fig. S1 for further details. (D and E) No significant effects of 4PB and low doses of heptanol on Ca2+ transients: CTD80 and rise time (mean ± SE) are not significantly different between the groups (p = 0.34 for 4PB effects and p = 0.16 for heptanol effects on CTD80); power analysis with bootstrapping would have uncovered significant changes if CTD80 were altered by >18.7%.
Fig. 2, C–E, illustrates the relatively high selectivity of heptanol in perturbing coupling, when used at low doses. For doses lower than its k0.5 =1.3 mM for effects on Na+ ion channel availability (33), Fig. S1, heptanol is expected to minimally affect cardiac excitability, and thus its primary effect on CV is conferred via gap junction coupling, not Na+ ion channels. Fig. 2 C combines an analytical estimate (37), numerical simulations (38), and our own experimental data using TTX blockade (39) on changes of CV purely by perturbation of the Na+ channel conductance, gNa (see also Fig. S1). It is clear that the reductions in CV observed in this study (down to 72% for 0.25 mM heptanol and down to 43% for 0.5 mM heptanol) are dominated by gap junction effects of heptanol, not Na+ channel-mediated changes in conduction. The corresponding gNa values in Fig. 2 C are derived from a published dose-response curve for heptanol (33). Heptanol and 4PB did not have statistically significant effects on calcium transient duration, CTD80 (Fig. 2 D) and rise time (Fig. 2 E); power analysis with bootstrapping confirmed that 18.7% change in CDT80 would have been detectable with our current sample size. Furthermore, at the low doses used here, heptanol did not introduce a statistically significant wavefront fractionation (Fig. S4), thus we assumed spatially uniform and relatively specific action on coupling.
Rate-dependent evolution of fine-scale Ca2+ alternans as a function of coupling
The next task was to quantify the spatiotemporal behavior of intracellular Ca2+ alternans in our experimental system under the established coupling conditions. Experimental tracking of early (cell-level) seeds of Ca2+ alternation, that we call fine-scale alternans, is difficult at the macroscopic/tissue level because of their small amplitude and fine spatial scale, i.e., because of their apparent similarities with random noise (23). To achieve this by nonconfocal imaging over a cm-FOV, we combined ultrahigh-resolution optical mapping (40) and a newly validated algorithm for detection of spatiotemporal alternans, which uses TP as a measure to ensure high fidelity in distinguishing low-level alternation from noise (23). Fig. 3 A shows the first, to our knowledge, example of a nonconfocal detection of cellular-level Ca2+ alternans while mapping a cm-FOV. Five fine-scale spatially discordant alternans regions are shown, which persisted for at least 50 beats when this sample was paced at 4 Hz.
Figure 3.
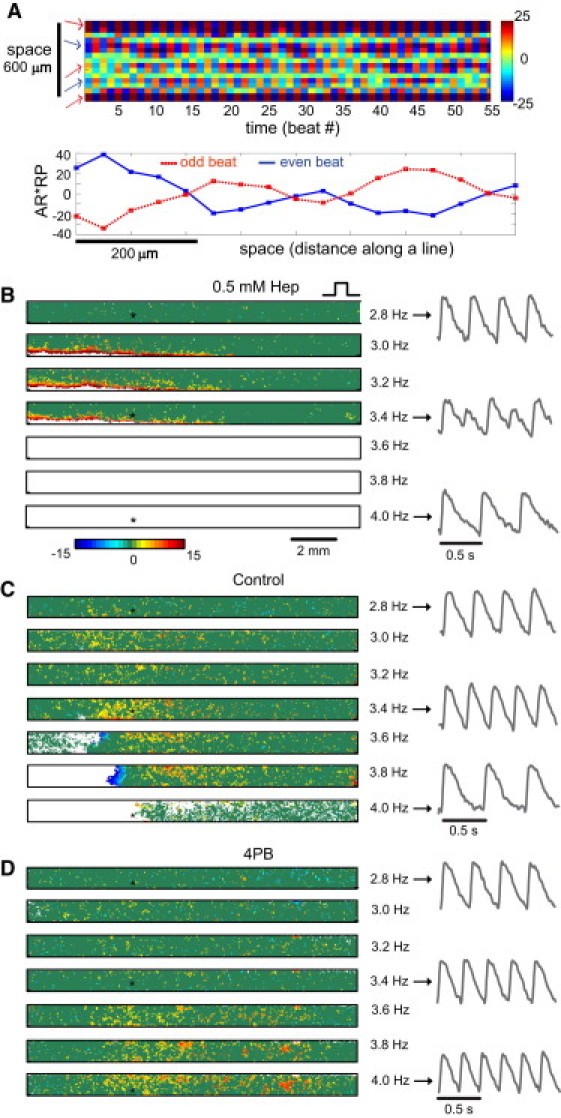
Rate-dependent evolution of fine-scale Ca2+ alternans. (A) Resolving fine-scale alternans while imaging a large FOV: (top) space-time plot of persistent (over 55 beats) fine-scale alternation at the cellular level at 4 Hz pacing, detected while imaging FOV = 2.2 × 2.2 cm2; color indicates Ca2+ AR (%), multiplied by representative phase, (−1, +1); (bottom) plot of fine-scale spatially discordant alternans along a line from the same sample. (B–D) Representative spatial maps of fine-scale Ca2+ alternans at steady state under different pacing frequencies and cellular coupling conditions: 0.5 mM heptanol (B), control (C), and 4PB samples (D). Pacing electrode is on the right side. Color indicates AR (%) at different spatial locations. Red and blue identify opposite phase; dark green areas are regions with no detected alternans; white areas identify conduction blocks. Traces on the right are from the location identified by a (∗) at pacing frequencies 2.8, 3.4, and 4.0 Hz.
For the chosen algorithm parameters (TP ≥ 60%) (23), each spot of alternation in Fig. 3, B–D, is confirmed with specificity >99.99% and sensitivity >96.75% for ARs ≥5%, even if the patterns visually may resemble noise. Such fine alternating signals are lost in classic macroscopic maps of Ca2+ alternans due to spatial averaging by insufficient resolution. Here, we reveal that seeds of alternation exist at relatively low pacing frequencies regardless of coupling, and that increasing pacing rates gradually recruit larger areas of Ca2+ alternation until development of large-scale alternans (defined here as alternans in contiguous areas ≥ 0.3 mm × 0.3 mm; examples are seen at higher frequencies in Fig. 3, B–D, and in Fig. S7 C), and/or direct development of conduction blocks.
Fig. 4, A and B, links measured coupling values (1/τ) to quantified macroscopic tissue function, to reveal theoretically expected (38,41) monotonic increase of CV and breakpoint frequency (the maximum frequency of 1:1 capture) with coupling. Fig. 4, C–F, illustrates the behavior of intracellular Ca2+ alternans as a function of coupling. The progressive recruitment of larger areas of fine alternans is shown across pacing frequencies for three levels of coupling, Fig. 4 C. Increase of coupling resulted in monotonic decrease in the average amplitude of early alternation (AR) at low frequencies (<2 Hz), Fig. 4 D. Surprisingly, the area of early Ca2+ alternation was found to be a nonmonotonic function of coupling, Fig. 4, B and E, where intermediate (not low) coupling resulted in the largest area of early alternation. Both, increase in coupling by 4PB and decrease in coupling with heptanol, had a significant effect of reducing the area of early alternation (p < 0.0001), whereas calcium transient duration showed no significant correlation with the observed areas (Fig. S5). Furthermore, this trend was reproduced when we examined the percent of samples in each of the four experimental groups that underwent large-scale Ca2+ alternation before block Fig. 4 F. Thus, the spatial extent of early Ca2+ alternans (ignoring amplitude) was predictive of alternans development at higher rates for different coupling.
Figure 4.

Linking dynamic properties of Ca2+ alternans to FRAP-quantified diffusion. (A) CV as a function of the FRAP-measured diffusion factor (1/τ, 1/s) for the four experimental groups. (B) Breakpoint frequency (frequency of failure to follow 1:1) as a function of the diffusion factor (1/τ, s). (C) Evolution of the areas exhibiting local Ca2+ alternans as a function of pacing frequency: green for low coupling (0.5 mM heptanol), black for intermediate coupling (control), and blue for high coupling (4PB); arrows indicate the average breakpoint frequency; error bars indicate standard error. (D) Space-averaged AR for early fine Ca2+ alternans (<2 Hz) as a function of coupling/diffusion. (E) Area of fine Ca2+ alternation at low frequencies (<2 Hz) as a function of coupling. (F) Proportion of samples (%) that exhibited large-scale 2:2 alternans upon breakpoint frequency (the remaining samples went directly into 2:1 block). Sample numbers for A∼F are n0.5 mM = 17, n0.25 mM = 14, ncontrol = 28, n4PB = 18; data are mean ± 95% confidence interval.
Theoretical explanation of the effects of coupling on the spatial properties of Ca2+ alternans
Considering the nontrivial nature of the experimental results in Fig. 4, E and F, we sought insight by theoretical modeling. Simply abstracting the behavior of Ca2+ alternans and coupling to a generic passively diffusing parameter using the analytical solution to the classic diffusion equation in a homogeneous medium (28) (see Methods in the Supporting Material), revealed that the asymmetric nonmonotonic relationship in Fig. 4 E can be reproduced by combining diffusive spread with a threshold of detection (compare Fig. S2 B right to Fig. 4 E). When alternans are treated as binary events, i.e., the information about the AR (above a threshold of detection) is ignored, the affected areas exhibit such nonmonotonic behavior. However, this approach of treating the diffusion of Ca2+ alternans is overly simplistic and does not capture the mechanism of events in a complex reaction-diffusion system, such as the heart.
To model the more complex case of Ca2+ alternans in cardiac tissue, we applied an existing ionic model of voltage and calcium in cardiac tissue (27). Model parameters were adjusted so that alternans were due to an instability of Ca2+ cycling that induced electromechanically concordant alternans at rapid pacing rates. This choice of parameters is based on our experimental observation (Fig. S2) that a large/small Ca2+ transient corresponds to a long/short APD. Furthermore, we note that alternans in our system are not likely due to a voltage instability, since, as shown previously (14), such a mechanism cannot induce spatially discordant Ca2+ alternans abruptly switching phase at a fine spatial scale (<1–5 cells, as seen in Fig. 3 A), i.e., cell-to-cell coupling requires that voltage-driven alternans can only vary on a scale commensurate with the electrotonic length (>10 cells). In the modeled spatially extended cardiac tissue, a central region of Ca2+ driven alternans was simulated under variable diffusion conditions. The results, Fig. 5, A–C, closely match our experimental findings about the amplitude and area of Ca2+ alternation as a function of coupling.
Figure 5.

Theoretical explanation of the effects of coupling on the spatial properties of Ca2+ alternans. Using a computational model of cardiac tissue, an island of Ca2+ alternans (inset) was simulated under different coupling conditions. Quantification of spatial patterns by imposing a threshold (A) average AR under 4 Hz pacing as a function of diffusion properties (B); area of Ca2+ alternation above a threshold as a function of diffusion properties (C). Color (blue to red) indicates low to high diffusion. Compare panel B to Fig. 4D, and panel C to Fig. 4, E and F. (D). Schematic illustration of the effective diffusion of Ca2+ alternans via Dv: in a cell pair or a cable. (E) In the cell/region exhibiting instability (gray), Ca2+ alternans drive Vm alternans, which propagate according to Dv. In the distant cell/region, Vm alternans cause Ca2+ alternans, thus effectively mediating diffusion of Ca2+ alternans. (F) Effects of Vm-Ca2+ coupling on the diffusion of Ca2+ alternans: same simulations as in A, but under low Vm-Ca2+. Ca2+ alternans do not spread outside the unstable region (E) because of negligible Vm alternans amplitude and low Vm-Ca2+ coupling in this case (G).
Discussion
In this study, we find that isolated fine-scale (cell-level) Ca2+ alternans occur at relatively low pacing rates and their amplitude and spatial evolution are modulated by cell-cell coupling in a cardiac syncytium (Figs. 3 and 4). Our FRAP-quantified perturbations of cellular coupling are likely to affect multicellular diffusion reflected in both Dca and Dv. These two diffusion coefficients differ by 3–5 orders of magnitude: Dv is in the range 0.1–1cm2/s (42), whereas Dca has been measured in the cytoplasm of oocytes as 1.3–6.5 × 10⁻⁴ cm2/s (43), or estimated for myocytes in the range 0.5–5 × 10⁻⁵ cm2/s (44,45). Because of this disparity, virtually all models of cardiac tissue assume Dca = 0 at the tissue level (cell-to-cell), including the model used here.
Considering that in the absence of tissue-level diffusion for Ca2+, our cardiac tissue model qualitatively reproduced the spatial behavior of Ca2+ alternans in the experiments (Fig. 5, A–C), the following mechanism can be put forward for the effects of Dv on Ca2+ alternans: At the single-cell level, coupling between voltage and Ca2+ allows for Ca2+ alternans to drive APD alternans (via the action of the Ca2+ sensing ion transporters, e.g., L-type Ca2+ channel and Na/Ca exchanger) and vice versa—APD alternans can drive Ca2+ alternans (via changes in the diastolic interval and thus changes in the amount of Ca2+ released). Consider a cell pair or a multicellular cable (Fig. 5 D), where a region (or a cell) is unstable, i.e., exhibits Ca2+-driven alternans, whereas the rest of the tissue is stable. The spatial profiles for Ca2+ and APD alternans are sketched for low (Fig. 5 E, solid lines) and high (Fig. 5 E, dashed lines) values of Dv. It is important to note that in the unstable cell/region, Ca2+ alternans drives APD alternans, although in the stable cell/region APD alternans drives Ca2+ alternans. The presence of APD alternans is due to the electrotonic coupling between the unstable region and the rest of the tissue. When coupling (and Dv) is increased, APD alternans will be smoothed out over a longer scale so that APD alternans in the unstable region will decrease, whereas APD alternans in the stable region will increase. Because of the Vm-Ca2+ coupling, this will also have a smoothing effect on the spatial variation of Ca2+ alternans, i.e.: 1), the amplitude of Ca2+ alternans will decrease in the unstable region, and increase in the neighboring stable region; and 2), the area of the region exhibiting Ca2+ alternans will increase. Upon further increase in Dv, the amplitude of Ca2+ alternans can decrease below a threshold of detection.
To further validate this mechanism, we show simulation results with reduced electromechanical (Vm-Ca2+) coupling (Fig. 5 F). For the same range of Dv values, due to the now negligible APD alternans outside the unstable region (Fig. 5 G) and the very weak effect they have on Ca2+ alternans, the latter are completely confined to their origin and the spatial data do not match our experimental findings. These results were also corroborated using amplitude equations linking APD and Ca2+ alternans (11,29) close to the bifurcation point (Fig. S6), strengthening the generality of the proposed mechanism. Fig. S6, A and B, matches well with experimental data in Fig. 4, D–F, and model data in Fig. 5, B and C, and Fig. S2 B. In summary, at the tissue level, the effective diffusion of Ca2+ alternans is not a function of Dca, but is indirectly determined by the Vm-Ca2+ coupling and by Dv via diffusing APD alternans.
An alternative mechanism for occurrence of fine-scale alternans, driven by voltage, can involve substantial spatial heterogeneities in coupling, as seen during nonuniform heptanol uncoupling in a trial tissue (46). However, in our cultured monolayers heptanol effects are expected to be more uniform, and the lower concentrations used here are unlikely to produce complete local uncoupling. These expectations are corroborated by the lack of wavefront fractionation (Fig. 2 B and Fig. S4); as would have been found in nonuniform uncoupling (41).
We have demonstrated that tissue coupling can affect the evolution of early Ca2+ instabilities and their progression to tissue-level arrhythmias. Of particular interest are the related questions whether knowledge of coupling can be used to predict macroscale changes in Ca2+ dynamics and whether the early fine-scale Ca2+ alternans hold predictive potential for response at higher rates?
Fig. S7 A recaptures the nearly linear change in breakpoint frequency with increase in coupling. Thus, based on these findings, response to high pacing rates can be inferred from knowledge of relative changes in coupling. Furthermore, Fig. S7 B reveals a moderate degree of correlation between the areas of early (<2 Hz) fine-scale Ca2+ alternans and the areas of large-scale alternation at higher rates, in addition to similarities already highlighted in Fig. 4, E and F. Finally, Fig. S7 C presents an example where the development of a nodal line in the formation of large-scale spatially discordant alternans can be predicted by clustering analysis (by k-means) of the phases of early seeds of Ca2+ alternation. More extensive analysis is needed to quantify the reliability of such predictions.
In conclusion, using experimental and computational techniques that link fine-scale Ca2+ instabilities to macroscopic tissue properties, we propose and validate a mechanism for spread of such instabilities that depends on gap junction-mediated diffusion, Dv, and Vm-Ca2+ (electromechanical) coupling. Such insight is very much needed, because: 1), more cardiac arrhythmias are linked to Ca2+ instabilities as an independent trigger; and 2), alteration in cell-cell coupling is a signature in the progression of multiple cardiac abnormalities, e.g., ischemia and hypertrophy. Understanding the interaction between these two conditions can help tackle a large portion of encountered cardiac arrhythmias.
Acknowledgments
This work was supported by National Institutes of Health-National Institute of General Medical Sciences funded Systems Biology Center in New York State, GM071558 (E.E.), American Heart Association grant 0830298N (Y.S.), and NIH-National Heart, Lung, and Blood Institute grants R01HL101196 (Y.S.) and R01HL111649 (E.E.).
Supporting Material
References
- 1.Chudin E., Goldhaber J., Kogan B. Intracellular Ca(2+) dynamics and the stability of ventricular tachycardia. Biophys. J. 1999;77:2930–2941. doi: 10.1016/S0006-3495(99)77126-2. [DOI] [PMC free article] [PubMed] [Google Scholar]
- 2.Kapur S., Aistrup G.L., Wasserstrom J.A. Early development of intracellular calcium cycling defects in intact hearts of spontaneously hypertensive rats. Am. J. Physiol. Heart Circ. Physiol. 2010;299:H1843–H1853. doi: 10.1152/ajpheart.00623.2010. [DOI] [PMC free article] [PubMed] [Google Scholar]
- 3.Němec J., Kim J.J., Salama G. Calcium oscillations and T-wave lability precede ventricular arrhythmias in acquired long QT type 2. Heart Rhythm. 2010;7:1686–1694. doi: 10.1016/j.hrthm.2010.06.032. [DOI] [PMC free article] [PubMed] [Google Scholar]
- 4.Lehnart S.E., Terrenoire C., Marks A.R. Stabilization of cardiac ryanodine receptor prevents intracellular calcium leak and arrhythmias. Proc. Natl. Acad. Sci. USA. 2006;103:7906–7910. doi: 10.1073/pnas.0602133103. [DOI] [PMC free article] [PubMed] [Google Scholar]
- 5.Kang G., Giovannone S.F., Fishman G.I. Purkinje cells from RyR2 mutant mice are highly arrhythmogenic but responsive to targeted therapy. Circ. Res. 2010;107:512–519. doi: 10.1161/CIRCRESAHA.110.221481. [DOI] [PMC free article] [PubMed] [Google Scholar]
- 6.Nolasco J.B., Dahlen R.W. A graphic method for the study of alternation in cardiac action potentials. J. Appl. Physiol. 1968;25:191–196. doi: 10.1152/jappl.1968.25.2.191. [DOI] [PubMed] [Google Scholar]
- 7.Eisner D.A., Choi H.S., Trafford A.W. Integrative analysis of calcium cycling in cardiac muscle. Circ. Res. 2000;87:1087–1094. doi: 10.1161/01.res.87.12.1087. [DOI] [PubMed] [Google Scholar]
- 8.Weiss J.N., Nivala M., Qu Z. Alternans and arrhythmias: from cell to heart. Circ. Res. 2011;108:98–112. doi: 10.1161/CIRCRESAHA.110.223586. [DOI] [PMC free article] [PubMed] [Google Scholar]
- 9.Echebarria B., Karma A. Amplitude equation approach to spatiotemporal dynamics of cardiac alternans. Phys. Rev. E. 2007;76:051911. doi: 10.1103/PhysRevE.76.051911. [DOI] [PubMed] [Google Scholar]
- 10.Kurebayashi N., Yamashita H., Ogawa Y. Behavior of Ca(2+) waves in multicellular preparations from guinea pig ventricle. Am. J. Physiol. Cell Physiol. 2004;287:C1646–C1656. doi: 10.1152/ajpcell.00200.2004. [DOI] [PubMed] [Google Scholar]
- 11.Shiferaw Y., Karma A. Turing instability mediated by voltage and calcium diffusion in paced cardiac cells. Proc. Natl. Acad. Sci. USA. 2006;103:5670–5675. doi: 10.1073/pnas.0511061103. [DOI] [PMC free article] [PubMed] [Google Scholar]
- 12.Aistrup G.L., Kelly J.E., Wasserstrom J.A. Pacing-induced heterogeneities in intracellular Ca2+ signaling, cardiac alternans, and ventricular arrhythmias in intact rat heart. Circ. Res. 2006;99:e65–e73. doi: 10.1161/01.RES.0000244087.36230.bf. [DOI] [PubMed] [Google Scholar]
- 13.Sato D., Shiferaw Y., Karma A. Spatially discordant alternans in cardiac tissue: role of calcium cycling. Circ. Res. 2006;99:520–527. doi: 10.1161/01.RES.0000240542.03986.e7. [DOI] [PubMed] [Google Scholar]
- 14.Sato D., Shiferaw Y., Karma A. Inferring the cellular origin of voltage and calcium alternans from the spatial scales of phase reversal during discordant alternans. Biophys. J. 2007;92:L33–L35. doi: 10.1529/biophysj.106.100982. [DOI] [PMC free article] [PubMed] [Google Scholar]
- 15.Kjølbye A.L., Dikshteyn M., Rosenbaum D.S. Maintenance of intercellular coupling by the antiarrhythmic peptide rotigaptide suppresses arrhythmogenic discordant alternans. Am. J. Physiol. Heart Circ. Physiol. 2008;294:H41–H49. doi: 10.1152/ajpheart.01089.2006. [DOI] [PubMed] [Google Scholar]
- 16.Jia Z.H., Gordon C., Entcheva E. Anti-arrhythmic effects of 4-phenylbutyrate (4PB) in cardiac myocytes. Circulation. 2009 Abstract, 120:S653–S654. [Google Scholar]
- 17.Entcheva E., Bien H. Tension development and nuclear eccentricity in topographically controlled cardiac syncytium. Biomed. Microdevices. 2003;5:163–168. [Google Scholar]
- 18.Bien H., Yin L., Entcheva E. Calcium instabilities in mammalian cardiomyocyte networks. Biophys. J. 2006;90:2628–2640. doi: 10.1529/biophysj.105.063321. [DOI] [PMC free article] [PubMed] [Google Scholar]
- 19.Chung C.Y., Bien H., Entcheva E. The role of cardiac tissue alignment in modulating electrical function. J. Cardiovasc. Electrophysiol. 2007;18:1323–1329. doi: 10.1111/j.1540-8167.2007.00959.x. [DOI] [PubMed] [Google Scholar]
- 20.Chung C.Y., Bien H., Entcheva E. Hypertrophic phenotype in cardiac cell assemblies solely by structural cues and ensuing self-organization. FASEB J. 2011;25:851–862. doi: 10.1096/fj.10-168625. [DOI] [PMC free article] [PubMed] [Google Scholar]
- 21.Wade M.H., Trosko J.E., Schindler M. A fluorescence photobleaching assay of gap junction-mediated communication between human cells. Science. 1986;232:525–528. doi: 10.1126/science.3961495. [DOI] [PubMed] [Google Scholar]
- 22.Axelrod D., Koppel D.E., Webb W.W. Mobility measurement by analysis of fluorescence photobleaching recovery kinetics. Biophys. J. 1976;16:1055–1069. doi: 10.1016/S0006-3495(76)85755-4. [DOI] [PMC free article] [PubMed] [Google Scholar]
- 23.Jia Z., Bien H., Entcheva E. Detecting space-time alternating biological signals close to the bifurcation point. IEEE Trans. Biomed. Eng. 2010;57:316–324. doi: 10.1109/TBME.2009.2028652. [DOI] [PMC free article] [PubMed] [Google Scholar]
- 24.Qu Z., Garfinkel A. An advanced algorithm for solving partial differential equation in cardiac conduction. IEEE Trans. Biomed. Eng. 1999;46:1166–1168. doi: 10.1109/10.784149. [DOI] [PubMed] [Google Scholar]
- 25.Shiferaw Y., Watanabe M.A., Karma A. Model of intracellular calcium cycling in ventricular myocytes. Biophys. J. 2003;85:3666–3686. doi: 10.1016/S0006-3495(03)74784-5. [DOI] [PMC free article] [PubMed] [Google Scholar]
- 26.Fox J.J., McHarg J.L., Gilmour R.F., Jr. Ionic mechanism of electrical alternans. Am. J. Physiol. Heart Circ. Physiol. 2002;282:H516–H530. doi: 10.1152/ajpheart.00612.2001. [DOI] [PubMed] [Google Scholar]
- 27.Shiferaw Y., Sato D., Karma A. Coupled dynamics of voltage and calcium in paced cardiac cells. Phys. Rev. E. 2005;71:021903. doi: 10.1103/PhysRevE.71.021903. [DOI] [PMC free article] [PubMed] [Google Scholar]
- 28.Crank J. Oxford University Press; Oxford, UK: 1975. The Mathematics of Diffusion. [Google Scholar]
- 29.Echebarria B., Karma A. Instability and spatiotemporal dynamics of alternans in paced cardiac tissue. Phys. Rev. Lett. 2002;88:208101. doi: 10.1103/PhysRevLett.88.208101. [DOI] [PubMed] [Google Scholar]
- 30.Rohr S., Schölly D.M., Kléber A.G. Patterned growth of neonatal rat heart cells in culture. Morphological and electrophysiological characterization. Circ. Res. 1991;68:114–130. doi: 10.1161/01.res.68.1.114. [DOI] [PubMed] [Google Scholar]
- 31.McSpadden L.C., Kirkton R.D., Bursac N. Electrotonic loading of anisotropic cardiac monolayers by unexcitable cells depends on connexin type and expression level. Am. J. Physiol. Cell Physiol. 2009;297:C339–C351. doi: 10.1152/ajpcell.00024.2009. [DOI] [PMC free article] [PubMed] [Google Scholar]
- 32.Takens-Kwak B.R., Jongsma H.J., Van Ginneken A.C. Mechanism of heptanol-induced uncoupling of cardiac gap junctions: a perforated patch-clamp study. Am. J. Physiol. 1992;262:C1531–C1538. doi: 10.1152/ajpcell.1992.262.6.C1531. [DOI] [PubMed] [Google Scholar]
- 33.Nelson W.L., Makielski J.C. Block of sodium current by heptanol in voltage-clamped canine cardiac Purkinje cells. Circ. Res. 1991;68:977–983. doi: 10.1161/01.res.68.4.977. [DOI] [PubMed] [Google Scholar]
- 34.Ammerpohl O., Trauzold A., Kalthoff H. Complementary effects of HDAC inhibitor 4-PB on gap junction communication and cellular export mechanisms support restoration of chemosensitivity of PDAC cells. Br. J. Cancer. 2007;96:73–81. doi: 10.1038/sj.bjc.6603511. [DOI] [PMC free article] [PubMed] [Google Scholar]
- 35.Asklund T., Appelskog I.B., Almqvist P.M. Histone deacetylase inhibitor 4-phenylbutyrate modulates glial fibrillary acidic protein and connexin 43 expression, and enhances gap-junction communication, in human glioblastoma cells. Eur. J. Cancer. 2004;40:1073–1081. doi: 10.1016/j.ejca.2003.11.034. [DOI] [PubMed] [Google Scholar]
- 36.Abbaci M., Barberi-Heyob M., Didelon J. Gap junctional intercellular communication capacity by gap-FRAP technique: a comparative study. Biotechnol. J. 2007;2:50–61. doi: 10.1002/biot.200600092. [DOI] [PubMed] [Google Scholar]
- 37.Hunter P.J., McNaughton P.A., Noble D. Analytical models of propagation in excitable cells. Prog. Biophys. Mol. Biol. 1975;30:99–144. doi: 10.1016/0079-6107(76)90007-9. [DOI] [PubMed] [Google Scholar]
- 38.Shaw R.M., Rudy Y. Ionic mechanisms of propagation in cardiac tissue. Roles of the sodium and L-type calcium currents during reduced excitability and decreased gap junction coupling. Circ. Res. 1997;81:727–741. doi: 10.1161/01.res.81.5.727. [DOI] [PubMed] [Google Scholar]
- 39.Brette F., Orchard C.H. No apparent requirement for neuronal sodium channels in excitation-contraction coupling in rat ventricular myocytes. Circ. Res. 2006;98:667–674. doi: 10.1161/01.RES.0000209963.02720.70. [DOI] [PubMed] [Google Scholar]
- 40.Entcheva E., Bien H. Macroscopic optical mapping of excitation in cardiac cell networks with ultra-high spatiotemporal resolution. Prog. Biophys. Mol. Biol. 2006;92:232–257. doi: 10.1016/j.pbiomolbio.2005.10.003. [DOI] [PubMed] [Google Scholar]
- 41.Qu Z., Karagueuzian H.S., Weiss J.N. Effects of Na(+) channel and cell coupling abnormalities on vulnerability to reentry: a simulation study. Am. J. Physiol. Heart Circ. Physiol. 2004;286:H1310–H1321. doi: 10.1152/ajpheart.00561.2003. [DOI] [PubMed] [Google Scholar]
- 42.Winfree A.T. A spatial scale factor for electrophysiological models of myocardium. Prog. Biophys. Mol. Biol. 1998;69:185–203. doi: 10.1016/s0079-6107(98)00007-8. [DOI] [PubMed] [Google Scholar]
- 43.Allbritton N.L., Meyer T., Stryer L. Range of messenger action of calcium ion and inositol 1,4,5-trisphosphate. Science. 1992;258:1812–1815. doi: 10.1126/science.1465619. [DOI] [PubMed] [Google Scholar]
- 44.Fabiato A. Two kinds of calcium-induced release of calcium from the sarcoplasmic reticulum of skinned cardiac cells. Adv. Exp. Med. Biol. 1992;311:245–262. doi: 10.1007/978-1-4615-3362-7_18. [DOI] [PubMed] [Google Scholar]
- 45.Tang Y., Othmer H.G. A model of calcium dynamics in cardiac myocytes based on the kinetics of ryanodine-sensitive calcium channels. Biophys. J. 1994;67:2223–2235. doi: 10.1016/S0006-3495(94)80707-6. [DOI] [PMC free article] [PubMed] [Google Scholar]
- 46.Ohara T., Qu Z., Karagueuzian H.S. Increased vulnerability to inducible atrial fibrillation caused by partial cellular uncoupling with heptanol. Am. J. Physiol. Heart Circ. Physiol. 2002;283:H1116–H1122. doi: 10.1152/ajpheart.00927.2001. [DOI] [PubMed] [Google Scholar]
Associated Data
This section collects any data citations, data availability statements, or supplementary materials included in this article.