Abstract
Current computer-aided detection (CAD) schemes for detecting mammographic masses have several limitations including high correlation with radiologists’ detection and cueing most subtle masses only on one view. To increase CAD sensitivity in cueing more subtle masses that are likely missed and/or overlooked by radiologists without increasing false-positive rates, we investigated a new case-dependent cueing method by combining the original CAD-generated detection scores with a computed bilateral mammographic density asymmetry index. Using the new method, we adaptively raise CAD-generated scores of regions detected on “high-risk” cases to cue more subtle mass regions and reduce CAD scores of regions detected on “low-risk” cases to discard more false-positive regions. A testing dataset involving 78 positive and 338 negative cases was used to test this adaptive cueing method. Each positive case involves two sequential examinations in which the mass was detected in “current” examination and missed in “prior” examination but detected in a retrospective review by radiologists. Applying to this dataset, a pre-optimized CAD scheme yielded 75% case-based and 55% region-based sensitivity on “current” examinations at a false-positive rate of 0.25 per image. CAD sensitivity was reduced to 42% (case-based) and 27% (region-based) on “prior” examinations. Using the new cueing method, case-based and region-based sensitivity could maximally increase 9% and 33% on the “prior” examinations, respectively. The percentages of the masses cued on two views also increased from 27% to 65%. The study demonstrated that using this adaptive cueing method enabled to help CAD cue more subtle cancers without increasing false-positive cueing rate.
Keywords: Computer-aided detection (CAD), Digital mammography, Bilateral mammographic density asymmetry, Mass detection
I. INTRODUCTION
Breast cancer is the most prevalent cancer among the women over age of 40 years old worldwide (Jemal et al 2010). Scientific evidence has shown that earlier cancer detection significantly reduced patients’ mortality and morbidity rates (Tabar et al 2001). Since the majority of breast cancers are detected in women without any known risk factors (Madigan et al 1995), a uniformly applied cancer screening programs in the general population (e.g., women over age of 40 in USA or women over age of 50 in many countries in Europe without known elevated risk factors) is considered important and efficacious. Although a number of screening tools have been developed and tested, mammography is the only clinically accepted imaging modality for screening the general population to date (Smith et al 2011). However, interpreting mammograms is difficult and time-consuming due to the variability of depicted breast abnormalities, overlapping dense fibro-glandular tissue on the projected images, and low cancer prevalence in the screening environment (Buist et al 2011). As a result, detection sensitivity and specificity of screening mammography is not optimal (Fenton et al 2006). Although image double-reading could significantly improve performance of screening mammography (Thurfjell et al 1994), it is not a practical choice in the clinical practices of the most countries around the world. Hence, the computer-aided detection (CAD) schemes were developed and tested as “a second reader” to assist radiologists when interpreting screening mammograms (Gilbert et al 2006). While studies showed that using CAD helped radiologists detect more cancers associated with micro-calcification clusters (Freer et al 2001), the success in using current CAD for improving detection of cancers associated with mass-like abnormalities has been less than overwhelming (Gur et al 2004a). Several large multi-institutional observational studies have showed that using CAD actually reduced radiologists’ performance of reading screening mammograms in the clinical practice (Fenton et al 2007, Fenton et al 2011). Therefore, some researchers believe that CAD, in its present form, is not an optimal or effective aid for screening mammography (Nishikawa et al 2006a) and many radiologists in general largely ignore CAD-cued mass-like regions in the clinical practice due to their low confidence in the CAD-cued results (Zheng et al 2006a).
Besides the relatively higher false-positive detection rates, previous studies have shown that current mammographic CAD for mass detection also has two other major limitations. First, there is high correlation between CAD and radiologists’ detection results (Gur et al 2004b). When using CAD as “a second reader,” cueing the “easy” mass regions that can be easily detected by radiologists (“the first reader”) is not helpful. Second, similar to the false-positive cues, CAD cues most subtle mass-like abnormalities only in one image (either craniocaudal (CC) or mediolateral oblique (MLO) view). As a result, radiologists are likely to discard these CAD-cued positive regions as the false-positives in both prospective and retrospective studies (Khoo et al 2005. Nishikawa et al 2006b). Thus, although the commercialized CAD schemes are currently available and have been routinely used in the clinical practice of many medical institutions, studies continue in the hope of improving CAD performance in detecting subtle masses and increasing radiologists’ confidence in CAD-cued results as related to “mass-like” identifications. These efforts include but not limited to: (1) developing dual CAD schemes that combine separate schemes optimized with “average” and “difficult” mass region groups (Zheng et al 2003, Wei et al 2006), (2) selecting optimal image features with higher discriminatory power (Hupse et al 2010) and fusing different classifiers based on different image feature sets (Park et al 2009); (3) developing multi-view based CAD schemes that use matched image features computed from a mass projected on two views to improve detection performance (Zheng et al 2006b, Velikova et al 2009); and (4) developing interactive CAD schemes using a content-based image retrieval approach that provides radiologists “visual-aid” to increase their confidence in accepting CAD-cued results (Zheng et al 2007, Mazurowski et al 2008). However, none of these approaches has been integrated into the commercial CAD schemes and routinely used in the clinical practice, to date.
Although CAD schemes are able to detect a high fraction of subtle masses that are likely to be missed and/or overlooked by radiologists (Birdwell et al 2001), to maintain the acceptable false-positive cueing rates, current CAD use an universal operating threshold that only cues the “easy” mass regions (with CAD-generated detection scores ≥ operating threshold) while discarding the “difficult” positive regions (with scores < operating threshold). To reduce the high correlation of mass detection between radiologists and CAD without increasing false-positive cueing rate, this study investigated and tested a different approach. Our hypothesis is that by adaptively changing the final CAD cueing scores of detected suspicious mass regions depicted on different cases based on a specific case-based index, CAD is able to cue more subtle mass regions depicted on high risk or “difficult” cases by raising their CAD-cueing scores (above the CAD operating threshold) and discard more false-positive regions depicted on low risk or “easy” cases by reducing their scores (below the operating threshold). As a result, without changing and/or re-optimizing the existing CAD schemes, CAD can actually cue more subtle mass regions that are likely to be missed or overlooked by radiologists while maintaining the overall false-positive cueing rate on a diverse negative dataset. To test this hypothesis, we proposed a new adaptive CAD cueing approach (Figure 1). Using this approach, each original CAD-generated detection score will be adaptively changed into a new cueing score based on a case-dependent index. CAD system will then cue all suspicious regions whose adjusted new cueing scores are greater than CAD operating threshold and discard the other suspicious regions with the new cueing scores smaller than the operating threshold. The goal of this study is to assess whether using this new adaptive cueing method, CAD can cue more subtle masses that are not reported by radiologists in their original image reading and also cue more subtle masses on both CC and MLO view images.
Figure 1.
Illustration of a new adaptive CAD cueing approach.
II. MATERIALS AND METHODS
2.1. Image Dataset and a CAD scheme
In this study, we assembled a special image dataset. From an existing full-field digital mammography (FFDM) image database previously reported (Zheng et al 2011), we selected all of 78 positive cases that meet the requirement of this study and 338 available negative cases. Each selected positive case should involve two sequentially acquired screening FFDM examinations. In the “current” (the second) examination, a malignant mass was detected by the radiologist in the original image reading and verified by the biopsy and pathology analysis, while the “prior” (the first) examination was originally interpreted as negative by the radiologist. However, in the retrospective review (with the availability of the “current” images and diagnostic reports) the suspicious mass regions depicted on the “prior” images were also marked and interpreted as detectable by radiologists. Thus, two sets of FFDM images acquired from both “current” and “prior” examination were selected for each case and included in our dataset. Each examination (including both positive and negative case) contains four FFDM images representing both CC and MLO view images acquired from the left and right breast of a woman. The positive case group involves a total of 624 images (in which 312 are “current” images and 312 are “prior” images). For the negative cases, we only selected images acquired from one (the “current”) FFDM examination for each case resulting in a total of 1352 FFDM images in 338 cases. Each negative case has maintained negative (cancer-free) status for at least two sequentially annual FFDM examinations after the selected examination of interest in this dataset. The distributions of the image characteristics of our database including mass boundary categories (i.e., smooth, irregular, spiculated, and focal asymmetry) and case-based mean mammographic tissue density (e.g., BIRADS ratings of cases) have been previously reported (Zheng et al 2010).
A pre-developed CAD scheme to detect mass regions depicted on FFDM images (Zheng et al 2011) was applied (“as is”) to detect suspicious mass regions depicted on each of 1976 FFDM images in our testing dataset. In brief, this scheme includes three image processing and feature classification steps. The first step applies a difference-of-Gaussian filtering method to search for and identify suspicious mass regions. This step typically identifies between 10 and 50 suspicious regions per image depending on breast tissue density and pattern distribution. The upper level of CAD sensitivity is determined by this step. The second step applies a multilayer topographic region growth and active contour algorithm to segment suspicious mass regions and determine its boundary contour. In each suspicious region initially detected in the first step, the algorithm searches for a growth seed with local minimum value. A growth threshold for each topographic growth layer is adaptively determined by computed region’s local contrast. A set of classification rules related to the region size, circularity, shape factor, and inter-layer growth ratio is applied to delete the false-positive regions. After passing through three growth layers, an active contour algorithm is applied to determine the final boundary contour of the growth region. This step typically eliminates over 80% of initially identified suspicious regions and reduces the number of the growth regions to ≤ 5 per image. The third step computes a set of morphology and pixel-value (intensity) distribution based image features from each mass region detected in the second step and then applies a pre-optimized multi-feature-based artificial neural network (ANN) to classify this region by generating a detection score indicating the likelihood of the region associating with a positive (malignant) mass. Finally, a pre-determined operating threshold is applied to cue (mark) the detected suspicious mass regions in which the CAD-generated detection scores are greater than the threshold, while the other regions with detection scores smaller than the threshold are discarded (not-cued).
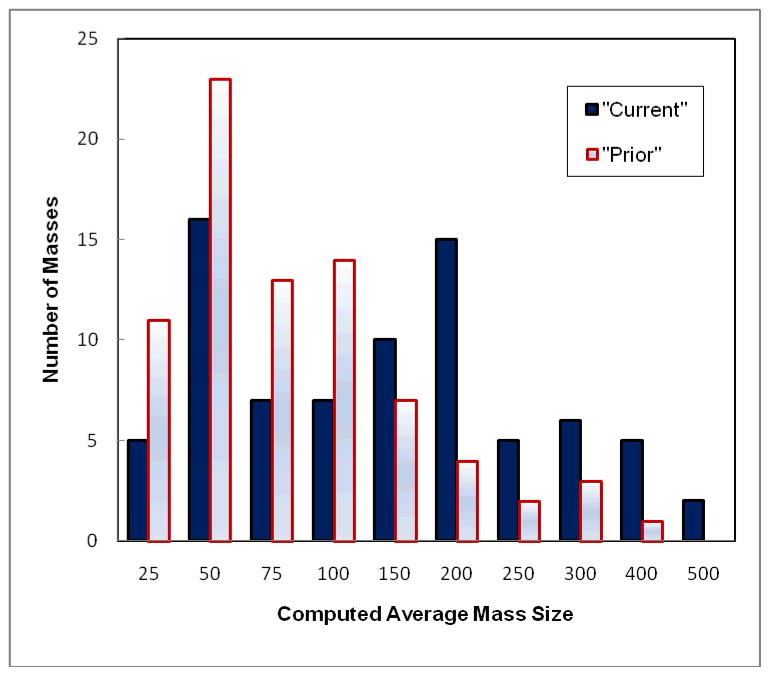
Figure 2 shows and compares histograms of the average mass sizes computed from the CC and MLO view of the “current’ and “prior” images, respectively. The figure shows the trend of increase of mass size from the “prior” to “current” examinations. Specifically, the average size of 78 masses computed from the “prior” images is 75.5 mm2 ranging from 9.7 mm2 to 287.8 mm2, while the computed average mass size in this dataset increases to 110.2 mm2 ranging from 15.7 mm2 to 491.3 mm2 in the “current” examinations.
Figure 2.
Comparson of histograms of average mass size (mm2) computed from two (CC and MLO) view images of 78 masses depicted on the “current” and “prior” examinations.
2.2. A bilateral mammographic density asymmetry index
Although a number of mammographic image features can be computed and used as the case-dependent indices to indicate the case difficulty and/or cancer risk (i.e., mammographic density [Oliver et al 2010] and breast volume differnece [Scutt et al 2006]), we selected the bilateral mammographic density asymmetry as a testing index in this study. Our previous study suggested that the bilateral mammographic density asymmetry had a higher discriminatory power to predict the risk of each individual case being developing breast cancer (Wang et al 2011). In addition, radiologists routinely use the bilateral mammographic density asymmetry (in particular the matched regional based density asymmetry) information to detect suspicious mass regions in interpreting mammograms in the clinical practice. Hence, we used a simple image feature related to the bilateral mammographic density asymmetry measured or computed from two images of the left and right breast as a case-dependent cueing index to adaptively adjust the final CAD cueing scores of the suspicious regions depicted on different cases.
For each case, we computed bilateral mammographic density asymmetry by selecting two CC view images acquired from both the left and right breast. First, we applied a pre-developed computing algorithm (Zheng et al 2006b) to segment breast tissue area by assuming that a transition curve with the smoothest curvature between breast tissue and air background represents the segmentation boundary (skin–air interfaces). For this purpose, an iterative searching method was applied to detect the smoothest curvature between breast tissue and the air background. After segmenting the entire breast area with N pixels depicted on one image, we computed the average pixel value or intensity (Ik, k = 1,2,…, N) of the entire segmented breast area, to represent the mean mammographic density (Chang et al 2002). We then computed the absolute difference between ĪL (left breast) and ĪR (right breast), ΔĪ = |ĪL − ĪR|, to represent the bilateral mammographic density asymmetry.
Since the original CAD-generated detection scores range from 0 to 1, the computed feature (ΔĪ) values were also normalized to the range of [0, 1] using a simple method (Zheng et al 2007). In brief, we computed the mean (μ) and the standard deviation (σ) of 494 (ΔĪ) values (including those computed from 156 “current” and “prior” positive examinations and 338 negative examinations) in the image dataset. The computed interval [μ − 3σ, μ + 3σ] of ΔĪ is normalized between 0 and 1. Any values falling outside the interval range (outliers) are assigned to either 0 (<μ − 3σ) or 1 (>μ+ 3σ).
2.3. A new CAD-cueing method
To adaptively change or adjust the original CAD-generated detection score (Sorg) of a detected suspicious mass region based on the computed bilateral mammographic density asymmetry score (ΔĪ) of the case depicting this detected region, we can plot a two-dimensional scatter diagram between Sorg and ΔĪ′ (Figure 2). We then project each original CAD score (Sorg) into a new cueing reference line using the following rotation or projection equation to compute a new CAD cueing score (Snew):
| (1) |
where α is an angle between the projection (reference) line and the horizontal axis (ΔĪ = 0) and tan(α) is the slope of the projection line to the horizontal axis. When α= 0, Snew = Sorg. As the projection line slope increases, ΔĪ has more weight on the new cueing score Snew. It will lift (raise) regions’ new cueing scores in the cases with greater ΔĪ values and reduce regions’ cueing scores in the cases with smaller ΔĪ values.
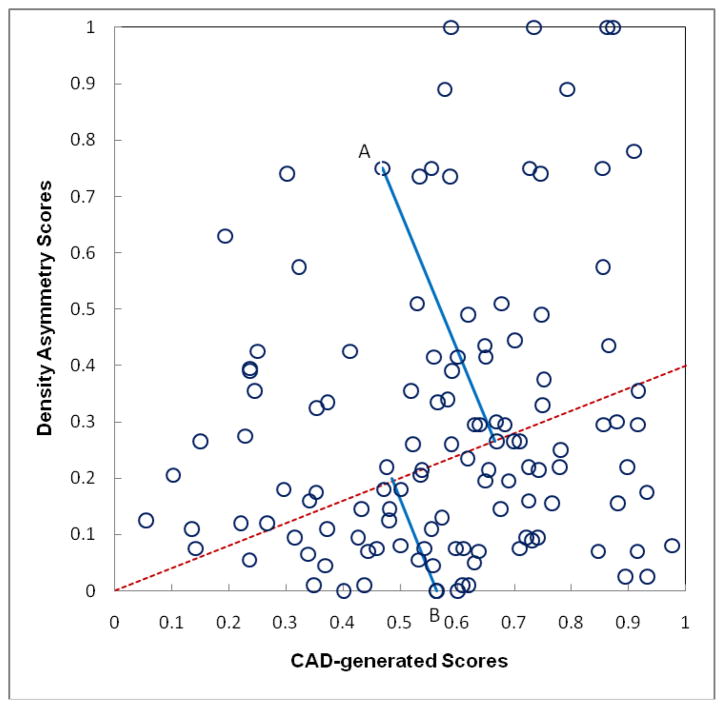
To explain how this new adaptive cueing approach enables to cue some more subtle mass regions (with original CAD-generated detection scores < CAD operating threshold) and discard some “easier” mass regions (with CAD scores ≥ CAD operating threshold), we can take two marked suspicious mass regions (A and B) in Figure 3 as examples. The original CAD-generated detection scores (Sorg) for two regions (A and B) are 0.47 and 0.56, respectively. Assuming the CAD operating threshold is T = 0.55 in our original CAD scheme (Gur et al 2004b), region B will be marked (cued) and region A is discarded (not-cued). However, because region A is located on a “high-risk” case with greater bilateral mammographic density asymmetry score (ΔĪ′ =0.75), when projecting the region into a new reference line (the dash line as shown in Figure 3), its new cueing score computed by equation (1) is Snew = 0.65, while the new cueing score Snew is reduced to 0.50 for region B because its ΔĪ′ =0.0. As a result, using the new cueing approach, the originally un-cued lower score region A will be cued and the originally cued higher score region B is discarded.
Figure 3.
Illustration of adaptively changing CAD-generated detection scores based on bilateral mammographic density asymmetry score by projecting the original CAD scores into a new scoring reference line (as shown in dashed line).
2.4. CAD cueing performance evaluation and comparison
To evaluate and compare CAD performance under two cueing approaches, we computed and plotted a number of free-response receiver operating characteristic (FROC) curves. We generated each FROC curve in two steps. The detection scores of all suspicious mass regions (including both true-positive and false-positive regions) are first used as input values of a maximum likelihood statistical data analysis based ROC fitting program (ROCKIT, http://www-radiology.uchicago.edu/krl/) to generate a quasi-ROC type performance curve. The FROC curve is then generated by linearly stretching the quasi-ROC curve into the maximum false-positive rate (in horizontal axis) and the maximum detection sensitivity (in vertical axis). This simple and easy to be computed method has shown in our previous study that it could generate very comparable FROC curves generated using more advanced and complicated FROC models (Yoon et al 2007).
Since our goal in this study is to cue more “difficult” masses in the “prior” images of the positive cases of our dataset as well as to cue more masses on both CC and MLO view images without increasing false-positive cueing rate in the group of negative cases, from the FROC curves we used detection sensitivity at 0.25 false-positive per image as the evaluation criterion of CAD cueing performance. This false-positive cueing rate is very comparable or lower than the false-positive rates of current commercialized CAD schemes (Gur et al 2004b). We then systematically investigated and detected the trend between the projection line slope (as shown in Figure 3) and the cueing performance. The results are then tabulated and compared.
III. RESULTS
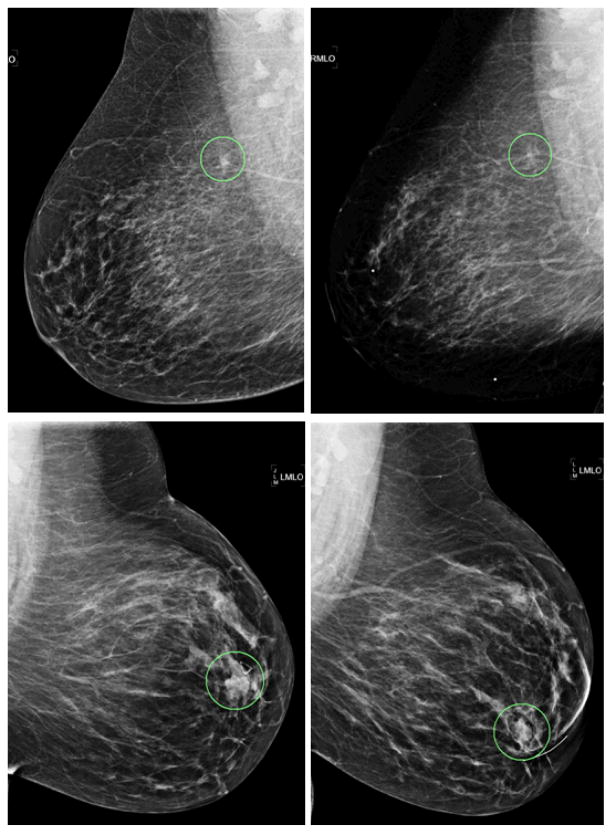
Figure 4 shows two examples that compare (1) two masses depicted on the “current” and “prior” images, and (2) the difference of CAD-cueing results between using the conventional CAD threshold method and the new case-dependent cueing method. Two masses depicted on the “current” images (as shown in the left column of Figure 4) have larger size and higher contrast (or conspicuity) than those depicted on the “prior” images (the right column of Figure 4). Two “prior” mass regions correspond to the two circles (“A” and “B”) plotted in Figure 3, respectively. As explained in previous discussion of Figure 3, CAD was originally able to cue the bottom-right mass region (“B”) and discarded the top-right mass region (“A”) based on CAD-generated detection scores. However, when using the new case-dependent cueing scores, region (“A”) was cued and region (“B”) was discarded.
Figure 4.
Example of two masses with different CAD cueing results. Left column are two “current” images of two cases and the right column are two corresponding “prior” images. The true-positive mass regions are circled in all four images. Two “prior” mass regions depicted on the top-right and bottom-right images correspond to “A” and “B” circles as shown in Figure 3, respectively.
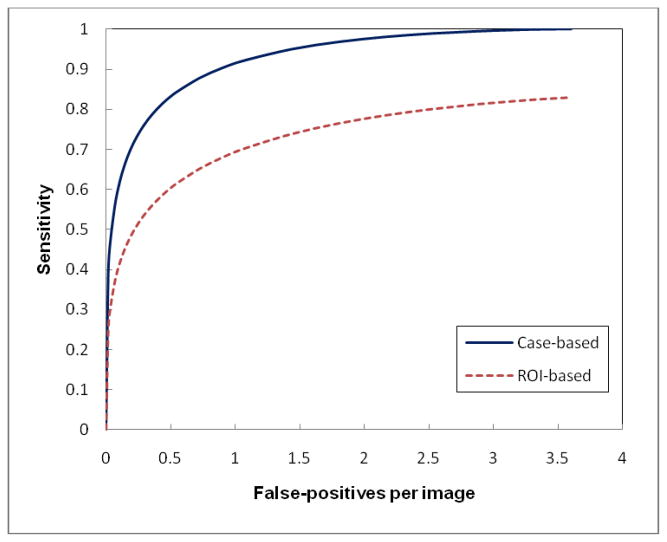
Figure 5 shows two FROC performance curves when applying our original CAD scheme to the “current” examinations of 78 positive and 338 negative cases. All cancers in the “current” examinations were detected by radiologists in the original image reading and interpretation. At the maximum false-positive rate of 3.6 per image, CAD detected all of these “easy” masses (cancers) by achieving 100% case-based sensitivity. Among these positive masses, 67% (52/78) were detected by CAD on both CC and MLO views resulting in detecting 130 mass regions with the maximum of 83% region-based sensitivity. By setting up a CAD operating threshold to yield a false-positive rate of 0.25 per image, CAD finally cued 75% (59/78) true-positive masses and 54% (85/156) mass regions. Among the 59 cued masses, 26 were cued by CAD on both CC and MLO views (44%).
Figure 5.
Two FROC-type performance curves representing performance of applying our original CAD scheme to our testing dataset with “current” examinations of 78 positive cases and 338 negative cases.
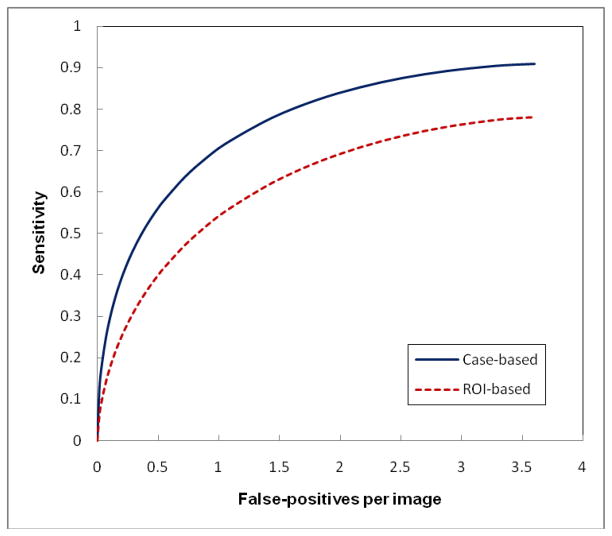
Figure 6 shows two FROC curves when applying our original CAD scheme to the “prior” examinations of 78 positive cases and the “current” examinations of 338 negative cases. All “cancers” in the “prior” examinations were missed and/or overlooked by radiologists in the original image reading but they were considered detectable in the retrospective review. Although CAD performance level (detection sensitivity on these “difficult” masses) is substantially lower as comparing to detect “easy” masses in the “current” examinations, CAD was able to detect a high fraction of these “difficult” masses with the maximum sensitivity levels of 91% (case-based) and 78% (region-based). However, these “difficult” mass regions typically have lower CAD-generated likelihood scores. Thus, the final cueing sensitivity levels are 42% (case-based) and 27% (region-based) at 0.25 false-positives per image. Among 33 cued masses, 9 were cued on both CC and MLO view (27%).
Figure 6.
Two FROC-type performance curves representing performance of applying our original CAD scheme to our testing dataset with “prior” examinations of 78 positive cases and “current” examinations of 338 negative cases.
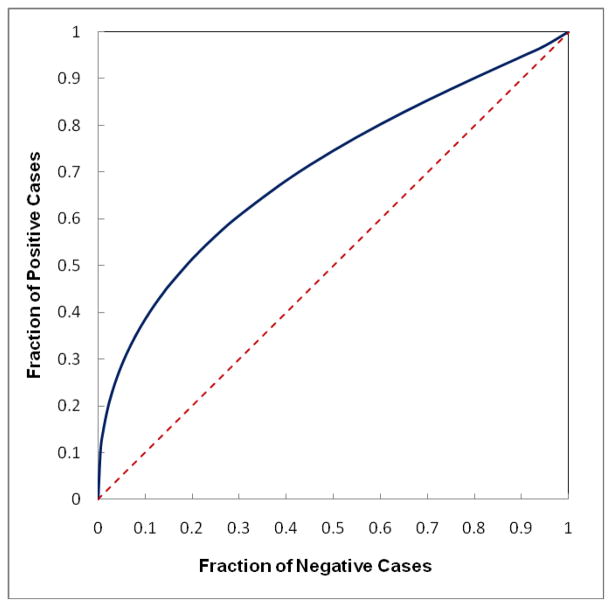
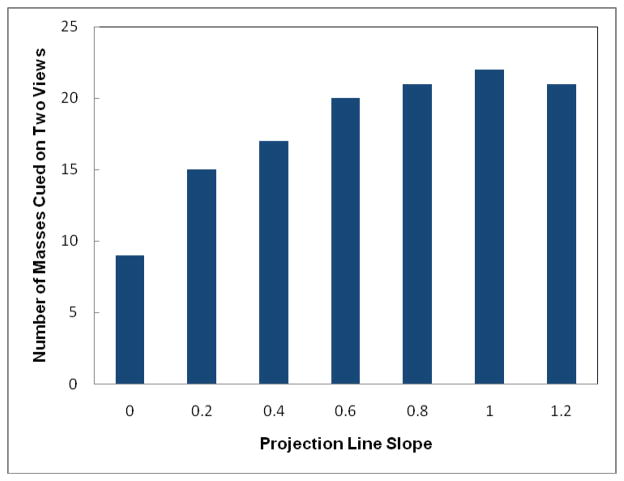
Figure 7 shows a ROC-type performance curve to classify between “prior” examinations of 78 positive cases and “current” examinations of 338 negative cases using the computed bilateral mammographic density asymmetry scores. The area under ROC curve is 0.702±0.032, which indicates that the positive cases in general have greater bilateral mammographic density asymmetry than the negative cases probably due to the development of mass-like abnormality in one breast. As a result, by increasing the slope of the new scoring projection line (Figure 3) to put more cueing weights on cases with greater bilateral mammographic density asymmetry, the number of masses and mass regions cued by CAD also gradually increases until reaching the maximum and then starts going down (as shown in Tables 1 and 2). Using this new cueing method, CAD is able to maximally increase case-based cueing sensitivity by 9.1% (at projection line slope = 0.4) and region-based sensitivity by 33.3% (at projection line slope = 0.8) without increasing false-positive cueing rates. At these maximum performance levels, the number of masses cued is increased from 33 to 36 and the number of cued mass regions is increased from 42 to 56. The results also show that although using new cueing method CAD is able to cue additional mass regions with the original CAD-generated detection scores smaller than the CAD operating threshold (Sorg < T), CAD also discards a few mass regions with Sorg ≥ T. Meanwhile, when applying the original CAD cueing method, 9 out of 33 cued masses were cued (marked) on two (CC and MLO) view images (27%). Using the new cueing method, the number of masses cued on two views can also substantially increase to 22, representing 65% of 34 cued masses at projection line slope = 1.0 (as shown in Figure 8).
Figure 7.
A ROC-type performance curve to classify between the “prior” examinations of 78 positive cases and the “current” examinations of 338 negative cases using the computed bilateral mammographic density asymmetry scores (solid line curve) with the area under ROC curve (AUC = 0.702). The dash line is a reference line with AUC = 0.5.
Table 1.
Case-based comparison of the total number of masses cued by changing the scoring projection line slopes including the number of cued masses with original CAD-generated scores (Sorg) greater than the cueing threshold (T) and the number of cued masses with Sorg < T at a false-positive rate of 0.25 per image.
| Projection line slope (tan(α)) | Total number of cued masses | Cued masses with Sorg ≥ T | Cued masses with Sorg < T | Increase of Sensitivity (%) |
|---|---|---|---|---|
| 0.0 | 33 | 33 | 0 | N/A |
| 0.2 | 35 | 32 | 3 | 6.1% |
| 0.4 | 36 | 31 | 5 | 9.1% |
| 0.6 | 35 | 29 | 6 | 6.1% |
| 0.8 | 35 | 28 | 7 | 6.1% |
| 1.0 | 34 | 26 | 8 | 3.0% |
| 1.2 | 34 | 25 | 9 | 3.0% |
Table 2.
Mass region based comparison of the total number of mass regions cued by changing the scoring projection line slopes including the number of cued regions with original CAD-generated scores (Sorg) greater than the cueing threshold (T) and the number of cued regions with Sorg < T at a false-positive rate of 0.25 per image.
| Projection line slope (tan(α)) | Total number of cued regions | Cued regions with Sorg ≥ T | Cued regions with Sorg < T | Increase of Sensitivity (%) |
|---|---|---|---|---|
| 0.0 | 42 | 42 | 0 | N/A |
| 0.2 | 49 | 41 | 8 | 16.7% |
| 0.4 | 53 | 40 | 13 | 26.2% |
| 0.6 | 55 | 37 | 18 | 31.0% |
| 0.8 | 56 | 36 | 20 | 33.3% |
| 1.0 | 56 | 35 | 21 | 33.3% |
| 1.2 | 53 | 32 | 21 | 26.2% |
Figure 8.
The relationship between the number of masses cued on two views and the change of scoring projection line slopes.
IV. DISCUSSION
Unlike detecting cancers associated with micro-calcification clusters in which CAD could achieve higher sensitivity than radiologists (Freer et al 2001), current CAD schemes for detecting mammographic mass-like abnormalities (or cancers) have lower performance than radiologists (including both lower sensitivity and higher false-positive cueing rate) and thus CAD was approved to be used as “a second reader.” Radiologists should first read and interpret mammograms to detect suspicious abnormalities before viewing CAD results. Under such application environment, in order to really help radiologists detect more subtle mass-like cancers at earlier stage without significantly increasing false-positive (recall) rates, CAD should meet two requirements without increasing false-positive cueing rates. First, since cueing more “easy” masses that are easily detected by radiologists with and without CAD is not very helpful, CAD should reduce its correlation with radiologists’ detection by cueing more subtle masses that are likely missed and/or overlooked by radiologists although CAD may need to pay a price to discard (not cue) some “easy” masses that have already been detected by radiologists before viewing CAD-cued results. Second, since radiologists are likely to ignore or discard the subtle true-positive masses cued by CAD only on one view as false-positive cues, CAD should cue more subtle masses on both CC and MLO views to increase radiologists’ confidence to correctly accept CAD cueing results.
Although many CAD schemes can initially detect a high fraction of subtle masses, most subtle masses with lower detection scores are not cued (discarded) to maintain an acceptable false-positive cueing rate. Based on FROC curve of a CAD scheme, simply reducing cueing threshold, CAD can increase cueing sensitivity at a cost of increasing false-positive rates. For example, in this study following the FROC curve (as shown in Figure 6) one could increase case-based cueing sensitivity on the “prior” cases from 42% (33/78) to 46% (36/78) by simply reducing CAD cueing threshold. However, the false-positive rate will also be increased from 0.25 to 0.33 per image, which means cueing additional 108 false-positive regions in our negative case group. Meanwhile, to increase the region-based sensitivity from 27% (42/156) to 36% (56/156) by reducing the cueing threshold, CAD will increase the false-positive rate from 0.25 to 0.41 per image. To overcome this limitation, we in this study tested a new CAD cueing concept that is case-dependent. The actual CAD cueing performance level does not follow the original FROC curve of the CAD scheme. As a result, this new cueing concept has a unique characteristic to potentially increase sensitivity of cueing “difficult” cases without increasing false-positive cueing rates. To demonstrate the feasibility of such a new cueing concept, we tested a unique approach to conduct the case-dependent CAD cueing by using a bilateral mammographic density asymmetry index to guide CAD cueing. The method aims to increase CAD sensitivity in detecting “difficult” masses by selecting and cueing a fraction of mass regions with original CAD-generated detection scores that are lower than the CAD operating threshold without increasing the overall false-positive detection rates. To combine (or fuse) the original region-based CAD scores and the computed bilateral mammographic density asymmetry index, we created a reference (projection) line. Each original CAD-generated detection score is projected to this new reference line to generate a new cueing score. The new converted cueing scores are then used to determine which suspicious regions are cued and which are discarded. Using a special group of “difficult” positive cases (the “prior” images of positive cases in which masses were not detected by radiologists in their original image reading but confirmed as “detectable” in the retrospective image review), our experiment demonstrated that using this new cueing approach, our CAD was able to cue more subtle masses (e.g., 9%) and more subtle masses on two view images (e.g., 244% increase from 9 to 22 masses in our dataset) while maintaining the false-positive cueing rate of 0.25 per image on the same group of 338 negative cases in our dataset.
We emphasize that this is just a preliminary technology development study with a number of limitations. First, due to the small dataset with only 78 “prior” positive cases, the robustness of this new case-dependent CAD cueing approach has not been independently evaluated. Second, we did not asked radiologists to retrospectively rate the “difficult” levels of the masses in our database. Hence, we only evaluated the overall CAD performance on our entire dataset used in this study. The CAD performance level variation on different sub-groups of cases (i.e., based on mass size and the subjectively “difficult” level ratings) has not been assessed. Third, we only used a very simple image feature to represent the bilateral mammographic density asymmetry in this study. This may not be an optimal feature. Using a classifier involving multiple image features may further improve the results in classifying between high and low risk cases as demonstrated in previous studies (Wang et al 2010, Wei et al 2011). In addition, the potential clinical utility of this new approach has also not been tested by radiologists. Specifically, although using this new cueing method CAD is able to cue additional mass regions with originally lower CAD-generated detection scores and maintain the overall false-positive cueing rate (e.g., 0.25 per image), CAD also discards some of previously cued mass regions with higher detection scores and may cue a fraction of different false-positive regions in the same set of negative cases. As a result, similar to the positive cases, some negative cases with higher bilateral mammographic density asymmetry level can also have increased false-positive cues and others have less false-positive cues. How these two issues could actually affect radiologists’ performance in reading and interpreting screening mammograms needs to be investigated and assessed in future retrospective or prospective type observer performance studies. Despite these limitations (or unsolved issues) we believe that the new case-dependent CAD cueing concept tested in this study is valid and all suspicious masses depicted in the “prior” examinations of our dataset should be considered “difficult” in the mammographic screening environment. Hence, developing and testing the similar new CAD-cueing approach to improve CAD performance in the detecting more difficult cases alone is important and has scientific merit because previous study have demonstrated an improvement in radiologists’ performances when using “highly performing” CAD, while radiologists’ performances actually reduced when using “poorly performing” CAD with lower cueing sensitivity on difficult cases and high false-positive cueing rates (Zheng et al 2001).
In summary, instead of applying a universally adopted CAD cueing method to all cases regardless of their cancer risk levels and/or other image characteristics, we in this preliminary study demonstrated a new case-dependent cueing concept with a simple approach of combining the computed bilateral mammographic density asymmetry to adaptively adjust CAD cueing scores, which increases CAD cueing sensitivity on “difficult” mass regions while maintaining the overall false-positive cueing rates. This approach is not unique only to our own CAD scheme. Since our approach does not change or re-optimize the original CAD schemes, it can be easily integrated into any other existing CAD schemes for detecting mammographic masses. Meanwhile, the tested concept of adaptively adjusting or shifting the original CAD-generated detection scores is also not only limited to a simple computed bilateral mammographic density asymmetry index (or feature) used in this study. The same concept can also be applied when one identifies and uses other more effective image features or risk indices in the future studies.
Acknowledgments
This work is supported in part by Grants CA77850 to the University of Pittsburgh from the National Cancer Institute, National Institutes of Health, USA, and the National Distinguished Young Research Scientist Award (60788101) from National Natural Science Foundation of China.
References
- Birdwell RL, Ikeda DM, O’Shaughnessy KF, Sickles EA. Mammographic characteristics of 115 missed cancers later detected with screening mammography and the potential utility of computer-aided detection. Radiology. 2001;219:192–202. doi: 10.1148/radiology.219.1.r01ap16192. [DOI] [PubMed] [Google Scholar]
- Buist DS, Anderson ML, Haneuse SJ, et al. Influence of annual interpretive volume on screening mammography performance in the United States. Radiology. 2011;259:72–84. doi: 10.1148/radiol.10101698. [DOI] [PMC free article] [PubMed] [Google Scholar]
- Chang YH, Wang XH, Hardesty LA, et al. Computerized assessment of tissue composition on digitized mammograms. Acad Radiol. 2002;9:898–905. doi: 10.1016/s1076-6332(03)80459-2. [DOI] [PubMed] [Google Scholar]
- Fenton JJ, Wheeler J, Carney PA, et al. Reality check: perceived versus actual performance of community mammographers. Am J Rotentgenol. 2006;187:42–46. doi: 10.2214/AJR.05.0455. [DOI] [PMC free article] [PubMed] [Google Scholar]
- Fenton JJ, Taplin SH, Carney PA, et al. Influence of computer-aided detection on performance of screening mammography. N Engl J Med. 2007;356:1399–1409. doi: 10.1056/NEJMoa066099. [DOI] [PMC free article] [PubMed] [Google Scholar]
- Fenton JJ, Abraham L, Taplin SH, et al. Effectiveness of computer-aided detection in community mammography practice. J Natl Cancer Inst. 2011;103:1152–1161. doi: 10.1093/jnci/djr206. [DOI] [PMC free article] [PubMed] [Google Scholar]
- Freer TM, Ulissey MJ. Screening mammography with computer-aided detection: prospective study of 12,860 patients in a community breast center. Radiology. 2001;220:781–786. doi: 10.1148/radiol.2203001282. [DOI] [PubMed] [Google Scholar]
- Gilbert FJ, Astley SM, McGee MA, et al. Single reading with computer-aided detection and double reading of screening mammograms in United Kingdom National Breast Screening Program. Radiology. 2006;241:47–53. doi: 10.1148/radiol.2411051092. [DOI] [PubMed] [Google Scholar]
- Gur D, Sumkin JH, Rockette HE, et al. Changes in breast cancer detection and mammography recall rates after the introduction of a computer-aided detection system. J Natl Cancer Inst. 2004a;96:185–190. doi: 10.1093/jnci/djh067. [DOI] [PubMed] [Google Scholar]
- Gur D, Stalder JS, Hardesty LA, et al. Computer-aided detection performance in mammographic examination of masses: assessment. Radiology. 2004b;223:418–423. doi: 10.1148/radiol.2332040277. [DOI] [PubMed] [Google Scholar]
- Hupse R, Karasemier N. The effect of feature selection methods on computer-aided detection of mammograms. Phys Med Biol. 2010;55:2893–2904. doi: 10.1088/0031-9155/55/10/007. [DOI] [PubMed] [Google Scholar]
- Jemal A, Siegel R, Xu J, Ward E. Cancer statistics. 2010, CA Cancer J Clin. 2010;60:277–300. doi: 10.3322/caac.20073. [DOI] [PubMed] [Google Scholar]
- Khoo LA, Taylor P, Given-Wilson RM. Computer-aided detection in the United Kingdom National Breast Screening Programme: prospective study. Radiology. 2005;237:444–449. doi: 10.1148/radiol.2372041362. [DOI] [PubMed] [Google Scholar]
- Madigan MP, Ziegler RG, Benichou J, et al. Proportion of breast cancer cases in the United States explained by well-established risk factors. J Natl Cancer Inst. 1995;87:1681–1685. doi: 10.1093/jnci/87.22.1681. [DOI] [PubMed] [Google Scholar]
- Mazurowski MA, Habas PA, Zurada JM, Tourassi GD. Decision optimization of case-based computer-aided decision systems using genetic algorithms with application to mammography. Phys Med Biol. 2008;53:895–908. doi: 10.1088/0031-9155/53/4/005. [DOI] [PubMed] [Google Scholar]
- Nishikawa RM, Kallergi M. Computer-aided detection, in its present form, is not an effective aid for screening mammography, (Point/Counterpoint) Med Phys. 2006a;33:811–814. doi: 10.1118/1.2168063. [DOI] [PubMed] [Google Scholar]
- Nishikawa RM, Edwards A, Schmidt RA, et al. Can radiologists recognize that a computer has identified cancer that they have overlooked? Proc SPIE. 2006b;6146:1–8. [Google Scholar]
- Oliver A, Llado X, Freixenet J, et al. Influence of Using Manual or Automatic Breast Density Information in a Mass Detection CAD System. Acad Radiol. 2010;17:877–83. doi: 10.1016/j.acra.2010.04.013. [DOI] [PubMed] [Google Scholar]
- Park SC, Pu J, Zheng B. Improving performance of computer-aided detection scheme by combining results from two machine learning classifiers. Acad Radiol. 2009;16:266–274. doi: 10.1016/j.acra.2008.08.012. [DOI] [PMC free article] [PubMed] [Google Scholar]
- Scutt D, Lancaster GA, Manning JT. Breast asymmetry and predisposition to breast cancer. Breast Cancer Research. 2006;8:R14. doi: 10.1186/bcr1388. [DOI] [PMC free article] [PubMed] [Google Scholar]
- Smith RA, Cokkindes V, Brooks D, et al. Cancer screening in the United States. CA Cancer. 2011;61:8–30. doi: 10.3322/caac.20096. [DOI] [PubMed] [Google Scholar]
- Tabar L, Vitak B, Chen HH, et al. Beyond randomized controlled trials: organized mammographic screening substantially reduces breast carcinoma mortality. Cancer. 2001;91:1724–1731. doi: 10.1002/1097-0142(20010501)91:9<1724::aid-cncr1190>3.0.co;2-v. [DOI] [PubMed] [Google Scholar]
- Thurfjell EL, Lernevall KA, Taube AS. Benefit of independent double reading in a population-based mammography screening program. Radiology. 1994;191:241–244. doi: 10.1148/radiology.191.1.8134580. [DOI] [PubMed] [Google Scholar]
- Velikova M, Samulski M, Lucas P, Karssemeijer N. Improved mammographic CAD performance using multi-view information: a Bayesian network framework. Phys Med Biol. 2009;54:1131–1147. doi: 10.1088/0031-9155/54/5/003. [DOI] [PubMed] [Google Scholar]
- Wang X, Lederman D, Tan J, et al. Computerized detection of breast tissue asymmetry depicted on bilateral mammograms: a preliminary study of breast risk stratification. Acad Radiol. 2010;17:1234–1241. doi: 10.1016/j.acra.2010.05.016. [DOI] [PMC free article] [PubMed] [Google Scholar]
- Wang X, Lederman D, Tan J, et al. Computerized prediction of risk for developing breast cancer based on bilateral mammographic breast tissue asymmetry. Med Eng & Phys. 2011;33:934–942. doi: 10.1016/j.medengphy.2011.03.001. [DOI] [PMC free article] [PubMed] [Google Scholar]
- Wei J, Chan HP, Sahiner B, et al. Dual system approach to computer-aided detection of breast masses on mammograms. Med Phys. 2006;33:4157–4168. doi: 10.1118/1.2357838. [DOI] [PMC free article] [PubMed] [Google Scholar]
- Wei J, Chang HP, Wu Y, et al. Association of computerized mammographic parenchymal pattern measure with breast cancer risk: a pilot case-control study. Radiology. 2011;260:42–49. doi: 10.1148/radiol.11101266. [DOI] [PMC free article] [PubMed] [Google Scholar]
- Yoon HJ, Zheng B, Sahiner B, Chakraborty DP. Evaluating computer aided detection algorithms. Med Phys. 2007;34:2024–2038. doi: 10.1118/1.2736289. [DOI] [PMC free article] [PubMed] [Google Scholar]
- Zheng B, Ganott MA, Britton CA, et al. Soft-copy mammographic readings with different computer-assisted diagnosis cuing environments: Preliminary findings. Radiology. 2001;221:633–640. doi: 10.1148/radiol.2213010308. [DOI] [PubMed] [Google Scholar]
- Zheng B, Good WF, Armfield DR, et al. Performance change of a mammographic CAD scheme optimized using most recent and prior image database. Acad Radiol. 2003;10:233–238. doi: 10.1016/s1076-6332(03)80102-2. [DOI] [PubMed] [Google Scholar]
- Zheng B, Chough D, Ronald P, et al. Actual versus intended use of CAD systems in the clinical environment. Proc SPIE. 2006a;6146:9–14. [Google Scholar]
- Zheng B, Leader JK, Abrams GS, et al. Multiview based computer-aided detection scheme for breast masses. Med Phys. 2006b;33:3135–3143. doi: 10.1118/1.2237476. [DOI] [PubMed] [Google Scholar]
- Zheng B, Mello-Thoms C, Wang X, et al. Interactive computer aided diagnosis of breast masses: computerized selection of visually similar image sets from a reference library. Acad Radiol. 2007;14:917–927. doi: 10.1016/j.acra.2007.04.012. [DOI] [PMC free article] [PubMed] [Google Scholar]
- Zheng B, Wang X, Lederman D, Tan J, Gur D. Computer-aided detection: The effect of training databases on detection of subtle breast masses. Acad Radiol. 2010;17:1401–1408. doi: 10.1016/j.acra.2010.06.009. [DOI] [PMC free article] [PubMed] [Google Scholar]
- Zheng B, Sumkin JH, Zuley M, et al. Computer-aided detection of breast masses depicted on full-field digital mammograms: a performance assessment. British J Radiol. 2011 doi: 10.1259/bjr/51461617. (Article in press published online on 21: February 2011) [DOI] [PMC free article] [PubMed] [Google Scholar]


