

Abstract
Chemical gradients can generate pattern formation in biological systems. In the fission yeast Schizosaccharomyces pombe, a cortical gradient of pom1p (a DYRK-type protein kinase) functions to position sites of cytokinesis and cell polarity, and to control cell length. Here, using quantitative imaging, fluorescence correlation spectroscopy and mathematical modelling, we study how its gradient distribution is formed. Pom1p gradients exhibit large cell-to-cell variability as well as dynamic fluctuations in each individual gradient. Our data lead to a two-state model for gradient formation where pom1p molecules associate with the plasma membrane at cell tips, and then diffuse on the membrane while aggregating into and fragmenting from clusters, before disassociating from the membrane. In contrast to a classical one-component gradient, this two-state gradient buffers against cell-to-cell variations in protein concentration. This buffering mechanism, together with time-averaging to reduce intrinsic noise, allows the pom1p gradient to specify positional information in a robust manner.
Introduction
Chemical gradients have long been hypothesized to underlie sensing and control of positional information in multi-cellular organisms and tissues (Lander, 2007). Gradients such as those formed by the Drosophila morphogen Bicoid can provide positional information with less than a 2% relative positional error (Gregor et al., 2007b). Gradients also provide spatial information inside single cells for processes such as morphogenesis, mitosis and cell cycle regulation (Brown and Kholodenko, 1999; Niethammer et al., 2004; Meyers et al., 2006; Fuller et al., 2008; Kalab and Heald, 2008; Chen et al., 2011). The mechanisms behind the formation and maintenance of protein gradients remain elusive. Although it has been assumed that many gradients are formed through a classic mechanism based on simple diffusion (Crick, 1970; Ashe and Briscoe, 2006), more complex variations are likely to underlie gradients in many biological contexts (Eldar et al., 2002; Gregor et al., 2007a; Spirov et al., 2009).
A poorly understood aspect of gradients is how they are able to provide sufficient precision in face of substantial biological noise. The stochastic nature of biological processes may contribute significant differences between individual cells (cell-to-cell or extrinsic noise), as well as fluctuations over time and space even within a single cell (intrinsic noise). Studies have revealed high variability among individual cells for processes such as gene expression (Elowitz et al., 2002; Raser and O’Shea, 2004; Raj et al., 2010). Noise could potentially disrupt the precision of gradient-based mechanisms that are based upon fine differences in protein concentration or activity (Gregor et al., 2007b; Tostevin et al., 2007; Saunders and Howard, 2009). It is not yet well understood what mechanisms might mitigate the effects of extrinsic and intrinsic fluctuations, although several mechanisms have been proposed, including time-averaging (Gregor et al., 2007a; Tostevin et al., 2007), spatial averaging (Gregor et al., 2007a; Erdmann et al., 2009) (both for intrinsic noise) and self-enhanced ligand degradation (Eldar et al., 2003) (for extrinsic noise).
In the fission yeast Schizosaccharomyces pombe, precise spatial information must be established for proper cell morphogenesis and cell division. These rod-shaped cells grow during interphase from their cell tips to around 14 μm in length, before entering mitosis and dividing medially (Mitchison and Nurse, 1985). The Dual-specificity tyrosine phosphorylation regulated kinase (DRYK) pom1p has been implicated in the regulation of polarity, division plane placement, and cell length sensing (Bahler and Pringle, 1998; Niccoli et al., 2003; Celton-Morizur et al., 2006; Padte et al., 2006; Martin and Berthelot-Grosjean, 2009; Moseley et al., 2009). Pom1p localizes to cell tips in a gradient-like distribution (Bahler and Pringle, 1998; Padte et al., 2006). For the regulation of cytokinesis, pom1p regulates the localization of mid1p, an anillin-like cytokinesis factor responsible for division site positioning. Mid1p localizes to a band of cortical dots near the nucleus, but in pom1 mutant cells these dots are spread over half of the cell cortex, and, as a consequence, the cells often divide slightly asymmetrically (Celton-Morizur et al., 2006; Padte et al., 2006). This phenotype suggests that pom1p is a cell tip inhibitor that prevents mid1p from accumulating at one of the cell tips (the non-growing one). Pom1p has additional mid1p-independent functions in preventing contractile rings from forming at the very ends of cells (Huang et al., 2007)and in the regulation of cell polarization, possibly through effects on the rhoGAP rga4p (Tatebe et al., 2008).
Recently, the pom1p gradient has been proposed to act as a ruler for signalling the length of fission yeast cells (Martin and Berthelot-Grosjean, 2009; Moseley et al., 2009; Pan and Chang, 2009; Moseley and Nurse, 2010), where the cells are able to sense that they are 14 μm long before entering mitosis. Pom1p contributes to the regulation of mitotic entry as part of a regulatory network of protein kinases that includes cdr2p, wee1p, and cdk1 (cdc2p). The gradient-like distribution of pom1p from cell tips and the very different localization of its targets such as mid1p and cdr2p that are in cortical dots near the middle of the cell, suggests a model for cell length control: in short cells, the pom1p gradient inhibits cdr2p activity, inhibiting entry into mitosis. As cells grow longer, the source of the pom1p gradient at the cell tips moves away, leading to a drop in the effective pom1p concentration at the medial site, and allows for the activation of cdr2p and entry into mitosis. Thus pom1p may form a morphogen-like gradient that is used to sense distances in the cell.
Here, we present a quantitative analysis of the pom1p gradient. Using a combination of experimental and computational analyses, we elucidate a mechanism for how the pom1p gradient is generated. The gradient is constructed and maintained through a highly dynamic process of pom1p associating to the plasma membrane at the cell tip, followed by diffusion on the plasma membrane. However, instead of a simple diffusion process, fission yeast employs a more complex mechanism that involves the formation of pom1p clusters on the membrane. This clustering provides a mechanism to buffer against fluctuations in concentration levels. Together with intrinsic noise reduction via time-averaging, this pom1p gradient is then able to impart significantly more precise positional information.
Results
Pom1p localizes in noisy cortical gradients
We imaged pom1p in S. pombe cells expressing a pom1-tomato-dimer fusion (Figure 1A) (Martin and Berthelot-Grosjean, 2009). This fusion protein is expressed as the only pom1 protein in the cell, from the pom1+ chromosomal locus under the control of the endogenous promoter; it was found to be functional based on its ability to regulate cell length and cdr2p and mid1p localization. To quantitatively measure the distribution of pom1p on the cortex, we developed custom software that derives image masks around the cortex, allowing us to plot fluorescence intensities as a function of d, the distance along the cortex from the center of a cell tip (Figure 1B, see also Supplemental Information).
Figure 1. Pom1p forms a dynamic and noisy gradient along the cell cortex.
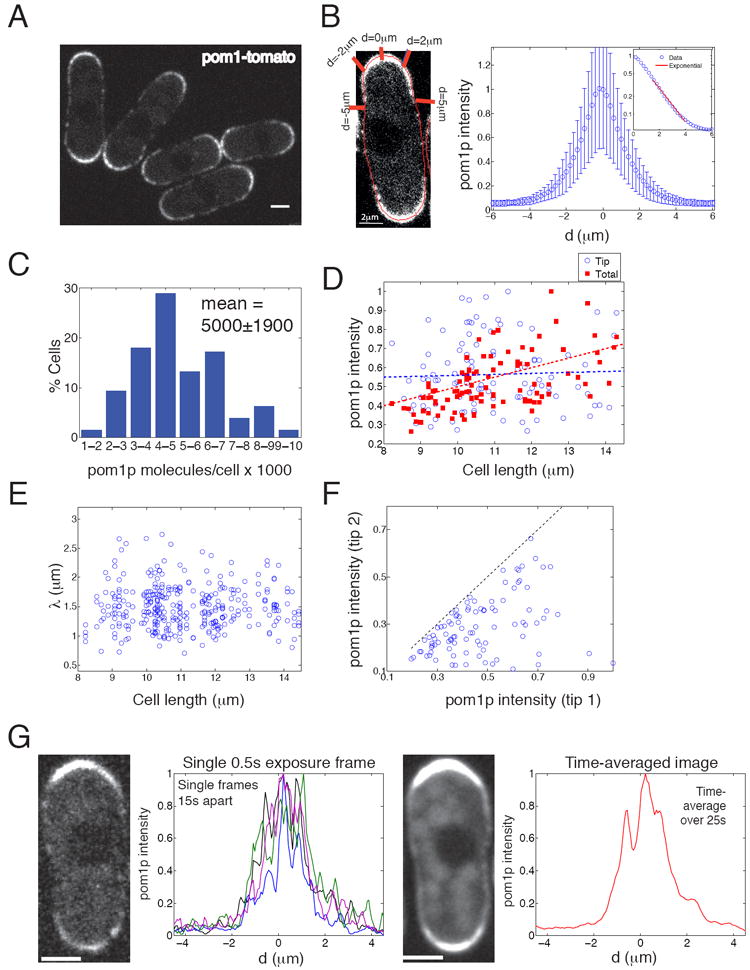
A. Confocal image of wildtype cells expressing pom1-tomato in a medial focal plane. See also Supplemental Movie 1. Scale bar = 2 μm.
B. Left: Measuring cortical intensities. A cortical mask (red) superimposed on a cell is used for measuring cortical intensities. d is defined as the distance along the cortex from the center of a cell tip. Right: Mean pom1-tomato intensity profile. Mean pom1p intensities are derived from 196 profiles from 98 cells, with each profile obtained from time lapse images acquired over 90 s. Mean maximal intensity normalized to unity. Error bars are standard deviation. Inset: Same profile but on logarithmic intensity scale. Red line is a fit to an exponentially decay curve.
C. Distribution of total number of pom1-GFP molecules per cell (number of cells analyzed=82), estimated from fluorescence intensities (see Supplemental Methods).
D. Pom1p intensity is variable; total, but not tip-region, levels correlate with cell length. Using medial slice, summed pom1-tomato intensities in cortical tip region (from tip to d=±1 μm; blue circles) and from the whole cell including cytoplasm (red squares) are plotted against cell length (n=98 for both). Each data set is normalized to maximum value independently. Data for each point is from images acquired over 90 s. For cell of length L, best fit for normalized total intensity = 0.05L, with r2 = 0.32 (dotted red line). Best linear fit for normalized tip intensity = 0.51 + 0.005L, with r2 = 0.002 (dotted blue line).
E. The decay length of the gradients does not correlate with cell length. Decay length λ was derived by fitting individual pom1p profiles imaged over 90 s to an exponential decay function. Fitted profiles with r2<0.9 excluded, giving n=161 from 98 cells.
F. Comparison of pom1p cortical cell tip region intensities (from tip to d=±1 μm) on the two cell tips in the same cell (n=98). The dashed line corresponds to equal tip intensities.
G. Time averaging can significantly decrease the effects of dynamic pom1p fluctuations. Left: single 0.5 s exposure of cell expressing pom1-tomato. Adjacent graph shows four separately normalized pom1p cortical intensity profiles from 0.5 s exposures taken 15 s apart in same cell. Right: Summed time-lapse images of the same cell taken with overall 25 s exposure time. Adjacent graph shows corresponding normalized pom1p intensity profile. Scale bar: 2 μm. See also Figure S1.
Pom1p localized on the cell cortex in a gradient-like distribution, with the highest concentrations at the cell tips and dropping to low but detectable levels at the cell middle (Figure 1A, S1A) (Padte et al., 2006; Martin and Berthelot-Grosjean, 2009; Moseley et al., 2009). Pom1p was present in the cytoplasm at low levels in a homogeneous distribution and was not detected in the nucleus (Figure 1A, S1A). On the cortex, the distribution of mean pom1p intensities showed a gradient-like profile that could be fitted to an exponential decay function Ia e - |d-d0| / λ between 1.5 μm < d < 4 μm (Figure 1B), where d is the distance along the cortex from a tip, d0 = 1.5 μm, λ is the decay length and Ia is the intensity of pom1p 1.5 μm from the cell tip. Of individual profiles, a large subset (85%; n=396) were well-fitted to this exponential decay function (r2=0.94±0.06), with a characteristic length scale λ = 1.5±0.4 μm. The small subset of profiles with poor fits (r2<0.9, 15%) had low intensity values at d=1.5 μm (on average 40% lower than for the large subset). These measurements show that pom1p exhibits an exponential decay profile that is often characteristic of gradients.
Pom1p exhibited high cell-to-cell variability. By comparing the fluorescence intensity of pom1-GFP with other GFP-fusions as standards (see Figure S1B) (Wu and Pollard, 2005), we estimated that there are approximately 5000 ±1900 molecules of pom1p per cell, with approximately 2500 molecules located at the cell tips (a tip region is defined here as the 10% of the cell closest to a cell tip). There was, however, a significant amount of cell-to-cell variability in total pom1p levels (Figure 1C, D). We tested whether this variability could be due to changes in pom1p levels during the cell cycle. In fission yeast, the cell cycle phase can be related to the length of the cell because cells grow continuously during interphase. Measurements of an asynchronous population of cells showed a weak correlation of total pom1p intensity in the cell rising with increased cell length with substantial variability (r2 = 0.32; Figure 1D, red), suggesting that the total (including cytoplasmic) concentration of pom1p stays relatively constant. The intensity of pom1p in the tip regions exhibited high variability and little correlation of intensity values with cell length (r2 = 0.002; Figure 1D, blue). We also examined if the shape of the gradient changed as a function of cell length. In the fits to exponential decay functions, we found no significant correlation of λ with cell length (Figure 1E; see Figure S1C for parameter distribution). These data suggest that the pom1p distribution at cell tips does not exhibit systematic changes with cell length and is consistent with a notion that these gradients provide absolute rather than relative positional information.
We next analyzed variability within individual cells. In each cell, there are two pom1p gradients (one at each cell tip), which were often unequal in intensity. These differences were variable, as plotted in Figure 1F. This suggested that variation in pom1p was not derived solely from differences in global expression level, but also depended on properties specific to each tip. Time-lapse images revealed no oscillations between the two tips or large changes in pom1p distributions over the 1 to 10 min time scale.
Pom1p intensities within each gradient exhibited rapid intrinsic fluctuations on a second time scale (Supplemental Movie 1). For instance, in single images (500 ms acquisition), pom1p exhibited an irregular distribution that changed on a second time scale (Figure 1G, left image). However, when multiple images of the same cell acquired over 25 s of total imaging time were computationally summed, the distribution presented a smoother gradient-like profile (Figures 1G, right image). This smooth pattern suggested that pom1p is capable of occupying all cortical locations. These data suggest that intrinsic fluctuations are potentially significant, but could be substantially reduced by a mechanism that incorporates time-averaging.
FRAP measurements of pom1p dynamics
A current model of pom1p gradient formation is that pom1p associates with the plasma membrane at cell tips via the tea1p-tea4p-dis2p complex and then diffuses on the plasma membrane before disassociating (Hachet et al., 2011). Consistent with this model, we confirmed that the peaks of pom1p and tea1p coincide at the cell tip (Figure S2A,B), and that pom1p spreads over a broader area on the cell tip than tea1p (Figure S2C-E). While this work was in review, the tea1p-tea4p complex was shown to induce the membrane association of pom1p by regulating its phosphorylation state (Hachet et al., 2011). The phosphorylated form of pom1p is cytoplasmic, and is converted at the cell tip into a unphosphorylated form by the dis2p phosphatase associated with the tea1/tea4 complex. The unphosphorylated form of pom1p then binds to the plasma membrane via a basic phospholipid binding domain, and diffuses in the membrane to form the gradient. Pom1p may disassociate from the membrane upon autophosphorylation. The gradient distribution is independent of actin, microtubules and endocytosis (Figure 2A), as well as protein degradation (Hachet et al., 2011), suggesting that a transport mechanism based primarily on protein diffusion in the membrane is indeed plausible.
Figure 2. The pom1p gradient could be formed by diffusion.
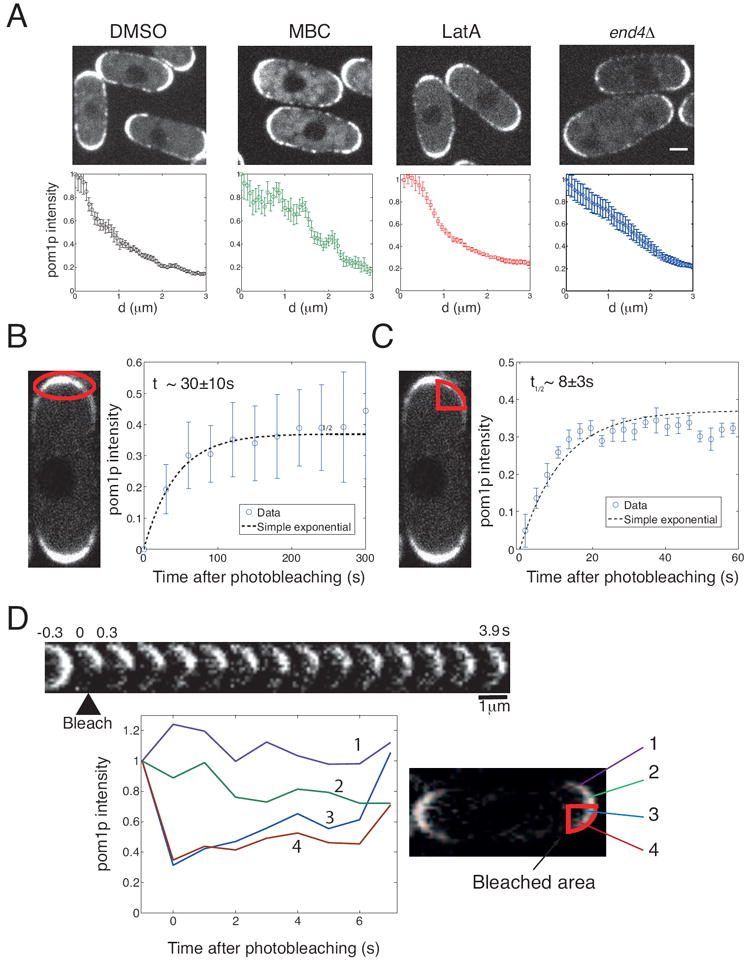
A. Pom1-tomato was imaged in cells treated with 25 μg/ml MBC (a microtubule inhibitor), 200 μM Latrunculin A (F-actin inhibitor), or DMSO (control), and in an end4Δ cell (endocytosis mutant). Graphs show mean cortical intensity profiles, with maximum normalized to unity, as function of distance d (data from 16 profiles for each condition, each imaged over 25 s); error bars: standard error of mean. Scale bar = 2 μm.
B. Whole-tip region FRAP of pom1-tomato. Left: photo-bleached area is outlined. Right: Graph shows recovery of mean tip-region fluorescence intensity in 13 cells over time. Blue circles are experimental data, and dashed black line is a fit to c0(1-(1/2)t/τ), with τ =30 s. Error bars are standard deviation.
C. Half-tip region FRAP of pom1-tomato. Left: photo-bleached area is outlined. Right: Graph shows recovery of mean half-tip region fluorescence intensity in 14 cells. Blue circles are experimental data, and dashed black line is fit to c1(1-(1/2)t/τ), with τ =8 s. Error bars are standard deviation.
D. Movement of pom1p on cell surface contributes to fluorescence recovery. Pom1-tomato on half a cell tip was photo-bleached at 0 s. Images every 0.3 s are shown. Graph shows pom1p intensity changes at different positions in the tip region. Note that the fluorescence in region 3 recovers faster than that in region 4, and conversely, fluorescence in region 2 loses intensity faster than region 1. See also Supplemental Movie 2. See also Figure S2.
To test this model, we sought to quantitate key parameters such as the rate of pom1p membrane disassociation and diffusion constants. First, we performed fluorescence recovery after photo-bleaching (FRAP) experiments (see Methods and Supplemental Information). We first photo-bleached the pom1-tomato signal over one entire cell tip. The recovery profile of the total pom1p intensity in the tip region could be fitted with a t1/2 of 30±10 s (Figure 2B). Most of the recovery came from the cytoplasmic pool, as the second unbleached tip did not change in fluorescence intensity. These results suggest that pom1p molecules remain on the plasma membrane for roughly 30 s. Second, we photo-bleached pom1-tomato over half of a cell tip (Figure 2C and Supplemental Movie Two). Although the recovery profiles were noisy, the average fluorescence recovery occurred with a t1/2 of 8±3 s. This faster half-tip FRAP time suggests that, in this case, recovery is not only from association of unbleached cytoplasmic pom1p to the cell tip, but also, more importantly, from diffusion on the membrane from the other half of the tip. Consistent with this, in some cases, pom1p appeared to spread from the unbleached zone into the bleached zone (Figure 2D). Assuming that the movement in the membrane is diffusive, our half-tip FRAP measurements provided an initial rough estimate for the diffusion constant of pom1p: the half-tip is repopulated primarily by diffusion over a distance of about 1.2 μm in around 8 s. Hence, using xrms2≈2Dhalf-tipt, we find Dhalf-tip ≈ 0.1μm2 s-1. These results provide initial evidence that pom1p diffuses in the plane of the plasma membrane.
Characterization of motile cortical pom1p clusters
To further observe the dynamics of pom1p, we imaged cells in the cortical focal plane using spinning disc confocal microscopy (Figure 3A and Supplemental Movie 3). We found pom1p in discrete clusters that were distributed all over the cortex and enriched at the cell tips. These clusters were seen with pom1-tomato-dimer, pom1-GFP, and pom1-monomeric GFP fusions (data not shown). Among clusters that could be tracked (primarily those located some distance away from the cell tips), these had an average lifetime of about 4 s (Figure 3B,C; mean lifetime τ =3.7±2.0 s (standard deviation)). In general, clusters gradually formed from a “cloud” into a discrete entity, and then gradually disassembled, although there were substantial variations in behaviors (Figure 3B). No movement of clusters into the cell interior was seen. Fluorescence intensity measurements estimate that detectable clusters contained on average about 20 pom1p molecules (Figure S3A,B), and that clusters assemble and disassemble at similar rates of 14 ±12 molecules/s (Figure S3C).
Figure 3. Pom1p forms dynamic clusters on the plasma membrane.
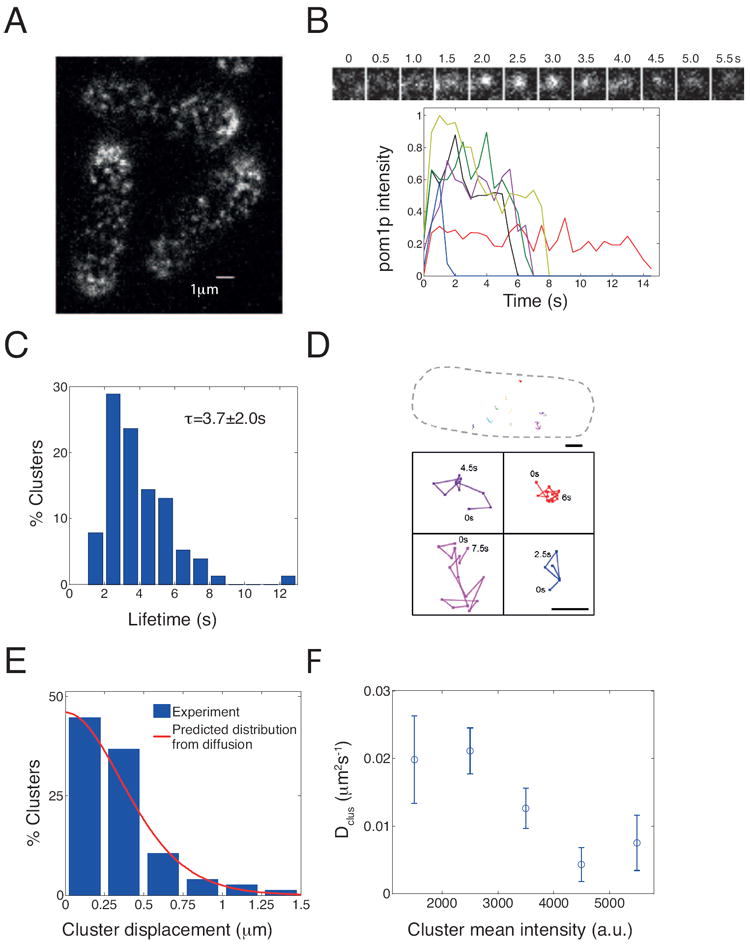
A. Confocal image of a cortical section along top of a cell expressing pom1-tomato (0.5 s exposure; see also Supplemental Movie 3).
B. Time-lapse images showing the behavior of a single pom1p cluster. Graph shows intensity tracings over time of representative clusters (normalized by maximum intensity value measured).
C. Distribution of individual cluster lifetimes (198 clusters analyzed from 7 cells).
D. Tracks of cluster movements. Top: Outline of cell with 9 cluster tracks shown. Scale bar =1 μm Bottom: Magnified view of tracks. Times mark start and finish of each track in seconds. Scale bar =0.25 μm
E. Histogram of cluster displacements (198 clusters tracked from 7 cells). Red line: predicted distribution of cluster displacements from simple diffusion (see Supplemental Information).
F. Estimated diffusion constant (extracted from overall mean square displacement) from clusters with different average intensities (116 clusters analyzed from 6 cells), showing that brighter clusters diffuse more slowly. Error bars: standard error of mean. See also Figure S3.
These transient clusters exhibited small (usually sub-micron) movements on the membrane that appeared non-directional (Supplemental Movie 3, Figure 3D). We observed no systematic pattern of movements either away or toward cell tips. The appearance and movement of clusters were unchanged upon treatment with actin or microtubule inhibitors (data not shown). The cluster displacement histogram was consistent with a model of purely diffusive cluster motion (Figure 3E and Supplemental Information). The mean root-mean-square displacement was xrms≈ 0.40±0.36 μm. Using, xrms2≈2Dclusτ, we estimate a diffusion constant of these clusters to be Dclus≈0.02±0.03 μm2 s-1. On average, larger clusters (higher intensity in regions away from the cell tip) diffused slower than smaller ones (lower intensity) (Figure 3F). Cluster formation was also independent of tea1p, tea4p and pom1p kinase activity (data not shown)(Padte et al., 2006; Hachet et al., 2011).
We next used Fluorescence Correlation Spectroscopy (FCS)(Botvinick and Shah, 2007) to further investigate the different states of pom1p. We assayed pom1-GFP behaviors at different cellular sites and orientations in wildtype and tea mutants (see Supplementary Information; Figures 4 and S4). In the cellular interior, the predominant state detected was a cytoplasmic component (Species S1), which diffused with a diffusion constant of D1 ≈ 1.5 μm2s-1; this suggests that cytoplasmic pom1-GFP is in a form larger than a monomer (e.g. intracellular soluble GFP had a diffusion constant of 7.5 μm2s-1)(Figure S4B) and has a similar behavior as the 20S anaphase promoting complex (YG and JVS, unpublished observation). We detected at least two cortical states: 1) A Species S2 with a diffusion constant D2 ≈ 0.026 μm2 s-1 (diffusion time ≈ 0.65s, Figures 4B, S4C), which has a similar diffusion constant to the clusters observed through time-lapse imaging. 2) A very slow Species S3, with a diffusion constant D3 ≈ 0.006 μm2 s-1 (diffusion time > 2.85s, Figures 4B, S4C). This very slow state is enriched at the cell tip regions (Figures 4B, S4D), and may represent pom1p in complex with cortical tea1p. This state was not measured in the earlier time-lapse analysis probably because the clusters were too dense for tracking in the tip region. Overall, these FCS studies therefore independently validate and characterize multiple pom1p states.
Figure 4. Fluorescence correlation spectroscopy analysis reveals multiple species.
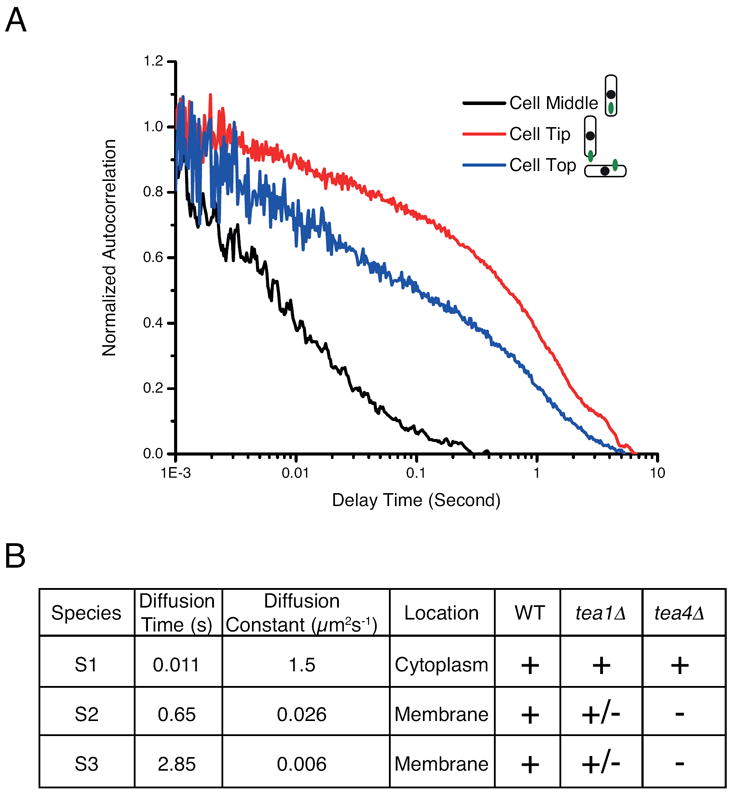
A. Autocorrelation curves of pom1-GFP. FCS measurements were made at multiple sites within wild-type cells. Each curve represents the average of six measurements in one cell. Measurements in the cell interior show rapid decay of the autocorrelation function, which can be fit to a three-dimensional diffusion model, with a cytoplasmic pom1p diffusion coefficient D1=1.5 μm2s-1 (Species S1). Measurements at the cell surface show slower decay in the autocorrelation function corresponding to increased residence time in the FCS volume. These results reveal the presence of membrane-associated species whose relative abundance changes as the probe is moved towards a cell tip.
B. Summary of pom1-GFP species detected by FCS. See also Figure S4.
We noted that our measurements on pom1p clusters are significantly different from those on more general cortical pom1p fluorescence measured by FRAP. The cluster lifetime of 4 s is much shorter than the 30 s estimated from FRAP for the pom1p membrane lifetime. The diffusion constant extracted from cluster tracking (a value also found in the FCS analysis) was 5 times smaller than that estimated previously using half-tip FRAP. These discrepancies suggested that the clusters alone do not account for the whole gradient distribution and thus indicate that the measured cortical gradient includes an additional fast moving state of pom1p, such as pom1p monomer, that is not resolved as a discrete entity using light microscopy. We note that this more rapid state was also not easily identified in FCS, as its presence is likely to be masked by the brighter, slower clusters (Tcherniak et al., 2009). Taken together, these results prompted us to consider that pom1p exists in multiple states on the cortex.
A two-state model for gradient dynamics
To rationalize the results of the above experiments and to mechanistically understand the formation of the pom1p gradient, we turned to mathematical modeling. A classical model for gradient formation is based on the localized introduction of a chemical species, after which it can diffuse before disassociation (an SDD model: source, diffusion, disassociation) (Gregor et al., 2007b). Such a model has previously been applied to the pom1p system (Padte et al., 2006; Vilela et al., 2010; Tostevin, 2011). However, such a model with only a single membrane diffusion constant and membrane lifetime is clearly inconsistent with our experimental results (see paragraph above). We therefore considered whether pom1p might exist in at least two membrane-bound forms, each with its own diffusion constant and characteristic timescale. Consequently, we developed and tested a two state (TS) gradient model.
We assume that hypophosphorylated pom1p associates with the membrane at sites marked by tea1p (Hachet et al., 2011), with a rotationally-symmetric pom1p membrane association function (peak value J) parameterised by a Gaussian fit to the tea1p spatial distribution. The membrane-associated pom1p then diffuses in the plasma membrane (assumed in the model to consist of two hemispherical caps with a connecting cylinder of radius 1.75 μm) as two interchanging states. The first state consists of slow-diffusing, short lifetime (~4 s) pom1p clusters with a diffusion constant of 0.02 μm2 s-1. The second state consists of faster-diffusing pom1p, with a diffusion constant of 0.2 μm2 s-1 and with a membrane disassociation timescale of around 30 s. This second state needs to be more rapidly diffusing with a longer lifetime in order to be consistent with the FRAP data. The diffusion constant of 0.2 μm2 s-1 is larger than the earlier estimate Dhalf-tip ≈ 0.1 μm2 s-1, due to the presence of the additional slow-diffusing state. The TS model assumes that molecules of pom1p can transition between the clustered and faster-diffusing forms while on the membrane. Simpler models with transfer only in one direction between the clustered and faster-diffusing forms did not fit the data as well (see Supplemental Information). Furthermore, while cluster fragmentation was assumed to be a linear process, we employed nonlinear cluster growth dynamics, proportional to the product of the densities of the clusters and faster-diffusing state. Such dynamics is appropriate for an aggregation phenomenon where slow-diffusing pom1p clusters can absorb colliding fast-diffusing pom1p. Moreover, such a nonlinearity ensures that as the levels of pom1p rise, the proportion of pom1p in the clustered form can increase to an even greater extent. As we will see below, this nonlinear cluster growth is the key to the noise-buffering properties of the model; two state models with a linear growth term do not exhibit this feature and fit our experimental data less well (see Supplemental Information and Figure S5). Finally, we assume that faster-diffusing pom1p can spontaneously disassociate from the membrane into the cytoplasm. Although we do not explicitly include pom1p autophosphorylation (Hachet et al., 2011) in our model, such dynamics is implicit through a long (~30s) pom1p membrane dwell time prior to disassociation, a timescale potentially created through slow pom1p auto-phosphorylation followed by rapid disassociation. Importantly, constructing a simple model of autophosphorylation, but without clustering, could not explain our data (see Supplemental Information). The reaction scheme, model equations and parameter values (together with the experiments from which the parameter values were extracted) are shown in Figure 5A. A more detailed mathematical analysis is presented in the Supplemental Information.
Figure 5. Two state mathematical model of pom1p gradient formation.
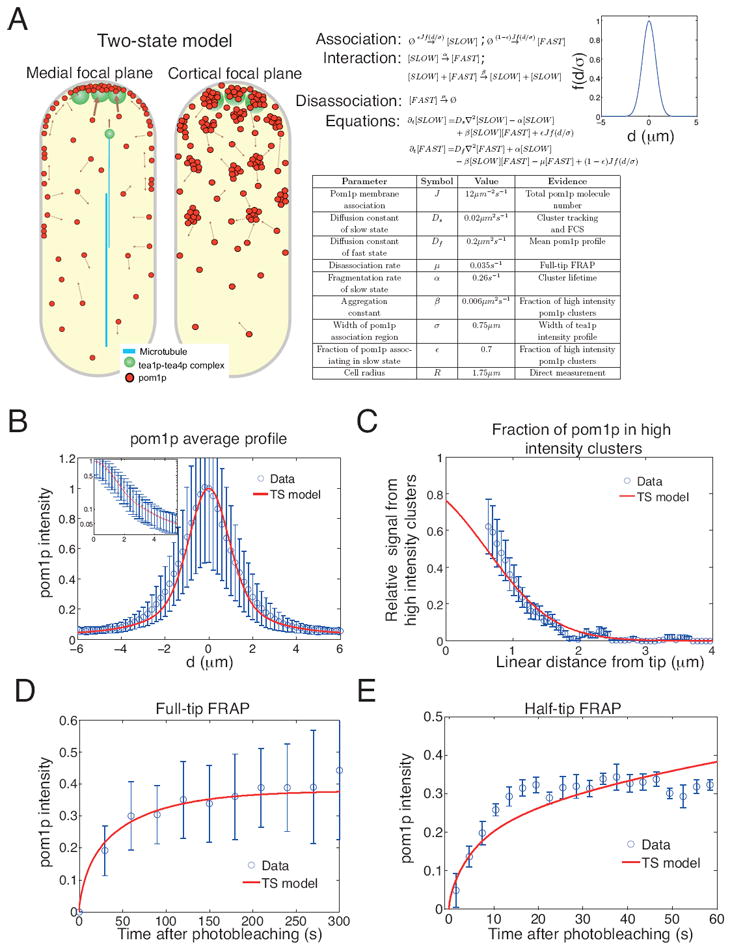
A. Pictorial summary of the two-state (TS) model of pom1p gradient formation. Also shown are the TS model reactions, equations, parameter values (together with the experiments from which the values were extracted) and the Gaussian form of the membrane association function f.
B. Fit of TS model to normalized mean pom1p intensity profile (experimental data from Figure 1B). Inset: same profile but on logarithmic intensity scale.
C. Contribution of pom1p clusters to the total cortical pom1p intensity as a function of linear distance from tip (see Supplemental Information). Data from 9 profiles from 9 cells. Red profile is fit from TS model.
D. Full-tip FRAP recovery data (as in Figure 2B) but with fit from TS model (red line).
E. Half-tip FRAP recovery data (as in Figure 2C) but with fit from 1d TS model (red line), see Supplemental Information. See also Figure S5.
We numerically solved the steady-state differential equations (Figure 5A) for the TS model. The TS model contains nine parameters (Figure 5A), which we inferred in the following way (see Supplemental Information for full procedure): cell radius (direct measurement), association width (tea1p spatial distribution), membrane disassociation rate (full-tip FRAP), cluster fragmentation rate (cluster lifetime) and cluster diffusion constant (cluster tracking, FCS). The diffusion constant of the faster-diffusing component was then constrained by the mean pom1p profile (to which a good fit was obtained, see Figure 5B). We note that the initial estimate of the diffusion constant from the half-tip FRAP data was not used in our detailed quantitation. To constrain the relative membrane association of the two states, and the cluster aggregation parameter, we measured and then fitted the TS model to the relative fraction of clustered pom1p as a function of position (Figure 5C), where overall around half of membrane pom1p was in the clustered form. The total number of pom1p molecules on the cortex was then used to constrain the maximum membrane association parameter. We then validated our model parameterisation by comparison with directly measured cluster assembly/disassembly rates (Figure S3C), and by generating TS model half-tip FRAP recovery profiles and comparing with our experiments. We find that the TS model is consistent with all of our previously presented experimental data, including the full and half-tip FRAP (Figure 5D,E). As detailed below, the TS model can also make testable predictions about the robustness of the pom1p gradient to cell-to-cell variations.
Mechanism for buffering cell-to-cell variations
One attractive property of this TS model is that it provides an inherent mechanism for buffering against cell-to-cell variations in concentration levels. This feature could be important as our experimental measurements show that the intensities of pom1p at the cell tip vary greatly. The model predicts that if more pom1p is introduced onto the membrane at the cell tip, a larger proportion of pom1p close to the cell tips can be in the clustered form due to the nonlinearity of cluster growth. As the pom1p clusters diffuse more slowly than the faster-diffusing component (Figure 3F), these gradients would have shorter decay lengths λ, i.e. an anti-correlation could exist between the peak pom1p concentration and λ. Thus, in the TS model, differences in the concentration of pom1p at certain distances away from a cell tip can be reduced, as illustrated in Figure 6A. We tested this prediction in silico. We first examined the effects of variations in the membrane association parameter. We chose to examine large variations in association, because of the large cell-to-cell variation in the tea1p tip intensity (Figure S2E). Accordingly, the maximum membrane association parameter in the TS model was drawn from a Gaussian distribution with 20% (standard deviation) variation relative to the mean. The resulting individual pom1p profiles were then fit to an exponential function over the range d=1.5-4 μm. For 100 such profiles, Figure S6A confirms the predicted anti-correlation between the pom1p peak concentration and λ. Similarly, cell-to-cell variation in the membrane pom1p diffusion constants also generated a similar anti-correlation (Figure S6B, 10% relative variation in diffusion constants). Such an anti-correlation is not, however, significantly generated by cell-to-cell variations in the membrane disassociation rate (Figure S6C, 10% relative variation in the disassociation rate), nor by cell-to-cell variations in the aggregation constant or fragmentation rate. To test for an overall anti-correlation, we simultaneously drew parameter values from Gaussian distributions with standard deviations relative to the mean of 10% (diffusion, aggregation, fragmentation, disassociation) and 20% (association). Figure 6B shows the pom1p peak concentration plotted against λ for 100 such simulated profiles, with a clear anti-correlation in the TS model. The SDD model with equivalent parameter variations did not exhibit such an anti-correlation (see Figure S6D), nor did simple linear models that incorporated pom1p phosphorylation but without clustering dynamics (see Supplemental Information).
Figure 6. The two state (TS) model buffers against cell-to-cell variations.
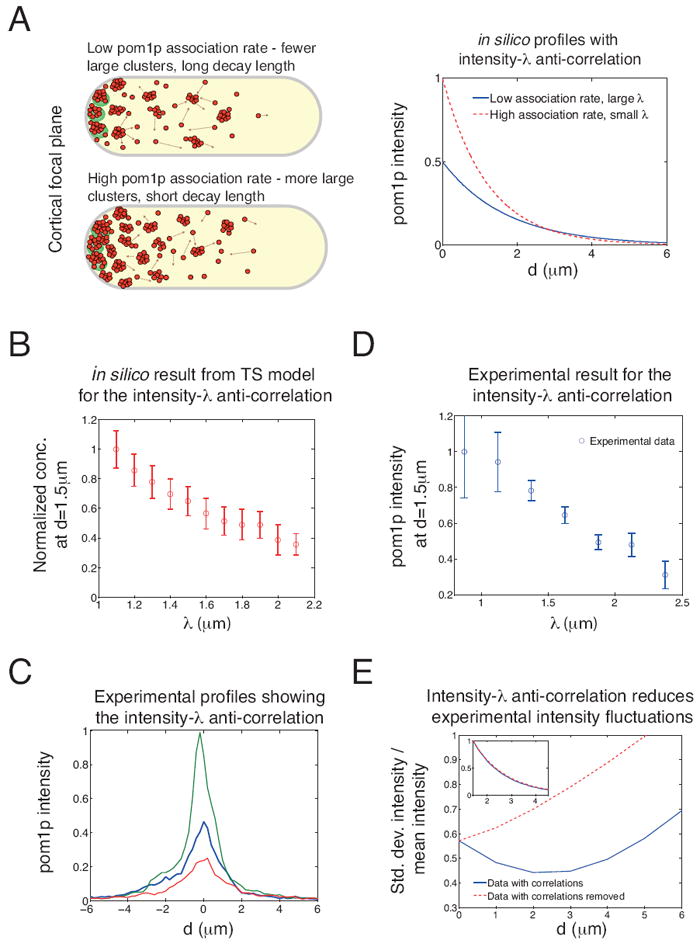
A. The TS model predicts that gradients with higher membrane association will have a steeper decay. Left: schematic picture of how Ia-λ anti-correlation is generated through cluster dynamics. Right: Demonstration of the effects of this anti-correlation on gradient profiles. Two in silico exponential profiles, with Ia=0.5 and λ=1.7 μm (blue) and Ia=1 and λ=1.2 μm (dashed red).
B. TS model anti-correlation between pom1p peak concentrations and λ (red circles) from 100 simulated profiles. Shown are effects of fluctuations in pom1p association (relative standard deviation 20%) and diffusion, aggregation, fragmentation, disassociation (all with relative standard deviation 10%). Pom1p concentration normalized to unity at smallest value of λ. Error bars: standard deviation.
C. In vivo pom1p profiles exhibit Ia-λ anti-correlation. Three representative profiles with different pom1p peak intensities (imaged over 90 s) are shown. Pom1p intensity is normalized to the highest peak. Note decay length of the gradient changes with these different peak intensities.
D. Experimentally measured anti-correlation between fitted values of Ia and λ (profiles used in fitting were time-averaged for 90 s). Error bars: standard deviation. Fitted profiles with r2<0.9 were excluded, giving 90 profiles analyzed from 90 cells.
E. Standard deviation in pom1p intensity divided by mean intensity, as derived from experimentally measured Ia and λ from 90 fitted profiles from 90 cells (blue line), compared to case where each Ia is paired with a randomly chosen λ (red dashed line). Inset: normalized mean pom1p profile unchanged between two data sets. See also Figure S6.
To test these model predictions with our in vivo data, we re-examined our experimental pom1p profiles (Figure 6C). Indeed, profiles with high pom1p concentrations at the cell tip tended to decay more rapidly with distance compared to those cells with lower tip pom1p concentrations (Figure 6C). To substantiate this finding quantitatively, we used our earlier fits (with r2>0.9) of individual pom1p profiles (one from each individual cell) to exponentially decaying functions. These experimental data (Figure 6D) show an Ia-λ anti-correlation, in quantitative agreement with the prediction of the TS model (and in disagreement with the SDD model). This striking property of the in vivo gradients provides strong support for our TS model by conforming to an important TS model prediction.
As illustrated in Figure 6A, the anti-correlation could potentially reduce the cell-to-cell variations in the pom1p gradient. To examine this possibility, we generated two sets of data from our experiments: pairs of Ia and λ in the first set were from the same original profile, whereas in the second set each Ia was paired with a randomly chosen λ. The data set incorporating the anti-correlation significantly reduced relative cell-to-cell variations (defined as the standard deviation in the pom1p intensity from Figure 1B divided by the mean intensity) as compared to the randomised data set (Figure 6E), even though the mean profiles in the two data sets were almost identical (Figure 6E, inset). We observe that the anti-correlation can decrease cell-to-cell variations by up to 40%.
To verify that the observed anti-correlation was not a general artifact of our measurements (for instance in image analysis), nor a non-specific property of tip gradients (for instance due to heterogeneity in membrane composition), we analyzed the profile of the protein kinase ssp1-GFP, which also forms a cortical concentration gradient from the cell tip, but without visible clustering (Figure S6E)(Rupes et al., 1999). In this case, no such anti-correlation was observed (Figure S6F).
Intrinsic fluctuations are significant and can be reduced by time-averaging
Pom1p profiles exhibited large intrinsic fluctuations, in part because of the effects of dynamic clustering and movement. This finding poses the question of how cells are able to sense pom1p concentrations with high precision (Tostevin et al., 2007). Intrinsic noise can be reduced by time-averaging, where the downstream “targets” of pom1p could be less dynamic than pom1p, and thus able to integrate the variations in pom1p over time. Indeed, FRAP studies show that two putative pom1p targets, cdr2p and mid1p, have t1/2 > 90 s (KP, unpublished observations) (Zhang et al., 2010). Although the utility of time averaging has been proposed previously in theoretical papers (see, for example, (Tostevin et al., 2007)), we sought to quantify experimentally the size of the intrinsic noise, and estimate the reduction in overall noise levels potentially provided by time-averaging. Such measurements have not previously been obtained for any intracellular gradient.
We analyzed time-lapse images of single cells to determine the magnitude of the intrinsic fluctuations δIint as a function of camera imaging (averaging) time in individual measuring volumes of width ≈ 200 nm along the cortical mask. Here, δIint is determined from the difference between the pom1p profile averaged over the first τ seconds, and the profile averaged over the full 90 s time series (see Supplemental Information for full protocol). In Figure 7A, δIint is plotted as a function of averaging time at various locations along the membrane: in all cases time-averaging resulted in a significant decrease in fluctuations. At 5μm from the cell tip, we found a five-fold reduction in δIint over 90 s of averaging. A simple time-averaging theory predicts that after τ seconds of time-averaging, δIint should be reduced by 1/√τ (see Supplemental Information) (Tostevin et al., 2007; Tostevin, 2011). This prediction agrees with our data (Figure 7A). The TS model also generated explicit predictions about the magnitude of the intrinsic noise as a function of position for fixed τ, predictions that we also confirmed (see Supplemental Information and Figure S7). We did detect discrepancies in intrinsic noise levels between theory and experiment near cell tips (first two frames in Figure 7A), which could potentially be explained by bursty pom1p association dynamics. Overall, our analysis suggests that time averaging can provide significant intrinsic noise-reduction.
Figure 7. Effects of noise on the overall positional precision of the pom1p gradient.
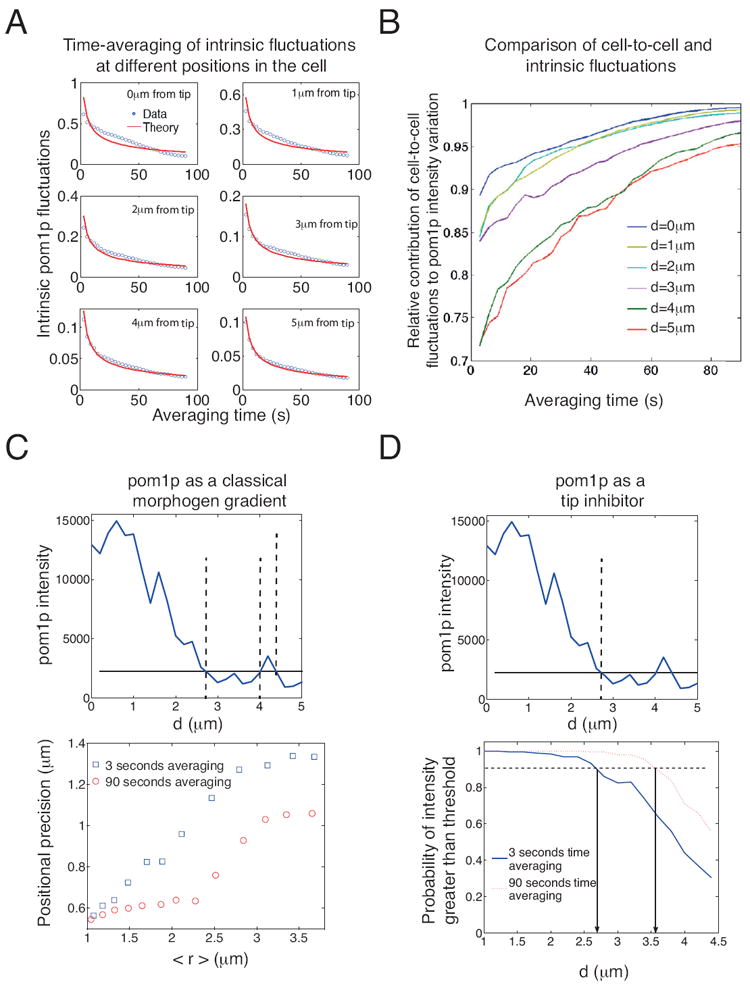
A. Standard deviation in pom1p intensity due to intrinsic fluctuations (arbitrary units) as function of averaging time at different positions along the gradient (196 gradients analyzed from 98 cells). Red curves are fit from time-averaging theory (see Supplemental Information).
B. Relative contribution of cell-to-cell fluctuations to total observed variation in pom1p intensity as a function of averaging time (196 gradients analyzed from 98 cells). Lines correspond to different distances d away from a tip.
C. Top: An example of a noisy pom1p intensity profile acting as a morphogen-like gradient. With little time-averaging, at a given threshold intensity (set here at 2250 in arbitrary intensity units, solid line), a noisy gradient determines position of a boundary (dashed lines; mean threshold intercept position at 3.5 μm). Bottom: Effect of time-averaging for 3 s (blue) and 90 s (red) on positional precision (standard deviation of threshold intercept positions) of the gradient for different thresholds, and therefore different mean intercept positions <r> (188 gradients analyzed from 94 cells).
D. Top: An example showing how pom1p might act as a tip-excluder with a minimum threshold intensity (solid line). Bottom: effect of time averaging on the probability of being able to distinguish cortical pom1p intensity from cytoplasmic pom1p intensity as a function of distance d (188 gradients analyzed from 94 cells). See also Figure S7.
Noise reduction increases the positional precision of the gradient
We next determined the extent to which the mechanisms that reduce cell-to-cell/intrinsic noise can improve the positional precision of the gradient. We first examined the relative importance of cell-to-cell variations as compared with intrinsic noise after varying periods of imaging (time-averaging). Near the cell tip, the majority of the observed variations in pom1p intensity are due to cell-to-cell variations, even after only short averaging periods (blue line, Figure 7B). Near the cell middle, intrinsic noise is more significant, and hence time averaging is more important in reducing fluctuations (red line, Figure 7B). After 30 s of time averaging, however, cell-to-cell variations are the dominant source of error in all locations.
We then experimentally quantified the positional error for the pom1p gradient. We first assumed that pom1p is used as a classical “morphogen” gradient that defines position in the cell through a threshold mechanism. In Figure 7C, we show the positional precision as function of position, after 3 s or 90 s of time-averaging. We see that time-averaging significantly improves the positional precision of the pom1p profile.
Second, we examined the role of pom1p as an inhibitor that prevents proteins such as mid1p, cdr2p and rga4p from binding at the cell tip (Celton-Morizur et al., 2006; Padte et al., 2006; Tatebe et al., 2008). We examined the probability that the pom1p concentration is above a given threshold (taken to be the mean cytoplasmic intensity) everywhere in a region close to a tip (Figure 7D). With 3 s of averaging, the entire tip region for d < 2.7 μm can be distinguished from the cytoplasm in 90% of cells. With 90 s of averaging, a larger tip region of d< 3.6 μm can be distinguished, or, alternatively, the same d < 2.7 μm region can be distinguished, but now in 99% of cells. Thus, noise buffering by time averaging can substantially improve the precision of the system.
Discussion
In this work, we develop a quantitative mechanistic model for the dynamic formation of the pom1p kinase gradient distribution. Previously, we and others have proposed a simple SDD-like model of pom1p gradient formation (Padte et al., 2006; Vilela et al., 2010; Tostevin, 2011). Upon more detailed analysis, however, we find that the mechanism is more complex. We propose that pom1p associates onto the plasma membrane close to a cell tip at sites marked by the tea1p complex and remains on the membrane for about 30s. This membrane association is regulated by a cycle of pom1p dephosphorylation and autophosphorylation (Hachet et al., 2011). During its time on the membrane, pom1p undocks from tea1p and then diffuses on the membrane. As it is diffusing, pom1p also forms larger clusters that form transiently and then fall apart into a faster-diffusing state. This clustering activity modulates the diffusion constants and the properties of the gradient profile. Based upon our empirical measurements of many of the key parameters, we present a quantitative two state (TS) computational model for gradient formation. Although this model is still a simplification of the in vivo mechanism, it has significant predictive power. More sophisticated models, such as an aggregation-fragmentation model (Wattis, 2006), that use a larger number of pom1p components with varying diffusion constants, would generate similar results but with many more fitted parameters. However, even our relatively simple TS model demonstrates how mechanisms for gradient formation in biology are likely to be more complex than previously imagined.
This work also elucidates mechanisms of how gradients buffer against noise. There is a growing appreciation that there are substantial fluctuations in biological systems. Fluctuations in gradients are likely to arise from stochasticity in gene expression, as well as in processes involved in gradient construction such as diffusion, membrane association, and local tea complex levels. Given this noise, it has not been clear how a gradient is able to generate a precise functional spatial pattern. Although issues of noise in subcellular gradients have been discussed previously at a theoretical level (Tostevin et al., 2007), we provide here quantitative measurements of such fluctuations in vivo (both cell-to-cell and intrinsic fluctuations). We propose that two mechanisms, cluster formation and time-averaging, work together to reduce the effects of noise in the pom1p system. We find that inherent in our two-state model, with nonlinear cluster growth, is a prediction that it buffers against cell-to-cell variations in concentration levels (of, for example, pom1p). Both in silico predictions and verification by in vivo data show an anti-correlation between pom1p intensity levels and gradient decay length: even as the pom1p concentration at the cell tips varies, the variation in the gradient at distances away from the cell tips is buffered. This anti-correlation relies on the property that higher (lower) pom1p concentrations form proportionally more (fewer) clusters, which leads to overall slower (faster) diffusion on the membrane. Previously, in a developmental biology context, other mechanisms proposed to buffer variations of this kind (Eldar et al., 2003) relied on self-enhanced degradation, leading to algebraically-decaying profiles.
We also propose that, in the pom1p system, a time-averaging mechanism can significantly reduce the large intrinsic fluctuations generated by the stochastic dynamics of gradient formation, including, for example, slow cluster diffusion. In silico time-averaging of experimental pom1p signal intensities on the order of 30-90 s produces a much smoother gradient distribution. Time-averaging can be implemented if the targets of pom1p are able to integrate the pom1p concentration over time. Consistent with this proposal, cdr2p, a possible target of pom1p, resides at the cortex near the middle of the cell with a t1/2 of greater than 90 s (our unpublished data); cdr2 molecules could thus theoretically sense pom1p concentrations at the cortex over these time scales. Overall, our analysis measures the extent to which clustering/time-averaging enhance robustness to cell-to-cell/intrinsic noise, with the clustering-induced anti-correlation, for example, reducing cell-to-cell fluctuations by up to 40%.
Our studies provide quantitative measurements of the key parameters responsible for pom1p gradient formation. The average membrane disassociation rate, as measured by whole-tip FRAP, shows turnover on the order of about 30 s, indicating that much of the more rapid pom1p dynamics occurs on the plasma membrane. Measurements using multiple assays with differing resolutions suggest that pom1p molecules exist in at least four distinct “states,” each with its own diffusion constant. FCS and imaging both show a state with a diffusion constant of around 0.02 μm2 s-1; these correspond to the clusters moving on the membrane. It is not known whether these clusters, which contain roughly 20 pom1p molecules at their peak, consist solely of pom1p or some assemblage of pom1p with other proteins. However, tea1p and tea4p do not appear to be a major component of these cortical clusters away from the cell tip. Gradient profiles, as well as the half-tip FRAP results, strongly suggest the existence of a faster diffusing state with an estimated diffusion constant of 0.2 μm2 s-1. This component may represent a pom1p monomer, or a small pom1p complex, diffusing on the membrane. It may appear as a haze in fluorescence imaging, and its presence in FCS may be masked by the brighter and slower clusters (Tcherniak et al., 2009). In addition, FCS shows a very slow membrane-associated state with diffusion constant of 0.005 μm2 s-1, located primarily at cell tips. This slow cortical state may represent a subset of pom1p docked at the cell tips with tea1p dots, which also move slowly (KP, unpublished observations). FCS also suggests that cytoplasmic pom1p is part of a larger complex.
The placement of the pom1p gradient relies on a well-studied microtubule-based morphogenetic program in fission yeast (Chang, 2001; Chang and Martin, 2009; Piel and Tran, 2009). Self-organizing microtubule bundles orient along the long axis of the cell. The growing MT plus ends transport and deposit tea1p-tea4p complexes at the cell tip, thereby indirectly helping to position the source of the pom1p gradient. We note that transient disruption of MTs has only mild effects on the pom1p gradient, as the tea proteins continue to persist at the cell tips even without MTs (Bicho et al., 2010).
This work illustrates how in biology gradients are likely to use more complex mechanisms than simple SDD-based models in order to deal with noise. Similar quantitative analyses of other biological gradients have also revealed complexities not easily explained by simple models. In the Bicoid gradient, large discrepancies in diffusion constants derived from different approaches challenge previous models and suggest more complex underlying mechanisms (Gregor et al., 2007b; Abu-Arish et al., 2010). In polarization of budding yeast, formation of a cortical gradient of the small GTPase Cdc42 relies on the interplay of regulators including GAPs and GEFs, as well as actin-dependent membrane trafficking (Marco et al., 2007; Slaughter et al., 2009). Further studies on gradients will undoubtedly forge further understanding of the mechanisms underlying the spatial regulation of development and morphogenesis at the level of molecules.
Methods
S. pombe cell preparation
Standard methods for S. pombe growth and genetics were used (Moreno et al., 1991). Strains are listed in Supplemental Information, Table S1. Cells were grown in liquid YE5S media at 25°C with shaking in exponential phase before imaging. Cells were generally mounted in liquid YE5S media directly on glass. 1% agarose YE5S pads were used for long-term imaging. For some of the FRAP experiments, cells were mounted on lectin-coated chambers. Imaging was done at 23-26°C.
Microscopy
Images were generally acquired using a spinning-disc confocal fluorescence microscope system (Nikon, Perkin-Elmer, Solamere Technology) with an EM CCD camera (Hamamatsu) and a 100× 1.4 N.A. objective. Full tip FRAP experiments were performed with a LSM710 Meta scanning confocal microscope (Zeiss). Half-tip FRAP experiments reported were performed with an Ultraview Vox spinning disc microscope system with a photo-bleaching unit (Perkin-Elmer). We confirmed that both imaging systems provide comparable results.
Image Analysis
ImageJ (NIH) and custom MatLab (Mathworks) software were used for analysis. ImageJ plugins used include MtrackJ (Erik Meijering) and Manual Tracking (Fabrice Cordeleires). For gradient profiles, generally, fluorescence intensity values around the cortex of cells were measured from images of cells in a medial focal plane, using custom MatLab software for the automated generation of a one-pixel wide mask around the cell cortex, followed by manual correction. Protein counts were estimated by quantitative fluorescence intensity with standard proteins that had been quantitated previously (Wu and Pollard, 2005). The cortical clusters were analyzed manually from spinning disc confocal images taken in a cortical focal plane. See Supplementary information for additional information.
Fluorescence correlation spectroscopy (FCS)
Two-photon FCS was performed on a custom-built microscopy setup. Autocorrelation profiles were fit to a sum of 2D and 3D diffusion models and yielded particle residence times (Krichevsky and Bonnet, 2002; Haustein and Schwille, 2007). Each particle is summed with its brightness squared as a pre-factor into the autocorrelation profile. Thus, the presence of bright, slow species as seen in this study makes dimmer, faster species (e.g. monomeric pom1p) difficult to detect. Diffusion constants of the slow species are overestimated due to the long residences times in the excitation volume, whereas the diffusion constant for the faster species is underestimated due to the complex mixtures of large and small clusters in the volume (Tcherniak et al., 2009). Fission yeast cells were measured at different cellular positions to identify diffusing pom1p species. See Supplementary Information for details.
Mathematical modeling
The cell geometry was taken to be a capsule, with two hemispherical caps connected by a cylinder of equal radius. Pom1p dynamics was described using reaction-diffusion equations, which were solved numerically using Matlab. To compare the model with the experimental full-tip FRAP data, the model initial conditions had no pom1p present at a cell tip. Model comparison to the half-tip FRAP data was more complicated due to the lack of rotational symmetry about the cell’s long axis. Here, 1D approximations were used in this case to analyze the model behavior. Model parameter fitting was made in 3 stages. First, experimental results limited the range of certain parameter values (for example, the pom1p membrane lifetime was constrained by the full-tip FRAP). Second, parameters were fit to four further experiments: pom1p average profile; relative distribution of slow-diffusing pom1p clusters; total pom1p copy number; and full-tip FRAP results. Finally, once satisfactory fits to the above data were obtained, the model was compared with the half-tip FRAP results and estimates of cluster assembly/disassembly rates for consistency. Further details (including discussion of simpler models and of intrinsic fluctuations) are provided in Supplementary Information.
Supplementary Material
Acknowledgments
We thank the members of the Chang and Howard groups, and Neal Padte, Sophie Martin, Jaime Moseley, Jian Qiu Wu, Mark Bathe, Lars Hufnagel and his group for discussions. We thank Boryana Petrova and the ALMF at EMBL-Heidelberg for assistance with FRAP experiments. This work was supported by an EIPOD fellowship (to TES), by the Royal Society and by BBSRC core support (to MH) and a National Institutes of Health GM056836 grant and an Ellison Medical Foundation Senior Scholar Award (to FC), and NIH GM077238 (to JVS).
Footnotes
Publisher's Disclaimer: This is a PDF file of an unedited manuscript that has been accepted for publication. As a service to our customers we are providing this early version of the manuscript. The manuscript will undergo copyediting, typesetting, and review of the resulting proof before it is published in its final citable form. Please note that during the production process errors may be discovered which could affect the content, and all legal disclaimers that apply to the journal pertain.
References
- Abu-Arish A, Porcher A, Czerwonka A, Dostatni N, Fradin C. High mobility of bicoid captured by fluorescence correlation spectroscopy: implication for the rapid establishment of its gradient. Biophys J. 2010;99:L33–35. doi: 10.1016/j.bpj.2010.05.031. [DOI] [PMC free article] [PubMed] [Google Scholar]
- Ashe HL, Briscoe J. The interpretation of morphogen gradients. Development. 2006;133:385–394. doi: 10.1242/dev.02238. [DOI] [PubMed] [Google Scholar]
- Bahler J, Pringle JR. Pom1p, a fission yeast protein kinase that provides positional information for both polarized growth and cytokinesis. Genes Dev. 1998;12:1356–1370. doi: 10.1101/gad.12.9.1356. [DOI] [PMC free article] [PubMed] [Google Scholar]
- Bicho CC, Kelly DA, Snaith HA, Goryachev AB, Sawin KE. A catalytic role for Mod5 in the formation of the Tea1 cell polarity landmark. Curr Biol. 2010;20:1752–1757. doi: 10.1016/j.cub.2010.08.035. [DOI] [PMC free article] [PubMed] [Google Scholar]
- Botvinick EL, Shah JV. Laser-based measurements in cell biology. Methods Cell Biol. 2007;82:81–109. doi: 10.1016/S0091-679X(06)82003-0. [DOI] [PubMed] [Google Scholar]
- Brown GC, Kholodenko BN. Spatial gradients of cellular phosphoproteins. FEBS Lett. 1999;457:452–454. doi: 10.1016/s0014-5793(99)01058-3. [DOI] [PubMed] [Google Scholar]
- Celton-Morizur S, Racine V, Sibarita JB, Paoletti A. Pom1 kinase links division plane position to cell polarity by regulating Mid1p cortical distribution. J Cell Sci. 2006;119:4710–4718. doi: 10.1242/jcs.03261. [DOI] [PubMed] [Google Scholar]
- Chang F. Establishment of a cellular axis in fission yeast. Trends Genet. 2001;17:273–278. doi: 10.1016/s0168-9525(01)02279-x. [DOI] [PubMed] [Google Scholar]
- Chang F, Martin SG. Shaping fission yeast with microtubules. Cold Spring Harb Perspect Biol. 2009;1:a001347. doi: 10.1101/cshperspect.a001347. [DOI] [PMC free article] [PubMed] [Google Scholar]
- Chen YE, Tropini C, Jonas K, Tsokos CG, Huang KC, Laub MT. Spatial gradient of protein phosphorylation underlies replicative asymmetry in a bacterium. Proc Natl Acad Sci U S A. 2011;108:1052–1057. doi: 10.1073/pnas.1015397108. [DOI] [PMC free article] [PubMed] [Google Scholar]
- Crick F. Diffusion in embryogenesis. Nature. 1970;225:420–422. doi: 10.1038/225420a0. [DOI] [PubMed] [Google Scholar]
- Eldar A, Dorfman R, Weiss D, Ashe H, Shilo BZ, Barkai N. Robustness of the BMP morphogen gradient in Drosophila embryonic patterning. Nature. 2002;419:304–308. doi: 10.1038/nature01061. [DOI] [PubMed] [Google Scholar]
- Eldar A, Rosin D, Shilo BZ, Barkai N. Self-enhanced ligand degradation underlies robustness of morphogen gradients. Dev Cell. 2003;5:635–646. doi: 10.1016/s1534-5807(03)00292-2. [DOI] [PubMed] [Google Scholar]
- Elowitz MB, Levine AJ, Siggia ED, Swain PS. Stochastic gene expression in a single cell. Science. 2002;297:1183–1186. doi: 10.1126/science.1070919. [DOI] [PubMed] [Google Scholar]
- Erdmann T, Howard M, ten Wolde PR. Role of spatial averaging in the precision of gene expression patterns. Phys Rev Lett. 2009;103:258101. doi: 10.1103/PhysRevLett.103.258101. [DOI] [PubMed] [Google Scholar]
- Fuller BG, Lampson MA, Foley EA, Rosasco-Nitcher S, Le KV, Tobelmann P, Brautigan DL, Stukenberg PT, Kapoor TM. Midzone activation of aurora B in anaphase produces an intracellular phosphorylation gradient. Nature. 2008;453:1132–1136. doi: 10.1038/nature06923. [DOI] [PMC free article] [PubMed] [Google Scholar]
- Gregor T, Tank DW, Wieschaus EF, Bialek W. Probing the limits to positional information. Cell. 2007a;130:153–164. doi: 10.1016/j.cell.2007.05.025. [DOI] [PMC free article] [PubMed] [Google Scholar]
- Gregor T, Wieschaus EF, McGregor AP, Bialek W, Tank DW. Stability and nuclear dynamics of the bicoid morphogen gradient. Cell. 2007b;130:141–152. doi: 10.1016/j.cell.2007.05.026. [DOI] [PMC free article] [PubMed] [Google Scholar]
- Hachet O, Berthelot-Grosjean M, Kokkoris K, Vincenzetti V, Moosbrugger J, Martin SG. A phosphorylation cycle shapes gradients of the DYRK family kinase Pom1 at the plasma membrane. Cell. 2011;145:1116–1128. doi: 10.1016/j.cell.2011.05.014. [DOI] [PubMed] [Google Scholar]
- Haustein E, Schwille P. Fluorescence correlation spectroscopy: novel variations of an established technique. Annu Rev Biophys Biomol Struct. 2007;36:151–169. doi: 10.1146/annurev.biophys.36.040306.132612. [DOI] [PubMed] [Google Scholar]
- Huang Y, Chew TG, Ge W, Balasubramanian MK. Polarity determinants Tea1p, Tea4p, and Pom1p inhibit division-septum assembly at cell ends in fission yeast. Dev Cell. 2007;12:987–996. doi: 10.1016/j.devcel.2007.03.015. [DOI] [PubMed] [Google Scholar]
- Kalab P, Heald R. The RanGTP gradient - a GPS for the mitotic spindle. J Cell Sci. 2008;121:1577–1586. doi: 10.1242/jcs.005959. [DOI] [PMC free article] [PubMed] [Google Scholar]
- Krichevsky O, Bonnet G. Fluorescence correlation spectroscopy: the technique and its applications. Rep Prog Phys. 2002;65:251–297. [Google Scholar]
- Lander AD. Morpheus unbound: reimagining the morphogen gradient. Cell. 2007;128:245–256. doi: 10.1016/j.cell.2007.01.004. [DOI] [PubMed] [Google Scholar]
- Marco E, Wedlich-Soldner R, Li R, Altschuler SJ, Wu LF. Endocytosis optimizes the dynamic localization of membrane proteins that regulate cortical polarity. Cell. 2007;129:411–422. doi: 10.1016/j.cell.2007.02.043. [DOI] [PMC free article] [PubMed] [Google Scholar]
- Martin SG, Berthelot-Grosjean M. Polar gradients of the DYRK-family kinase Pom1 couple cell length with the cell cycle. Nature. 2009;459:852–856. doi: 10.1038/nature08054. [DOI] [PubMed] [Google Scholar]
- Meyers J, Craig J, Odde DJ. Potential for control of signaling pathways via cell size and shape. Curr Biol. 2006;16:1685–1693. doi: 10.1016/j.cub.2006.07.056. [DOI] [PubMed] [Google Scholar]
- Mitchison JM, Nurse P. Growth in cell length in the fission yeast Schizosaccharomyces pombe. J Cell Sci. 1985;75:357–376. doi: 10.1242/jcs.75.1.357. [DOI] [PubMed] [Google Scholar]
- Moreno S, Klar A, Nurse P. Molecular genetic analysis of fission yeast Schizosaccharomyces pombe. Methods Enzymol. 1991;194:795–823. doi: 10.1016/0076-6879(91)94059-l. [DOI] [PubMed] [Google Scholar]
- Moseley JB, Mayeux A, Paoletti A, Nurse P. A spatial gradient coordinates cell size and mitotic entry in fission yeast. Nature. 2009;459:857–860. doi: 10.1038/nature08074. [DOI] [PubMed] [Google Scholar]
- Moseley JB, Nurse P. Cell division intersects with cell geometry. Cell. 2010;142:184–188. doi: 10.1016/j.cell.2010.07.004. [DOI] [PubMed] [Google Scholar]
- Niccoli T, Arellano M, Nurse P. Role of Tea1p, Tea3p and Pom1p in the determination of cell ends in Schizosaccharomyces pombe. Yeast. 2003;20:1349–1358. doi: 10.1002/yea.1054. [DOI] [PubMed] [Google Scholar]
- Niethammer P, Bastiaens P, Karsenti E. Stathmin-tubulin interaction gradients in motile and mitotic cells. Science. 2004;303:1862–1866. doi: 10.1126/science.1094108. [DOI] [PubMed] [Google Scholar]
- Padte NN, Martin SG, Howard M, Chang F. The cell-end factor pom1p inhibits mid1p in specification of the cell division plane in fission yeast. Curr Biol. 2006;16:2480–2487. doi: 10.1016/j.cub.2006.11.024. [DOI] [PubMed] [Google Scholar]
- Pan KZ, Chang F. Cell-cycle control: don’t supersize me. Curr Biol. 2009;19:R517–519. doi: 10.1016/j.cub.2009.05.044. [DOI] [PubMed] [Google Scholar]
- Piel M, Tran PT. Cell shape and cell division in fission yeast. Curr Biol. 2009;19:R823–827. doi: 10.1016/j.cub.2009.08.012. [DOI] [PMC free article] [PubMed] [Google Scholar]
- Raj A, Rifkin SA, Andersen E, van Oudenaarden A. Variability in gene expression underlies incomplete penetrance. Nature. 2010;463:913–918. doi: 10.1038/nature08781. [DOI] [PMC free article] [PubMed] [Google Scholar]
- Raser JM, O’Shea EK. Control of stochasticity in eukaryotic gene expression. Science. 2004;304:1811–1814. doi: 10.1126/science.1098641. [DOI] [PMC free article] [PubMed] [Google Scholar]
- Rupes I, Jia Z, Young PG. Ssp1 promotes actin depolymerization and is involved in stress response and new end take-off control in fission yeast. Mol Biol Cell. 1999;10:1495–1510. doi: 10.1091/mbc.10.5.1495. [DOI] [PMC free article] [PubMed] [Google Scholar]
- Saunders TE, Howard M. Morphogen profiles can be optimized to buffer against noise. Phys Rev E Stat Nonlin Soft Matter Phys. 2009;80:041902. doi: 10.1103/PhysRevE.80.041902. [DOI] [PubMed] [Google Scholar]
- Slaughter BD, Das A, Schwartz JW, Rubinstein B, Li R. Dual modes of cdc42 recycling fine-tune polarized morphogenesis. Dev Cell. 2009;17:823–835. doi: 10.1016/j.devcel.2009.10.022. [DOI] [PMC free article] [PubMed] [Google Scholar]
- Spirov A, Fahmy K, Schneider M, Frei E, Noll M, Baumgartner S. Formation of the bicoid morphogen gradient: an mRNA gradient dictates the protein gradient. Development. 2009;136:605–614. doi: 10.1242/dev.031195. [DOI] [PMC free article] [PubMed] [Google Scholar]
- Tatebe H, Nakano K, Maximo R, Shiozaki K. Pom1 DYRK regulates localization of the Rga4 GAP to ensure bipolar activation of Cdc42 in fission yeast. Curr Biol. 2008;18:322–330. doi: 10.1016/j.cub.2008.02.005. [DOI] [PMC free article] [PubMed] [Google Scholar]
- Tcherniak A, Reznik C, Link S, Landes CF. Fluorescence correlation spectroscopy: criteria for analysis in complex systems. Analytical chemistry. 2009;81:746–754. doi: 10.1021/ac8013109. [DOI] [PubMed] [Google Scholar]
- Tostevin F. Precision of sensing cell length via concentration gradients. Biophys J. 2011;100:294–303. doi: 10.1016/j.bpj.2010.11.046. [DOI] [PMC free article] [PubMed] [Google Scholar]
- Tostevin F, ten Wolde PR, Howard M. Fundamental limits to position determination by concentration gradients. PLoS Comput Biol. 2007;3:e78. doi: 10.1371/journal.pcbi.0030078. [DOI] [PMC free article] [PubMed] [Google Scholar]
- Vilela M, Morgan JJ, Lindahl PA. Mathematical model of a cell size checkpoint. PLoS Comput Biol. 2010;6:e1001036. doi: 10.1371/journal.pcbi.1001036. [DOI] [PMC free article] [PubMed] [Google Scholar]
- Wattis JAD. An introduction to mathematical models of coagulation-fragmentation processes: A discrete deterministic mean-field approach. Physica D-Nonlinear Phenomena. 2006;222:1–20. [Google Scholar]
- Wu JQ, Pollard TD. Counting cytokinesis proteins globally and locally in fission yeast. Science. 2005;310:310–314. doi: 10.1126/science.1113230. [DOI] [PubMed] [Google Scholar]
- Zhang D, Vjestica A, Oliferenko S. The cortical ER network limits the permissive zone for actomyosin ring assembly. Curr Biol. 2010;20:1029–1034. doi: 10.1016/j.cub.2010.04.017. [DOI] [PubMed] [Google Scholar]
Associated Data
This section collects any data citations, data availability statements, or supplementary materials included in this article.