

Abstract
LipidomeDB Data Calculation Environment (DCE) is a web application to quantify complex lipids by processing data acquired after direct infusion of a lipid-containing biological extract, to which a cocktail of internal standards has been added, into an electrospray source of a triple quadrupole mass spectrometer. LipidomeDB DCE is located on the public Internet at http://lipidome.bcf.ku.edu:9000/Lipidomics. LipidomeDB DCE supports targeted analyses; analyte information can be entered, or pre-formulated lists of typical plant or animal polar lipid analytes can be selected. LipidomeDB DCE performs isotopic deconvolution and quantification in comparison to internal standard spectral peaks. Multiple precursor or neutral loss spectra from up to 35 samples may be processed simultaneously with data input as Excel files and output as tables viewable on the web and exportable in Excel. The pre-formulated compound lists and web access, used with direct-infusion mass spectrometry, provide a simple approach to lipidomic analysis, particularly for new users.
Keywords: Triple quadrupole mass spectrometry, Precursor scan, Neutral loss scan, Direct infusion, Lipid quantification, Lipidomics
Introduction
Lipidomics is a developing strategy for functional genomics. Characterizing large numbers of mutants or the results of experimental manipulations applied to large numbers of samples is becoming increasingly feasible. Triple quadrupole (QqQ) mass spectrometers are robust and widely available instruments, and their ability to isolate a signal stemming from the subset of a sample's molecules that produce a specific pair of mass/charge (m/z) values provides detection specificity for lipidomic analysis. Direct-infusion QqQ mass spectrometry (MS), using precursor and neutral loss scans, as originally proposed by Brügger et al. [1], offers many advantages as a lipidomics platform. Direct infusion, in comparison to introducing samples through a liquid chromatography interface, is more easily implemented and allows for the rapid analysis of many samples. Another, less recognized advantage of direct-infusion is that the continuous influx of sample allows the user to adjust the scanning time to improve signal detection, without concern for elution time. However, a potential bottleneck in the implementation of any lipidomic strategy is the ability to process the data into quantitative lipid profiles. In particular, new users need a simple approach, and many users need to be able to process large data sets.
A number of tools for analysis of mass spectral data from lipids have been developed. Tools designed for direct-infusion QqQ MS analysis include the algorithm developed by Kurvinen et al. [2], LIMSA [3, 4], and the method developed by Ejsing et al. [5], LipidQA [6] and AMDMSSL [7]. Each tool is capable of lipid quantification from direct infusion QqQ mass spectral data, and each has special features. Some have the ability to combine data from multiple spectra for identification and analysis of lipids at the true molecular species level [5–7]. Some provide for visualization and statistical analysis of the output data [2–5].
Here we describe a new tool for mass spectral data analysis for lipidomics. The strength of LipidomeDB Data Calculation Environment (DCE) is its ability to rapidly and simultaneously analyze multiple spectra from up to 35-sample input in one step. It differs from currently available tools in being on the web. It provides pre-formulated lists of target lipid analytes, including lists for plant lipids, and can accept user-defined target analyte lists.
Materials and Methods
Programming
LipidomeDB DCE has a web interface and a database backend (called LipidomeDB), and scripts to read and perform calculations on input data provided in Excel format. LipidomeDB is a MySQL database that stores the defined lipid species and formulas, and the users' experimental data. Much of the LipidomeDB DCE is coded in JSP. The user interface is implemented primarily in JSP with Javascript used to perform client-side computations, such as those related to isotopic abundances, and with Java used for server-side data analysis, such as searching the database for target lipid species matching uploaded data with the target species lists, and isotopic deconvolution.
Input Spectral Data
The input data are spectral peak lists acquired by precursor or neutral loss scanning, typically using a triple quadrupole mass spectrometer in the multiple channel analyzer (MCA) mode (a mode that averages or sums the signal from multiple scans to produce a spectrum). Data processing, i.e., baseline subtraction, smoothing and centroiding (or integration), are performed with the mass spectrometer's acquisition software. Spectra, each as a list of m/z versus signal, are exported from the acquisition program to Excel files for upload to LipidomeDB DCE. AB Sciex programmers have written a script, called “Multiple Period Processing,” that exports data in the proper format; however, the format may be replicated manually or through other scripts. The format of the Excel spreadsheets for upload is specified in the documentation accompanying LipidomeDB DCE, and example files are provided.
Algorithms and Functions
Algorithms and functions are described briefly below. Full details are provided in the documentation (tutorial) for LipidomeDB DCE accessed from its home page: http://lipidome.bcf.ku.edu:9000/Lipidomics.
Target Lipid Information
The mass of target lipids and abundances of their isotopic variants are calculated from the chemical formula by adding the masses of the component atoms. The adduct formed by the target lipids is specified by the user. Possible adduct choices, in the negative mode, are [M − H]−, [M−CH3]−, [M + Cl]− and [M + C2H3O2]− (i.e., [M + acetate]−), and in the positive mode, [M + H]+, [M + NH4]+, [M + Li]+, [M + Na]+ and [M + K]+.
Lipid Search
The peaks corresponding to specified adduct ions of the internal standards and target lipids are located in the input data by m/z, and the value of each corresponding signal is collected. Any mass that is within the specified mass tolerance window (specified compound mass ± the mass tolerance) is considered a candidate mass for the specified target lipid or internal standard. The search algorithm provides three options, in case multiple masses are found within the mass tolerance window. The three options are: “Nearest Mass,” which selects the m/z closest to the lipid ion's m/z, “Highest Signal,” which selects the m/z having the highest corresponding signal value, and “Sum of Signals,” which sums signals within the specified mass tolerance target window.
Isotopic Deconvolution (Correction) of Signal and Lipid Analyte Quantification
Quantification is essentially the method described by Brügger et al. [1] and used in the LIMSA analytical tool [3, 4]. Isotopic deconvolution to remove signals because of “A + 1” and “A + 2” isotopic variants (in LipidomeDB DCE, called a1 and a2), in order to detect the “A” peaks of other compounds at the same nominal mass, is performed in a manner similar to the “subtraction” method in the LIMSA analytical tool [3].
After the corrected signals are established by deconvolution, the amount of each target lipid is calculated. The amount is calculated from the corrected signals for the target lipids, the signals for 1–3 internal standards and the corresponding internal standard amounts specified by the user. A linear calibration curve (signal vs. m/z) fits the signals of the internal standards [3] and is used to correct for mass-dependent variation in instrument response. If any internal standard is not detected, an error message appears on an output page for the individual spectrum (i.e., the spectrum for one target list and one sample); if this error is present, the target analytes are not quantified in the sample with the missing standards. If the internal standards are detected, data calculations are shown on the output page for the individual spectrum.
Results and Discussion
The primary function of LipidomeDB DCE is to search for m/z and signal for entered target lipid species in integrated (centroided) mass spectra uploaded by the user, to isotopically deconvolute the signals, and to quantify the signals in comparison to internal standard signals and amounts, in order to calculate the amount of each target lipid species in the samples. LipidomeDB DCE has three phases, shown in Fig. 1, data collection, data analysis, and result output and collection.
Fig. 1.

Scheme indicating the workflow of the system and relationships of the three phases of LipidomeDB DCE: data collection, data analysis, and result output and collection
Getting Started
To use LipidomeDB DCE, a login ID can be acquired by following instructions on the home page. A “tutorial” (i.e., documentation) accessible from the home page includes complete instructions for the use of LipidomeDB DCE. The instructions include brief directions for performing the lipidomic experiments, including suggestions for sample preparation, internal standards and their addition, acquisition of the mass spectral data and formatting of the mass spectral data for input into LipidomeDB DCE. The intent of this part of the tutorial is to simplify and describe the process of performing lipidomic analyses. Also available, on the home page and by following links in the tutorial, are example input data files, acquired on mouse intestinal lipid extracts, and the output file that should be obtained when the data are processed according to the instructions, allowing users to test the interface function and verify correct usage. Step-by-step directions for using LipidomeDB DCE (as shown in Table 1) with screenshots are provided in the tutorial. Also in the tutorial are sections discussing normalization to tissue metrics and practical considerations about the limitations of the quantitative capabilities of direct-infusion electrospray ionization QqQ MS-based analysis.
Table 1.
Categories of step-by-step directions in the LipidomeDB DCE tutorial
| Step 1. Assemble the data to be entered |
| Step 2. User log-in |
| Step 3. Enter data about the samples |
| Step 4. Enter the first target compound set |
| a. Enter a target compound set from an existing (pre-formulated) list |
| b. Enter your own target compound set |
| Step 5. Enter any additional target compound sets |
| Step 6. Provide data about internal standard amounts |
| Step 7. Upload the input data generated from the experiments in Excel format |
| Step 8. Collect the results |
Input Data
The input to LipidomeDB consists of lists of target lipids, i.e., lipid species being analyzed, lists of internal standards utilized, internal standard amounts, and the mass and signal lists from precursor or neutral loss scan(s) (Fig. 1). Either pre-formulated lipid species target lists, user-specified lipid target lists or a combination of the two types of lists can be used. If the user composes his own sheets, they can be saved for his later use. The pre-formulated target lists for “plants” and “animals” are based on lipid species detected by the Kansas Lipidomics Research Center's analytical laboratory by electrospray ionization QqQ MS in a number of higher plant and mammalian species. Figure 2 is a screenshot of the interface for indicating the target lipids and the corresponding internal standards. Similar pages are used for each group of lipids to be analyzed (i.e., for each precursor or neutral loss scan). The pre-formulated lists provide a suitable and quick starting point for many users. Amounts of internal standards are entered, and mass spectral data are uploaded in Excel files. The interface for uploading the mass spectral data is shown in Fig. 3. LipidomeDB DCE searches the m/z of mass spectral data for the m/z values of lipids and internal standards in the target lists.
Fig. 2.
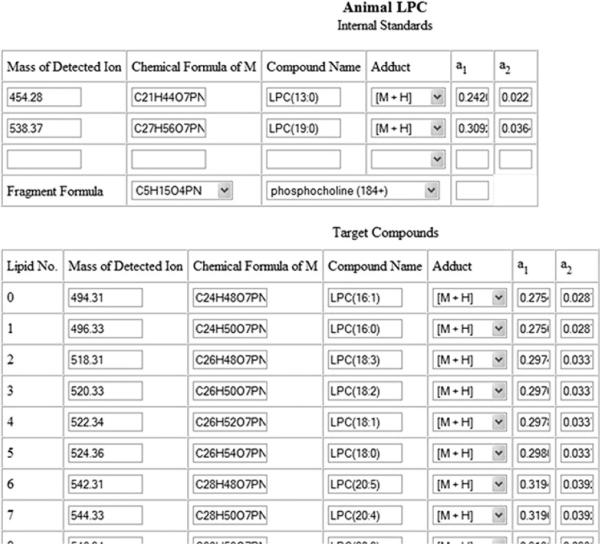
Screenshot of target compound input sheet. The screenshot shows the pre-formulated list for “Animal LPC”
Fig. 3.

Screenshot of spectral files upload sheet
Data Calculation and Output
Data calculation is described briefly in the “Materials and Methods” section, and in more detail in the tutorial. The output of LipidomeDB DCE can be viewed on (1) a sheet showing calculations for one target list for one sample, (2) as a summary showing calculated data for one target compound set from all samples or (3) as a summary of data for all targeted compound sets from all samples (Fig. 4). The sheet showing calculations for one target list for one sample (i.e., data from one spectrum) allows the user to confirm detection of the internal standards, to view the corrections for isotopic variants (isotopic deconvolution results) and to view the results of the quantification. The summary sheets provide the data in several convenient forms. All sheets can be viewed on the web or exported in Excel format.
Fig. 4.

Screenshot of summary. A summary of data for all targeted compound sets from all samples can be exported as an Excel file
Summary
LipidomeDB DCE is a well-documented web application for analysis of direct infusion electrospray ionization QqQ mass spectral data, with the capability to analyze multiple scans from up to 35 samples simultaneously. The pre-formulated lists of plant and animal polar lipids provide a quick start for lipidomic data analysis that should provide for ease in performing lipidomics analyses. In the long term, the web-accessible lipidomics data calculation system and database can be developed for storage and retrieval of lipidomics data in the context of experimental metadata.
Acknowledgments
The authors would like to thank Dr. Susan Brown for helping us start the LipidomeDB project and obtain financial support for it. We are also grateful to Dr. Youping Deng for his efforts to initiate a lipidomics database and to Drs. Todd Williams and Xuemin Wang for helping us initiate lipidomics work. We appreciate Emily Archer Slone, Byron Sparkes and Dr. Sherry Fleming for allowing us to use their data as example data. We also wish to thank members of the Welti and Visvanathan groups, who provided helpful suggestions. Funding for development of LipidomeDB Data Calculation Environment was from Kansas IDeA Networks of Biomedical Research Excellence (National Institutes of Health grant P20 RR16475 from the National Center for Research Resources). Mass spectrometer acquisition and mass spectrometry method development were supported by National Science Foundation grants MCB 0455318, MCB 0920663 and DBI 0521587, Kansas National Science Foundation EPSCoR grant EPS-0236913, Kansas Technology Enterprise Corp. and Kansas State University. Contribution no. 11-295-J from the Kansas Agricultural Experiment Station.
Abbreviations
- DCE
Data Calculation Environment
- m/z
Mass/charge
- MS
Mass spectrometry
- QqQ
Triple quadrupole
Footnotes
Present Address: L. Wang Department of Genetics and Biochemistry, Clemson University, Clemson, SC 29634, USA
Z. Zhou and S. R. Marepally contributed equally.
References
- 1.Brügger B, Erben G, Sandhoff R, Wieland FT, Lehmann WD. Quantitative analysis of biological membrane lipids at the low picomole level by nano-electrospray ionization tandem mass spectrometry. Proc Natl Acad Sci USA. 1997;94:2339–2344. doi: 10.1073/pnas.94.6.2339. [DOI] [PMC free article] [PubMed] [Google Scholar]
- 2.Kurvinen J-P, Aaltonen J, Kuksis A, Kallio H. Software algorithm for automatic interpretation of mass spectra of glycerolipids. Rapid Commun Mass Spectrom. 2002;16:1812–1820. doi: 10.1002/rcm.785. [DOI] [PubMed] [Google Scholar]
- 3.Haimi P, Uphoff A, Hermansson M, Somerharju P. Software tools for analysis of mass spectrometric lipidome data. Anal Chem. 2006;78:8324–8331. doi: 10.1021/ac061390w. [DOI] [PubMed] [Google Scholar]
- 4.Haimi P, Chaithanya K, Kainu V, Hermansson M, Somerharju P. Instrument-independent software tools for the analysis of MS-MS and LC-MS lipidomics data. In: Armstrong D, editor. Lipidomics, methods in molecular biology. vol 580. Humana Press; Totowa: 2009. pp. 285–294. [DOI] [PubMed] [Google Scholar]
- 5.Ejsing CS, Duchoslav E, Sampaio J, Simons K, Bonner R, Thiele C, Ekroos K, Shevchenko A. Automated identification and quantification of glycerolipid molecular species by multiple precursor scanning. Anal Chem. 2006;76:6202–6214. doi: 10.1021/ac060545x. [DOI] [PubMed] [Google Scholar]
- 6.Song H, Hsu F-F, Ladenson J, Turk J. Algorithm for processing raw mass spectrometric data to identify and quantitate complex lipid molecular species in mixtures by data-dependent scanning and fragment ion database searching. J Am Soc Mass Spectrom. 2007;18:1848–1858. doi: 10.1016/j.jasms.2007.07.023. [DOI] [PMC free article] [PubMed] [Google Scholar]
- 7.Yang K, Cheng H, Gross RW, Han X. Automated lipid identification and quantification by multi-dimensional mass spectrometry-based shotgun lipidomics. Anal Chem. 2009;81:4356–4368. doi: 10.1021/ac900241u. [DOI] [PMC free article] [PubMed] [Google Scholar]