

Abstract
Recent genome-wide association studies (GWAS) have identified a number of novel genetic associations with complex human diseases. In spite of these successes, results from GWAS generally explain only a small proportion of disease heritability, an observation termed the ‘missing heritability problem’. Several sources for the missing heritability have been proposed, including the contribution of many common variants with small individual effect sizes, which cannot be reliably found using the standard GWAS approach. The goal of our study was to explore a complimentary approach, which combines GWAS results with functional data in order to identify novel genetic associations with small effect sizes. To do so, we conducted a GWAS for lymphocyte count, a physiologic quantitative trait associated with asthma, in 462 Hutterites. In parallel, we performed a genome-wide gene expression study in lymphoblastoid cell lines from 96 Hutterites. We found significant support for genetic associations using the GWAS data when we considered variants near the 193 genes whose expression levels across individuals were most correlated with lymphocyte counts. Interestingly, these variants are also enriched with signatures of an association with asthma susceptibility, an observation we were able to replicate. The associated loci include genes previously implicated in asthma susceptibility as well as novel candidate genes enriched for functions related to T cell receptor signaling and adenosine triphosphate synthesis. Our results, therefore, establish a new set of asthma susceptibility candidate genes. More generally, our observations support the notion that many loci of small effects influence variation in lymphocyte count and asthma susceptibility.
INTRODUCTION
One general observation emerging from genome-wide association studies (GWAS) of complex human diseases is that common genetic variants can typically account for only a small fraction of the overall disease heritability (1,2). This observation is often referred to as the ‘missing heritability’ property of GWAS (1,3–8). Several possible sources for missing heritability have been discussed in the literature (1,4,7,8), including contributions from untyped rare variants, epistatic interactions between loci and gene-by-environment interactions. It is also widely acknowledged that many common variants associated with complex diseases remain undiscovered (5,9,10). As a result, the potential contribution of rare variation and different types of interactions notwithstanding, a certain proportion of the missing heritability is likely to be explained by the additive contribution of a large number of small-effect common variants, which are yet to be identified.
Uncovering additional common variants that are associated with disease, with a smaller effect size than those already found using the standard GWAS approach, will likely require significantly increasing sample sizes. This prospect becomes difficult to justify, however, as the expected effect size of additional common variants diminishes. Illustrating this point, a recent meta-analysis of human body mass index (BMI) GWAS, including 250 000 subjects, identified 32 associated single nucleotide polymorphisms (SNPs), accounting for only 1.45% of variation in BMI (11). It was estimated that while a 3-fold increase in sample size (to ∼750 000 subjects) would have likely resulted in detection of 10 times as many associations, the proportion of explained variance would be expected to remain under 5%.
Even with sample sizes of hundreds of thousands of individuals, the problem is lack of power to distinguish between true and spurious associations in a GWAS framework. An alternative approach is to integrate independent functional information with GWAS results in order to separate the most likely true associations from spurious signals. The rationale is similar to that of the traditional ‘candidate gene approach’ in principle, where prior functional information is used to effectively limit the number of association tests and thereby to increase power. Indeed, genome-wide functional data have often been used to prioritize among GWAS results and identify the most-promising candidates. For example, the first GWAS for asthma, which resulted in the identification of an associated genomic region containing 19 genes, used gene expression data to hone in on the most promising candidate gene (12). Specifically, gene expression profiles in lymphoblastoid cell lines (LCLs) from a set of asthmatic probands, their parents and siblings, was intersected with the GWAS data, resulting in the implication of ORMDL3 as a novel childhood asthma susceptibility gene (12). In this case, the integration of functional data also suggested that regulatory variation impacting the expression level of ORMDL3 was the likely risk-conferring mechanism for the associated variants. While subsequent studies have shown that the regulation of nearby genes, such as GSDML, may also be affected by the variant, the principle mechanism of regulatory variation influencing gene expression levels has not been challenged (13–16).
More generally, recent studies have shown that variants associated with complex traits are often also associated with variation in the expression levels of nearby genes (i.e. these variants are also often classified as expression quantitative trait loci, or eQTLs; 17–19). For example, Murphy et al. (20) intersected a list of eQTLs found in CD4+ lymphocytes from subjects with asthma with a list of loci that were reported to be associated with complex human diseases. They found 119 eQTLs for genes harboring SNPs that were previously associated with complex diseases, suggesting that in these cases, changes in gene regulation may contribute to disease susceptibility. Similarly, Zeller et al. (21) intersected eQTLs identified in monocytes with GWAS results for cardiovascular disease (CVD) risk factors. Using stringent statistical criteria, they identified two eQTLs in genomic regions that were also genetically associated with LDL cholesterol levels. The observations of Zeller et al. suggest that genetically controlled regulatory variation may play a role in determining variation in LDL cholesterol levels, and ultimately CVD risk.
These studies successfully intersected gene expression profiles with independently obtained GWAS results to provide further support for previously identified candidate loci. Potentially, functional data such as gene expression measurements and GWAS results can also be coupled in a combined analysis. The goal would be to identify novel genetic associations with weak effects, which cannot be distinguished from spurious associations (due to low power) using a standard GWAS approach alone. To date, we know of only few studies that use this paradigm. Naukkarinen et al. (22), for example, collected gene expression data in adipose tissue, and integrated it with results from a GWAS for variation in BMI. Using this approach, they identified 13 nominal genetic associations (P < 0.05) near genes whose expression levels across individuals were correlated with variation in BMI. In turn, Zhong et al. (23) used a similar rationale when they integrated results from an eQTL mapping study with GWAS results for type 2 diabetes (T2D). They found a cis eQTL SNP for the gene ME1, which was also weakly associated with T2D (below genome-wide significance). Subsequent work using a mouse knockout model supported the role of ME1 in determining susceptibility to T2D.
The results of these studies suggest that integrating gene expression and GWAS data may be an effective filtering and discovery approach, allowing one to uncover novel weakly associated genetic variants using easily annotated functional mechanisms. Here, we pursue a similar approach by leveraging gene expression data to identify candidate genes that influence inter-individual variation in lymphocyte counts in the Hutterites. The Hutterites offer a unique opportunity to study genetic regulation of complex traits because extensive data on a wide range of phenotypes and genome-wide genotype data for a large number of individuals are available for this founder population. In addition, the communal lifestyle practiced by the Hutterites leads to remarkably uniform environmental exposures (24). As lymphocyte counts were previously significantly associated (P = 1 × 10⁻⁴) with asthma in the Hutterites (25), we also extended our approach to map novel asthma susceptibility loci in an independent asthma GWAS data set.
RESULTS
We designed a study to identify loci associated with inter-individual variation in peripheral blood absolute lymphocyte counts, an immunological quantitative trait, which is correlated with asthma in the Hutterites (25). Our approach was to integrate gene expression profiling with GWAS data (Fig. 1; see Supplementary Material, Table S1 for summary of results). Specifically, we conducted a GWAS for peripheral blood lymphocyte counts in Hutterites, and characterized genome-wide gene expression levels in LCLs from an overlapping sample of Hutterites, chosen from the tails of the lymphocyte count distribution in this population.
Figure 1.

Study design. We performed a gene expression profiling study (1a) to identify differentially expressed genes between individuals with low and high lymphocyte counts, as well as a GWAS (1b) to identify loci associated with lymphocyte counts. We integrated data from the two studies (2) to identify candidate genes that would have been missed by the GWAS alone. Ultimately, we asked whether these candidate genes are also associated with asthma (3).
GWAS for peripheral blood lymphocyte count in Hutterites
To identify loci associated with lymphocyte counts, we conducted a GWAS using lymphocyte counts from 462 Hutterite subjects as the phenotypes, and genome-wide genotypes (using the Affymetrix 500k array platform; see Materials and Methods; 24,26,27). After filtering SNPs based on quality control measures (Materials and Methods), 279 749 autosomal SNPs remained. We tested for genetic association with lymphocyte counts using a general two-allele model (GTAM) test (24), which accounts for the known relatedness between individuals in our sample. A quantile–quantile plot did not indicate any remaining population structure or global departures from the null expectation (Supplementary Material, Fig. S1), and accordingly, the genomic inflation factor was calculated to be only 1.03.
Using this approach, however, we did not find any association that was significant at the genome-wide Bonferroni-corrected threshold of 1.8 × 10⁻⁷ (Fig. 2A; Supplementary Material, Table S2). Nevertheless, some of the most strongly associated SNPs are within or near genes that are involved in cellular proliferation or lymphocyte function. For example, the strongest signal [P-value = 4.32 × 10⁻⁷; false discovery rate (FDR) = 0.12] is at rs2746347 (Fig. 2B; Supplementary Material, Table S2), a SNP located in the first intron of PRKAA2 on chromosome 1. The gene product of PRKAA2 is the catalytic subunit of the adenosine monophosphate-activated protein kinase, an enzyme that regulates the cell cycle in response to glucose availability (28), which is up-regulated upon T cell receptor stimulation (29). The second strongest signal is at rs881827 (Fig. 2C; Supplementary Material, Table S2), located within an intron of S100B. This gene is thought to play a role in inflammatory responses and is secreted by activated T lymphocytes (30). These observations suggest that our GWAS approach is underpowered to identify loci with key roles in determining variation in lymphocyte counts. While hypotheses could be constructed for the relevance of many genes with marginally significant association signals (Supplementary Material, Table S2), the fact that we found no association at a genome-wide significance level makes it unappealing to pursue these hypotheses based on the GWAS data alone.
Figure 2.

GWAS for lymphocyte count. (A) Manhattan plot displaying the −log10 (P-values) for a GWAS of lymphocyte counts in 462 Hutterites. The top two SNPs are circled. (B) Close-up of the region around the top SNP, rs2746347 (red point), which is located within the first intron of PRKAA2. The estimated recombination rate (based on HapMap data) in the region is also plotted. (C) Close-up of the region around the second most significant SNP, rs881827 (red point), located within an intron of S100B.
Gene expression profiling
Although we did not find clear associations in the GWAS data, the physiologic trait ‘lymphocyte count’ does exhibit evidence of heritability (H2 = 0.41 in our GWAS population), implying that genetic variation explains nearly half of the phenotypic variation. We reasoned that some fraction of this genetic variation is likely to be regulatory in nature, as has been the case for most studied complex traits to date. Therefore, in parallel to the GWAS, we conducted a gene expression study in order to identify gene regulatory differences that are correlated with variation in lymphocyte counts across individuals.
To do so, we used Illumina HT-12 microarrays to interrogate the expression level of 11 282 autosomal genes in RNA samples from 96 Hutterite-derived LCLs (see Materials and Methods for quality control and data processing steps and Supplementary Material, Table S1 for the gene expression estimates for all samples; one sample failed quality control, thus subsequent analysis was performed with 95 individuals). To maximize the power of the study given the sample size, we chose individuals from the two extreme tails of the Hutterite lymphocyte count distribution (Fig. 3). The samples we chose from each tail of the distribution were balanced with respect to gender (24 males and 24 females chosen from each tail), age (mean age is 35.9 ± 8.3 and 35.0 ± 8.8 in samples chosen from each tail, respectively) and relatedness (median kinship coefficient of samples from each tail is 0.036).
Figure 3.
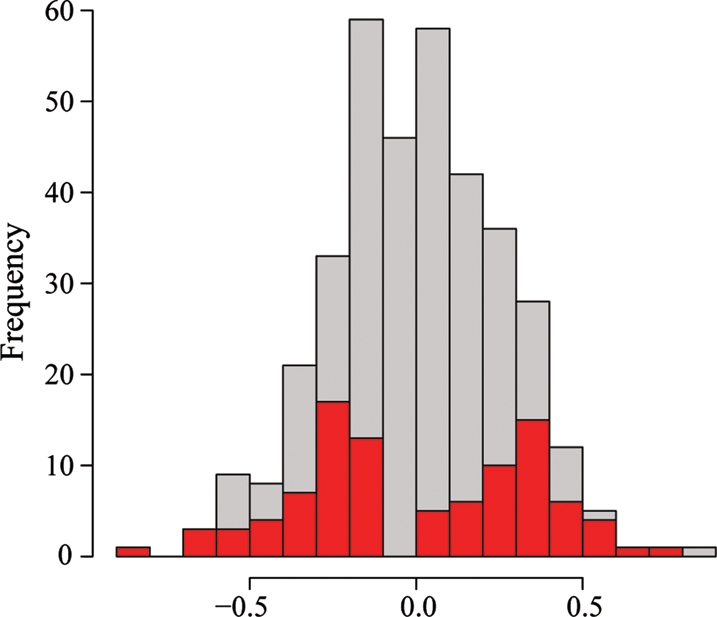
Choice of samples for the gene expression profiling study. A histogram of the distribution of lymphocyte counts (x-axis; the transformed residuals after correcting for age) for all available samples (gray bars) and for the 96 individuals chosen for the gene expression profiling study (red bars).
To identify differentially expressed genes between individuals with high or low lymphocyte counts, we employed a likelihood ratio test within the framework of a fixed-effect linear model (see Materials and Methods for more details). Using this approach, we classified 33 genes as differentially expressed between the two groups (FDR = 10%; Supplementary Material, Table S3). While the set of genes identified as differentially expressed is small, it is enriched with genes involved in relevant functions based on Gene Ontology (GO) classifications, such as ‘alpha-beta T cell differentiation’, and ‘alpha-beta T cell activation’ (at an FDR < 0.04; Supplementary Material, Table S4). We found enrichment of similar functions (including: ‘alpha-beta T cell receptor complex’, ‘T cell receptor complex’ and ‘T cell activation’; see Supplementary Material, Table S5), even when we extended our analysis to the 200 genes with the best evidence for differences in expression levels between individuals with high or low lymphocyte counts (P < 0.005). This observation indicates that, much like the GWAS results, our study is underpowered to identify all genes whose regulation is associated with lymphocyte counts.
Integrating results from the GWAS and gene expression data analysis
At the conclusion of the GWAS and gene expression profiling studies discussed above, we obtained independently ranked lists of (i) SNPs, ordered by the strength of association with lymphocyte count and, (ii) genes, ordered by the strength of the evidence for differences in expression levels between individuals with high or low lymphocyte count.
Our goal was to integrate the two lists in order to test whether genes tend to be ranked at the top of both lists more often than expected by chance alone. We hypothesized that SNPs that show evidence for a genetic association with lymphocyte count by GWAS will often be in proximity to genes that show independent evidence for differences in expression levels between individuals with high or low lymphocyte count. To test this hypothesis, we first paired genes and nearby SNPs.
There are several possible arbitrary ways to do so, including choosing the SNP closest to the transcription start site for each gene, choosing the most highly ranked SNP (based on the GWAS results) within a reasonable interval around each gene, or calculating a summary statistic of all the SNPs in an interval around each gene. These approaches, however, are likely to result in a bias towards enrichment of top-ranked pairs of SNPs and associated genes in genomic regions of high gene or SNP density or in regions characterized by high linkage disequilibrium (LD). As a result, the null expectation for the overlap of top-ranked pairs of SNPs and associated genes would be unclear.
Instead, we chose to pair genes and SNPs based on the evidence that genetic variation at a SNP contributes to regulatory variation of the gene. Specifically, for each of the 11 282 genes that were considered in the expression study, we identified the SNP that was most correlated with variation in expression levels among all nearby SNPs (i.e. within 150 kb of the gene). These SNPs can be broadly thought of as the best cis eQTL for each gene, even though, as expected, the evidence supporting the eQTL for many genes is quite weak (e.g. only 54% of genes have at least a nominally associated eQTL; Supplementary data, Fig. S2). Importantly, since we did not rely on a statistical cutoff to classify these eQTLs (by definition, we designated exactly one SNP as the cis eQTL for each gene), our approach is not susceptible to biases due to SNP density or LD structure (for example, we are not more likely to identify eQTLs in regions of high SNP density—as typically is the case—because we always classify one eQTL SNP for each gene). In this case, if we only consider the GWAS P-values associated with the classified cis eQTL SNPs (namely, we do not consider all genotyped SNPs but exactly one SNP per gene), we expect that under the null the P-values would be drawn from the uniform distribution.
We thus tested the null hypothesis that SNPs classified as eQTLs for the genes ranked at the top of the list based on the evidence for differences in expression levels between individuals with high or low lymphocyte count are not more likely to be ranked at the top of the independent list based on the strength of the genetic association with lymphocyte count. Because slightly different sets of SNPs met quality control thresholds in the two studies, we limited the analysis to 10 239 of the 11 282 expressed genes (see Materials and Methods for details). To determine the number of gene-SNP pairs to be considered in this analysis, we calculated the median GWAS P-value for increasingly larger subsets of top-ranked genes. Using this approach, we were able to reject the null hypothesis. For example, we found that for the top 33 genes, the median GWAS P-value of the associated cis eQTL SNPs is 0.28, which is much lower than the genome-wide (i.e. for all cis eQTL SNPs) median GWAS P-value of 0.50 and significantly lower than expected for a random set of 33 genes (by permutation, P = 0.006; Fig. 4; Supplementary data, Table S6). When we considered larger window sizes, we found that the most significant enrichment was at 193 genes, with a median GWAS P-value of the associated SNPs of 0.39 (by permutation, P = 8 × 10⁻⁴; Fig. 4; Supplementary data, Table S6).
Figure 4.

Integrating the GWAS and gene expression profiling studies. (A) The median lymphocyte count GWAS P-value (y-axis) for an expanding window of genes is plotted in red. Genes are ordered by the strength of evidence supporting differences in expression level between individuals with low and high lymphocyte counts. The blue curves indicate the confidence interval for median P-values for random sets of genes at each test set size (based on 10 000 permutations). (B) A box plot of the distribution of median lymphocyte count GWAS P-values for random sets of 193 genes (based on 10 000 permutations). The whiskers extend to the 5th and 95th percentile. Black points indicate the observed medians outside this range. The red ‘X’ indicates the median P-value observed for the top 193 differentially expressed genes.
The evidence for a genetic association with each of these 193 genes individually is weak, as expected given that the original GWAS uncovered no genome-wide significant associations and that we are considering the evidence of association at only one SNP for each gene. Yet, while the proportion of GWAS P-values that are smaller than the nominal threshold of 0.05 among all cis eQTLs is 5.3% (as expected for a well-calibrated test), we find a significant enrichment (9.3%; hypergeometric P = 0.014) of P-values meeting this threshold for the cis eQTL SNPs associated with the 193 genes. We also observe that the GWAS P-values for the cis eQTL SNPs of 117 (60.6%) of the 193 genes (hypergeometric P < 0.002; Supplementary data, Table S6) are smaller than the genome-wide median P-value of 0.50.
The list of SNPs that are genetically associated with lymphocyte count and the list of genes whose expression levels differ between individuals with high or low lymphocyte count were generated independently. Thus, the enrichment of gene-SNP pairs that are associated with low P-values in both lists is likely to be biologically significant. In particular, given this mutual corroboration, a possible model is that changes in the regulation of at least a subset of the 117 genes (those associated with a GWAS P-value that is smaller than the genome-wide median) may have a role in the regulation of lymphocyte count.
Integrating results from a GWAS for asthma
Lymphocyte counts were previously identified as an asthma-associated phenotype in the Hutterites (25). We therefore further hypothesized that the set of 117 genes that show evidence for an association with lymphocyte count will also be associated with susceptibility to asthma.
To test this hypothesis, we used results from the GABRIEL study, a consortium-based meta-analysis of asthma GWAS using 10 365 cases and 16 110 controls of European descent (31). We used the same integration approach described for the lymphocyte count GWAS. We were able to reject the null hypothesis that the asthma GWAS P-values for cis eQTL SNPs paired with the 117 lymphocyte count-associated genes were drawn from a null distribution (by permutation, P = 0.02; Fig. 5). Consistently, we found an enrichment of GABRIEL GWAS P-values smaller than 0.05 in the set of 117 genes (9.4%) compared with the corresponding well-calibrated genome-wide proportion of such P-values (5.3%; hypergeometric P = 0.044; Supplementary data, Table S6). These observations suggest that a subset of these 117 genes may be mediating asthma pathogenesis through changes in gene regulation, which affect lymphocyte activation.
Figure 5.
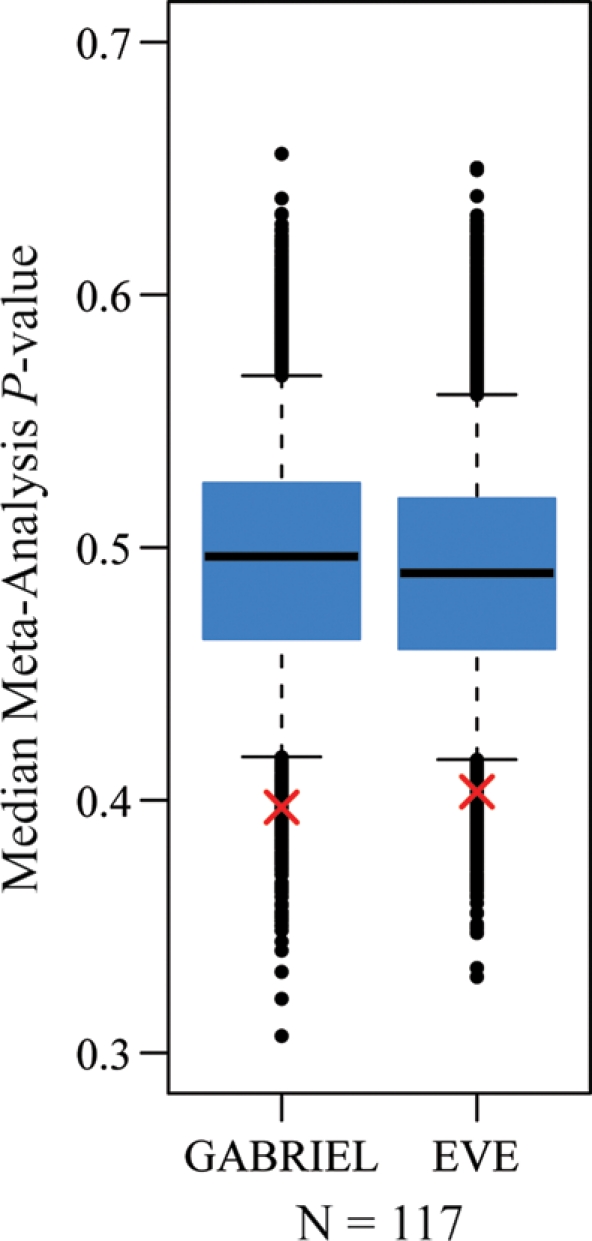
Integrating results with asthma meta-analyses. Box plots of the distribution of median GABRIEL meta-analysis P-values and median EVE meta-analysis P-value for random sets of 117 genes (based on 10 000 permutations). The whiskers extend to the 5th and 95th percentiles. Black points indicate the observed medians outside this range. For each box plot, the red ‘X’ indicates the median P-value observed for the 117 genes carried forward based on the analysis of association with lymphocyte counts.
As replication is considered the gold standard in confirming association results, we also sought to replicate our findings in another asthma study. To do so, we analyzed results from the EVE study, an independent meta-analysis of asthma GWAS in North American subjects of diverse ethnicities (32). Following the same approach as that outlined for the analysis of the GABRIEL data set, we were again able to reject the null hypothesis that asthma GWAS P-values for variants classified as cis eQTL for the 117 candidate genes were drawn from the genome-wide null distribution (by permutation, P = 0.027; Fig. 5). The independent replication of our results serves as strong evidence that at least a subset of these candidate genes plays an important role in asthma risk.
DISCUSSION
Our study was motivated by the observations of ‘missing heritability’ in GWAS for complex human diseases (1–9). Several non-mutually exclusive explanations for the missing heritability have been proposed (1,4,7,8), including the hypothesis that disease susceptibility is genetically determined by a large number of common variants with small effects, which cannot be reliably identified using standard GWAS approaches. In the case of asthma, some measure of support for this hypothesis is provided by the observation that already in 2006 (prior to the first GWAS for asthma) variation in more than 100 genes was implicated in asthma susceptibility (33), yet many variants show only weak associations that have often proved difficult to replicate (34–36).
In order to find novel candidate asthma genes, we used a combination of approaches, aimed at facilitating the identification of loci that are associated with asthma based on only weak statistical support, yet nevertheless are likely to be true positives. One important property of our study is the focus on an intermediate quantitative trait, lymphocyte counts, which is associated with asthma in the Hutterites (25). By identifying genes that influence variation in lymphocyte counts, we hoped to obtain simultaneous information on both the genetic architecture and the relevant functional mechanisms that are involved in the pathogenesis of asthma.
We performed our GWAS for lymphocyte counts using a modest sample size (462 individuals). As might be expected, we did not find any strong genetic association with the trait. This is consistent with the results of three much larger recent studies (with ∼15 000–20 000 subjects each), which also reported GWAS results in different populations for a number of blood differential counts, including lymphocyte count (37–39). Only the largest study (using almost 20 000 subjects of European ancestry) was able to identify genome-wide significant associations (at two genomic regions on chromosomes 6p and 19p) with lymphocyte count. Neither region was implicated in the analyses presented in our study, yet our study was not well suited to test for replicated association in these genomic regions. Indeed, the region on chromosome 6p is not well represented on the Affymetrix array platform that we used for genotyping (nor are any SNPs in strong LD), and the gene on chromosome 19p does not seem to be expressed in LCLs.
We also conducted a gene expression profiling study, using a sample size of 95 individuals, which resulted in the identification of only a small number of differentially expressed genes between individuals with low and high lymphocyte counts. We performed the gene expression study in Epstein-Barr virus (EBV)-transformed LCLs, which have been previously shown to be a useful model of gene regulatory phenotypes (12,17,19,40–44). It should be noted that both EBV transformation and cell line-specific artifacts can affect gene expression patterns (45–49). However, EBV transformation-driven expression patterns shared by all cell lines would not be classified as segregating with variation in lymphocyte counts. Furthermore, cell line-specific artifacts may increase the overall population variation in gene expression levels, but it is highly unlikely that these artifacts will stratify individuals based on their primary lymphocyte counts. Thus, the use of LCLs may result in reduced power to detect genes that are differentially expressed between individuals with high or low lymphocyte counts. However, genes with expression patterns associated with lymphocyte counts are more likely to be true positives than a private property of LCLs.
The results of the independent GWAS and gene expression profiling studies indicate that they are individually underpowered. In other words, it is difficult to distinguish true genetic associations and gene regulatory differences from spurious patterns in the GWAS and gene expression profiling studies, respectively. We therefore integrated data across the two independent studies.
Our rationale was simple: if the ranked lists resulting from the two studies do not reflect true biologically meaningful patterns, the intersection of these studies would be equivalent to picking loci at random. In other words, the overlap of genes with marginal statistical support for an expression level difference between individuals with low or high lymphocyte counts on the one hand, and loci with marginal support for a genetic association on the other hand, would be no better than that expected by chance alone. Our findings, however, supported the notion that the overlap is higher than expected by chance. Indeed, we identified a set of 117 genes that are likely to play a role in determining variation in lymphocyte counts through changes in gene regulation. Because our test relied on choosing exactly one eQTL for each gene, our approach resulted in the inclusion of weakly associated SNPs with both gene expression and lymphocyte count. On the one hand, this approach was more resistant to possible sampling biases (e.g. due to spurious signals from gene- or SNP-dense regions of the genome). On the other hand, we acknowledge that this property of our study also limits the ability to explain any individual association by a regulatory change affecting a nearby gene. That said, the evidence for association with lymphocyte count was significantly stronger for the subset of genes found using our approach compared with the null expectation when we considered genes expressed in LCLs but not included in our test set. This observation provides overall support for a connection between the most significant GWAS loci and variation in gene regulation.
We then extended these results to asthma, the phenotype of primary interest. When we considered the GABRIEL meta-analysis data, we found significant evidence supporting a role for the same 117 genes in asthma susceptibility, likely mediated by their influence on the numbers of circulating immune cells. We were also able to replicate these observations using results from the EVE consortium meta-analysis of asthma GWAS, which firmly supports the set of 117 loci as promising asthma candidate genes.
It is of course likely that only a subset of these 117 genes is involved in asthma pathogenesis for some of the same reasons detailed above. However, disentangling the contribution of any one gene is difficult and will require additional efforts, including functional assays, which are beyond the scope of the current study. An initial step in further characterizing the regulation of these candidate genes would be to profile their expression pattern in peripheral blood samples from asthmatics and healthy controls.
Our observations, however, are already informative in the context of previous work. Specifically, we looked for overlap between our candidate genes and those genes listed under the search term ‘asthma’ by the HuGE Navigator Phenopedia, an online database organized by disease that summarizes genetic association studies (http://hugenavigator.net/HuGENavigator/startPagePhenoPedia.do, accessed 02 June 2011; 50). The HuGE Phenopedia database serves as a catalog of genes that were listed in association studies of different diseases. Many genes are included when they are mentioned in relevant publications, regardless of whether an association was identified, replicated or confirmed. As such, inclusion in this database cannot be taken as strong evidence that the genes are indeed associated with asthma. On the other hand, the genes listed in this database are not a random collection either. Accordingly, when we considered only genes detected as expressed in LCLs as the background, we found a significant 2.2-fold enrichment (9.4%; hypergeometric P = 0.008) of our 117 candidate genes listed in the HuGE database as asthma putative candidate genes (the 11 genes listed were: PTGER4, MUC1, IL10RA, TNFRSF25, TNFSF10, CD3E, MST1, CXCL13, GNLY, CNOT6L, GRK4). Interestingly, if we were to consider the larger set of 193 genes associated with lymphocyte counts, the enrichment of genes also listed in the HuGE database as previously evaluated for genetic associations with asthma is even more pronounced (12.4%, or nearly a 3.1-fold enrichment; hypergeometric P = 1.0 × 10⁻⁶). While some of these annotations will not ultimately prove to be true positive associations, these observations of enrichment in our candidate gene set provides further support for the role of these genes in asthma susceptibility. In addition, this observation provides further support for our overall approach, as it indicates that we uncovered a set of likely asthma candidate genes.
Several genes on our candidate list may be particularly promising although they may not have previously been implicated as asthma candidate genes. For example, BCL11B, a transcription factor recently identified as a regulator of T cell lineage commitment and T cell identity maintenance (51), has been implicated in a variety of leukemias (52) and a model of inflammatory bowel disease (53), but to our knowledge has not previously been assessed for a role in asthma pathogenesis. The downstream regulatory targets of BCL11B have not yet been globally identified in T cells. A natural follow-up study would therefore be to couple gene expression and chromatin immunoprecipitation-sequencing (ChIP-seq) data to identify potential regulatory differences between asthmatics and healthy controls in primary T cells. Likewise, EZH2, the component of the polycomb group (PcG) responsible for catalyzing histone 3 lysine 27 tri-methylation, a repressive chromatin mark (54), is among our candidate genes. Remarkably, hematopoietic stem cells in the bone marrow of adult mice lacking Ezh2 fail to properly undergo lymphopoiesis (55), suggesting that variation in the basal level of expression of this chromatin modifier could potentially influence lymphocyte counts. PcG targets are known to be tissue-specific (56; in fact, mouse embryonic stem cells lacking Ezh2 give rise to a different phenotype), and so further studies of variation in regulatory targets of the PcG would be most valuable. For example, ChIP-seq across a panel of induced pluripotent stem cells from asthmatics and healthy controls could potentially identify differential targets influencing lymphocyte counts and even asthma susceptibility.
As a whole, the set of 117 loci is enriched with genes involved in biological functions and pathways that are expected to have an immune-mediated impact on asthma, while pointing to novel candidates (Supplementary data, Table S7). For example, we find enrichment for genes involved in T cell receptor signaling (including CD3E, CD3G, CD8A, LAT and LCP2) and mitochondrial adenosine triphosphate (ATP) synthesis (including ATP5H, ATP5I and ATP5L). These annotations fit intuitively with the regulation of lymphocyte counts. Lymphocyte homeostasis (in particular, T cell homeostasis) is influenced by T cell receptor interactions at multiple stages of T cell development, including thymic selection, naïve T cell homeostasis and T cell response to stimulation (57). In addition, cellular proliferation, a central process of the lymphocyte response to antigen, is energetically taxing, and there is evidence suggesting that the metabolic pathways activated in T cells can influence not only sensitivity to apoptotic signals, but lineage decisions as well (58,59). These functional annotations also potentially fit well with a role for these genes in asthma pathogenesis, as the classical paradigm for asthma involves a dysregulated T cell response in the airways (60–62). On the one hand, variation influencing the quantity of T cell receptor adaptor and co-receptor proteins in lymphocytes could potentially affect basal levels of lymphocytes as well as their propensity to become activated. On the other hand, a vigorous proliferative response requires energy, and lineage decisions and apoptosis signaling influenced by variation in metabolism could potentially have phenotypic consequences.
Put together, our results indicate that a combination of GWAS and functional molecular data on a genome-wide scale can be used to uncover additional disease-related genes with likely small-effect sizes. This approach can be easily adapted to many phenotypes, the major limitation being the availability of suitable samples for the expression studies. Going forward, it will be important to apply this approach to a variety of intermediate quantitative phenotypes relevant to asthma and other diseases sharing a dependence on lymphocytes for their pathogenesis.
MATERIALS AND METHODS
The current study was performed as part of a long-term research program on the genetic basis for complex phenotypes in the Hutterites (63–66). During this time, phenotypes and genotypes were collected in different phases and by using multiple platforms (typically the most cutting edge technology available at the time). The lymphocyte count data used in our GWAS were collected between 1996 and 1997 (25). The choice of individuals for our gene expression profiling study (48 individuals from each tail of the lymphocyte count distribution) was based on phenotypes collected on an overlapping sample of individuals studied between 2006 and 2009. Samples from 36 individuals were included in both the GWAS (n = 462 individuals) and the gene expression study (n = 95 individuals).
Phenotype data
Lymphocyte counts for all subjects were determined in peripheral blood samples, using a differential blood count. Subjects who reported taking antibiotics or steroids at the time of blood collection were excluded. Measurements for the GWAS were collected between 1996 and 1997, and the lymphocyte count data were included in previous studies (25,64). One clear outlier individual with a very low lymphocyte count (456 lymphocytes/μl) was removed from the study. We note that 47 of the 462 individuals included in the GWAS were diagnosed with asthma at the time of data collection. Lymphocyte count measurements for the gene expression profiling study were collected between 2006 and 2009. Fourteen of the 95 individuals ultimately included in the expression study were ever diagnosed with asthma. The absolute lymphocyte counts (cells/μl) were natural log-transformed and age-adjusted within each study (GWAS and gene expression profiling, respectively) separately.
Genotype data
Genome-wide genotypes for individuals included in the GWAS (n = 462) were obtained using the Affymetrix GeneChip® Mapping 500K Array Set [Affy 500k; Affymetrix, Santa Clara, CA, USA; genotype data previously reported in (65,66)]. Genotypes were called using BRLMM (http://media.affymetrix.com/support/technical/whitepapers/brlmm_whitepaper.pdf). Only SNPs with minor allele frequencies ≥ 5%, call rates ≥ 95%, Hardy–Weinberg equilibrium P-values ≥ 0.001 and fewer than five Mendelian errors across all subjects genotyped on the Affy 500k set (regardless of whether lymphocyte counts were available; n = 695) were included. SNP coordinates were re-annotated to the human genome (hg18, March 2006) according to the dbSNP130 records obtained using UCSC (http://genome.ucsc.edu/; 67) and Galaxy (http://main.g2.bx.psu.edu/; 68,69). After quality control and remapping, 279 749 SNPs were included in the GWAS.
Subjects included in the expression study were genotyped on either the Affymetrix 500k Array Set, the Genome-Wide Human SNP Array 5.0 or the Genome-Wide Human SNP Array 6.0 (as mentioned above, this study is part of a long-term project, during which individuals have been genotyped using the best available platform at the time). Human SNP Array 5.0 and 6.0 genotypes were called using Birdseed (70). SNPs were excluded based on the same quality control filters described above, except that they were calculated for all individuals genotyped on any platform (n = 1418). For eQTL mapping, 246 010 SNPs passed all quality control thresholds and 245 647 SNPs were re-annotated to the human genome (hg18, March 2006 based on dbSNP130 records). 138 206 of those were classified as nearby (within 150 kb) at least one gene.
Gene expression data
Gene expression estimates were determined using RNA samples from LCLs from 95 Hutterite individuals. The cells were cultured at 37°C and 5% CO2 in RPMI medium 1640 (containing L-glutamine) supplemented with 50 µg/ml gentamicin and 20% fetal bovine serum. Total RNA was extracted from each cell line using the RNeasy Mini Kit (Qiagen, Germantown, MD, USA). The quality and concentration of the RNA (Supplementary data, Table S8) were assessed using the Agilent 2100 Bioanalyzer (Agilent Technologies, Santa Clara, CA, USA). Total RNA samples were sent to the Southern California Genotyping Consortium (SCGC) where they were processed and hybridized to Illumina HT-12 v3 Expression BeadChips (Illumina, San Diego, CA, USA). Samples were sent in two separate batches, which were balanced with respect to lymphocyte count, sex, age and relatedness.
Probe intensity estimates were log2-transformed and quantile normalized using the Bioconductor package ‘lumi’ (71,72) in the R statistical environment (http://www.r-project.org/). The two batches of samples were first normalized and assessed for quality separately. We then combined and re-normalized the data from all arrays. While assessing the quality of the data (Supplementary data, Figs S3–S5), one sample was identified as a clear outlier and was removed from the study (Supplementary data, Fig. S4). Quality control steps also revealed two batch effects: one segregating samples within the second batch of samples and one segregating the two batches in the combined data set. Because we observed batch effects even after normalization (Supplementary data, Fig. S4), we explicitly regressed them out (as a fixed effect) and the data were then re-normalized.
We excluded from subsequent analysis genes that were likely not expressed in LCLs (any probe with a detection P-value > 0.01 in all samples). Median probe intensity estimates per gene were then used as the expression estimates for 14 367 genes. We further excluded 3085 genes because they were not associated with an hg18 RefSeq record or were not autosomal. This resulted in a final data set of expression estimated for 11 282 genes (Supplementary data, Table S1). In addition to the processed gene expression estimates available in Supplementary data, Table S1, raw and normalized expression data are available at the NCBI GEO database with accession number GSE30697 (http://www.ncbi.nlm.nih.gov/geo/query/acc.cgi?acc=GSE30697).
Statistical analysis
Genome-wide association study
In order to map genetic loci associated with lymphocyte count, we used the GTAM association test previously described in reference (73; see Supplementary data, Fig. S1 for a quantile–quantile plot of the GWAS results). Association testing is a two-step process. In the first step, the heritability of lymphocyte count was calculated for the sample using a maximum likelihood-based variance component estimation method (74). The fit of different models of heritability [environmental only (E), additive genetic effects (A + E), dominance genetic effects (D + E) or a full model (A + D + E)] were compared using the Bayesian information criterion, and the best fitting model was chosen (in our case, a model with additive and environmental effects with no dominance effects). We estimated the heritability of lymphocyte count in our sample to be 0.41. In the second step, each SNP was tested for association with the quantitative trait using a linear mixed-effects model framework. The model, below, has previously been described in detail (73):
Briefly, y is the vector of log-transformed lymphocyte counts. X is a matrix of covariates (age and an intercept term in this model) and β is a vector of the fixed-effect coefficients. G reflects the number of copies of an allele at a given SNP, while γ, the main quantity of interest in this model, is the effect size of each additional copy of that allele (we consider an additive model at each SNP). g is a random effect accounting for the polygenic background, which is assumed to be multivariate normally distributed with mean 0 and covariance determined by the kinship coefficient, additive genetic variance and dominance genetic variance. e accounts for the residual (or environmental) error and is assumed to be normally distributed with mean 0 and  variance. The two random effects are weighted by the respective variance component estimates from the first step of the analysis (determining heritability). The plots shown in Fig. 2B and C were originally created using LocusZoom (75).
Analysis of gene expression differences
To identify differentially expressed genes between individuals with high and low lymphocyte counts, we adopted a likelihood ratio test approach within a fixed-effects linear model framework. We used the following gene-specific model:
YExp represents the vector of normalized expression estimates for a particular gene across individuals. µ is the mean gene expression level across all samples. XExp is an indicator variable identifying the class (high or low lymphocyte count) to which the sample belongs, while β is the fixed effect. ɛ is an error term assumed to be normally distributed with mean 0 and variance  . To test for the effect of class membership on gene expression levels, we compared the null model where all samples are considered to be from the same class to an alternative where samples can be from one of two classes (see Supplementary Material, Fig. S6 for the distribution of P-values for the likelihood ratio test). Because the models are nested, we assumed that the differences in log-likelihood between the two models are χ2-distributed with 1 degree of freedom. The q values were estimated for P-values using the method of Storey and Tibshirani (76).
Analysis of functional annotations enrichment
We identified enriched gene annotation categories using GeneTrail (http://genetrail.bioinf.uni-sb.de/; 77). We used all GO functional annotations (78) and the KEGG pathways (79,80). When testing for enrichments among the 33 and 200 most differentially expressed gene sets (see Supplementary Material, Tables S4 and S5), we used all 11 282 expressed autosomal genes as a reference. In order to determine enrichments for the 117 lymphocyte count candidate gene set (see Supplementary Material, Table S7), we used the 10 239 genes included in the integrated analysis as a reference. P-values were determined based on the hypergeometric distribution, and the FDR was estimated using the method of Benjamini and Hochberg (81).
eQTL mapping
For the purposes of pairing genes and SNPs in order to link the gene expression study to the GWAS, we selected the proximal SNP (within 150 kb of the gene) with the best evidence of being a cis eQTL. We used the R package, ‘ICE’ (82), which maps eQTLs using a linear mixed-effects model framework. ICE was designed to take into account covariance across arrays that can lead to spurious trans-eQTL results. By replacing the array covariance matrix with the additive covariance matrix for the Hutterite pedigree, we were able to control for the additive polygenic effect of interrelatedness. Variance components were estimated using a restricted maximum likelihood method, and a P-value for each SNP was calculated using an F-test. The proximal SNP with the smallest P-value was then classified as the ‘eQTL’ for each gene.
Integrating the GWAS and expression profiling studies
To integrate our independent data sets, we assessed whether genetic variation around genes that show the best evidence for differences in expression levels between individuals with high or low lymphocyte count is also implicated as associated with variation in lymphocyte count. To do so, we calculated the median lymphocyte count GWAS P-value for an expanding subset of gene–SNP pairs, after ordering genes based on the evidence for differences in expression levels between individuals with high or low lymphocyte count. To test if the observed median P-value is significantly lower than expected by chance alone, given the number of genes in each subset, we randomly sampled the same number of genes from the remaining list of gene–SNP pairs and calculated the median GWAS P-value 10 000 times. The level of significance (i.e. permutation P-value) was determined by counting how many sampled sets of gene–SNP pairs had a lower median P-value than the observed set.
Because the eQTL mapping and lymphocyte count GWAS used different genotyping platforms, we allowed for a proxy SNP to replace the paired (eQTL) SNP if it was not included in the GWAS. To do so, we used SNAP (http://www.broadinstitute.org/mpg/snap/; 83), a web-based tool for identifying proxy SNPs, to generate a list of all SNPs in LD (at an r2 ≥ 0.5) with any of our eQTLs (r2 was based on HapMap LD, although results using 1000 genomes-based LD were broadly equivalent; data not shown). We chose the proxy SNPs with the highest LD to the eQTL SNP; if several proxy SNPs shared the same level of LD, we chose one at random to represent the eQTL SNP (see Supplementary Material, Fig. S7A for distribution of r2 values for proxy SNPs chosen).
To extend our analysis to identify loci associated with asthma, we used data from the GABRIEL meta-analysis (31). We downloaded the genome-wide association P-values from the GABRIEL website (http://www.cng.fr/gabriel/results.html). We used the random-effects pooled P-values and excluded any SNPs that were not analyzed in at least 25 of the 36 studies, resulting in the inclusion of 526 351 SNPs. We calculated the median P-value for the set of candidate genes identified in our lymphocyte count GWAS, and assessed the significance by permutation testing, using the remaining genes (using the same approach described above). We again allowed for proxy SNPs when the paired (eQTL) SNP was not present in the GABRIEL data (Supplementary Material, Fig. S7B).
In order to replicate our observations from the GABRIEL data set, we repeated the analysis using the results from the EVE meta-analysis, an asthma study incorporating results from GWAS conducted in several ethnically diverse North American populations (32). We note that the studies included in the EVE meta-analysis were entirely independent from those included in the GABRIEL meta-analysis. We used the results for combined meta-analysis incorporating all populations. Because the EVE study imputed SNPs using HapMap data, this resulted in the inclusion of 2 340 251 SNPs in our replication efforts. We proceeded by extending the same integration approach detailed for the lymphocyte count and GABRIEL data to the EVE results [i.e. calculating the median P-value for our candidate genes, allowing for proxy SNPs to replace unrepresented eQTLs (Supplementary Material, Fig. S7C), and assessing significance by permutation testing]. Five of the 10 239 genes were not represented by a proxy SNP in the EVE data set and were therefore excluded from the replication test.
Electronic database information
The gene expression data are available at the Gene Expression Omnibus (GEO) database (http://www.ncbi.nlm.nih.gov/geo/) under series accession number GSE30697.
SUPPLEMENTARY MATERIAL
FUNDING
This work was supported by the National Institutes of Health (HL092206 to Y.G., HL085197 and HL101651 to C.O., and partial support from T32 GM007197 to D.A.C.); and the American Heart Association (Predoctoral Fellowship to A.A.P.). Funding to pay the Open Access publication charges for this article was provided by NIH grant HL092206.
Supplementary Material
ACKNOWLEDGEMENTS
We thank J. Pritchard, M. Abney, L. Barreiro, J. Tung, D. Nicolae, Z. Gauhar and members of the Gilad and Ober labs for helpful discussions and comments on the manuscript, and A. Oktay for support in handling sample records. We thank the EVE consortium (grant HL101651) for access to their data.
Conflict of Interest statement. None declared.
REFERENCES
- 1.Manolio T.A., Collins F.S., Cox N.J., Goldstein D.B., Hindorff L.A., Hunter D.J., McCarthy M.I., Ramos E.M., Cardon L.R., Chakravarti A., et al. Finding the missing heritability of complex diseases. Nature. 2009;461:747–753. doi: 10.1038/nature08494. doi:10.1038/nature08494. [DOI] [PMC free article] [PubMed] [Google Scholar]
- 2.So H., Gui A.H.S., Cherny S.S., Sham P.C. Evaluating the heritability explained by known susceptibility variants: a survey of ten complex diseases. Genet. Epidemiol. 2011;35:310–317. doi: 10.1002/gepi.20579. doi:10.1002/gepi.20579. [DOI] [PubMed] [Google Scholar]
- 3.Clarke A.J., Cooper D.N. GWAS: heritability missing in action? Eur. J. Hum. Genet. 2010;18:859–861. doi: 10.1038/ejhg.2010.35. doi:10.1038/ejhg.2010.35. [DOI] [PMC free article] [PubMed] [Google Scholar]
- 4.Eichler E.E., Flint J., Gibson G., Kong A., Leal S.M., Moore J.H., Nadeau J.H. Missing heritability and strategies for finding the underlying causes of complex disease. Nat. Rev. Genet. 2010;11:446–450. doi: 10.1038/nrg2809. doi:10.1038/nrg2809. [DOI] [PMC free article] [PubMed] [Google Scholar]
- 5.Gibson G. Hints of hidden heritability in GWAS. Nat. Genet. 2010;42:558–560. doi: 10.1038/ng0710-558. doi:10.1038/ng0710-558. [DOI] [PubMed] [Google Scholar]
- 6.Lee S.H., Wray N.R., Goddard M.E., Visscher P.M. Estimating missing heritability for disease from genome-wide association studies. Am. J. Hum. Genet. 2011;88:294–305. doi: 10.1016/j.ajhg.2011.02.002. doi:16/j.ajhg.2011.02.002. [DOI] [PMC free article] [PubMed] [Google Scholar]
- 7.Maher B. Personal genomes: the case of the missing heritability. Nature. 2008;456:18–21. doi: 10.1038/456018a. doi:10.1038/456018a. [DOI] [PubMed] [Google Scholar]
- 8.Makowsky R., Pajewski N.M., Klimentidis Y.C., Vazquez A.I., Duarte C.W., Allison D.B., de los Campos G. Beyond missing heritability: prediction of complex traits. PLoS Genet. 2011;7:e1002051. doi: 10.1371/journal.pgen.1002051. doi:10.1371/journal.pgen.1002051. [DOI] [PMC free article] [PubMed] [Google Scholar]
- 9.Kutalik Z., Whittaker J., Waterworth D., Beckmann J.S., Bergmann S. Novel method to estimate the phenotypic variation explained by genome-wide association studies reveals large fraction of the missing heritability. Genet. Epidemiol. 2011;35:341–349. doi: 10.1002/gepi.20582. doi:10.1002/gepi.20582. [DOI] [PubMed] [Google Scholar]
- 10.Yang J., Benyamin B., McEvoy B.P., Gordon S., Henders A.K., Nyholt D.R., Madden P.A., Heath A.C., Martin N.G., Montgomery G.W., et al. Common SNPs explain a large proportion of the heritability for human height. Nat. Genet. 2010;42:565–569. doi: 10.1038/ng.608. doi:10.1038/ng.608. [DOI] [PMC free article] [PubMed] [Google Scholar]
- 11.Speliotes E.K., Willer C.J., Berndt S.I., Monda K.L., Thorleifsson G., Jackson A.U., Allen H.L., Lindgren C.M., Luan J., Magi R., et al. Association analyses of 249,796 individuals reveal 18 new loci associated with body mass index. Nat. Genet. 2010;42:937–948. doi: 10.1038/ng.686. doi:10.1038/ng.686. [DOI] [PMC free article] [PubMed] [Google Scholar]
- 12.Moffatt M.F., Kabesch M., Liang L., Dixon A.L., Strachan D., Heath S., Depner M., von Berg A., Bufe A., Rietschel E., et al. Genetic variants regulating ORMDL3 expression contribute to the risk of childhood asthma. Nature. 2007;448:470–473. doi: 10.1038/nature06014. doi:10.1038/nature06014. [DOI] [PubMed] [Google Scholar]
- 13.Halapi E., Gudbjartsson D.F., Jonsdottir G.M., Bjornsdottir U.S., Thorleifsson G., Helgadottir H., Williams C., Koppelman G.H., Heinzmann A., Boezen H.M., et al. A sequence variant on 17q21 is associated with age at onset and severity of asthma. Eur. J. Hum. Genet. 2010;18:902–908. doi: 10.1038/ejhg.2010.38. doi:10.1038/ejhg.2010.38. [DOI] [PMC free article] [PubMed] [Google Scholar]
- 14.Lluis A., Schedel M., Liu J., Illi S., Depner M., von Mutius E., Kabesch M., Schaub B. Asthma-associated polymorphisms in 17q21 influence cord blood ORMDL3 and GSDMA gene expression and IL-17 secretion. J. Allergy Clin. Immunol. 2011;127:1587–1594.e6. doi: 10.1016/j.jaci.2011.03.015. doi:10.1016/j.jaci.2011.03.015. [DOI] [PubMed] [Google Scholar]
- 15.Verlaan D.J., Berlivet S., Hunninghake G.M., Madore A.-M., Larivière M., Moussette S., Grundberg E., Kwan T., Ouimet M., Ge B., et al. Allele-specific chromatin remodeling in the ZPBP2/GSDMB/ORMDL3 locus associated with the risk of asthma and autoimmune disease. Am. J. Hum. Genet. 2009;85:377–393. doi: 10.1016/j.ajhg.2009.08.007. doi:16/j.ajhg.2009.08.007. [DOI] [PMC free article] [PubMed] [Google Scholar]
- 16.Verlaan D.J., Ge B., Grundberg E., Hoberman R., Lam K.C.L., Koka V., Dias J., Gurd S., Martin N.W., Mallmin H., et al. Targeted screening of cis-regulatory variation in human haplotypes. Genome Res. 2009;19:118–127. doi: 10.1101/gr.084798.108. doi:10.1101/gr.084798.108. [DOI] [PMC free article] [PubMed] [Google Scholar]
- 17.Nicolae D.L., Gamazon E., Zhang W., Duan S., Dolan M.E., Cox N.J. Trait-associated SNPs are more likely to be eQTLs: annotation to enhance discovery from GWAS. PLoS Genet. 2010;6:e1000888. doi: 10.1371/journal.pgen.1000888. doi:10.1371/journal.pgen.1000888. [DOI] [PMC free article] [PubMed] [Google Scholar]
- 18.Nica A.C., Montgomery S.B., Dimas A.S., Stranger B.E., Beazley C., Barroso I., Dermitzakis E.T. Candidate causal regulatory effects by integration of expression QTLs with complex trait genetic associations. PLoS Genet. 2010;6:e1000895. doi: 10.1371/journal.pgen.1000895. doi:10.1371/journal.pgen.1000895. [DOI] [PMC free article] [PubMed] [Google Scholar]
- 19.Ding J., Gudjonsson J.E., Liang L., Stuart P.E., Li Y., Chen W., Weichenthal M., Ellinghaus E., Franke A., Cookson W., et al. Gene expression in skin and lymphoblastoid cells: refined statistical method reveals extensive overlap in cis-eQTL signals. Am. J. Hum. Genet. 2010;87:779–789. doi: 10.1016/j.ajhg.2010.10.024. doi:10.1016/j.ajhg.2010.10.024. [DOI] [PMC free article] [PubMed] [Google Scholar]
- 20.Murphy A., Chu J.-H., Xu M., Carey V.J., Lazarus R., Liu A., Szefler S.J., Strunk R., Demuth K., Castro M., et al. Mapping of numerous disease-associated expression polymorphisms in primary peripheral blood CD4+ lymphocytes. Hum. Mol. Genet. 2010;19:4745–4757. doi: 10.1093/hmg/ddq392. doi:10.1093/hmg/ddq392. [DOI] [PMC free article] [PubMed] [Google Scholar]
- 21.Zeller T., Wild P., Szymczak S., Rotival M., Schillert A., Castagne R., Maouche S., Germain M., Lackner K., Rossmann H., et al. Genetics and beyond—the transcriptome of human monocytes and disease susceptibility. PLoS ONE. 2010;5:e10693. doi: 10.1371/journal.pone.0010693. doi:10.1371/journal.pone.0010693. [DOI] [PMC free article] [PubMed] [Google Scholar]
- 22.Naukkarinen J., Surakka I., Pietiläinen K.H., Rissanen A., Salomaa V., Ripatti S., Yki-Järvinen H., van Duijn C.M., Wichmann H.-E., Kaprio J., et al. Use of genome-wide expression data to mine the ‘Gray Zone’ of GWA studies leads to novel candidate obesity genes. PLoS Genet. 2010;6:e1000976. doi: 10.1371/journal.pgen.1000976. doi:10.1371/journal.pgen.1000976. [DOI] [PMC free article] [PubMed] [Google Scholar]
- 23.Zhong H., Beaulaurier J., Lum P.Y., Molony C., Yang X., MacNeil D.J., Weingarth D.T., Zhang B., Greenawalt D., Dobrin R., et al. Liver and adipose expression associated SNPs are enriched for association to type 2 diabetes. PLoS Genet. 2010;6:e1000932. doi: 10.1371/journal.pgen.1000932. doi:10.1371/journal.pgen.1000932. [DOI] [PMC free article] [PubMed] [Google Scholar]
- 24.Ober C., Abney M., McPeek M.S. The genetic dissection of complex traits in a founder population. Am. J. Hum. Genet. 2001;69:1068–1079. doi: 10.1086/324025. doi:10.1086/324025. [DOI] [PMC free article] [PubMed] [Google Scholar]
- 25.Ober C., Pan L., Phillips N., Parry R., Kurina L.M. Sex-specific genetic architecture of asthma-associated quantitative trait loci in a founder population. Curr. Allergy Asthma Rep. 2006;6:241–246. doi: 10.1007/s11882-006-0041-4. doi:10.1007/s11882-006-0041-4. [DOI] [PubMed] [Google Scholar]
- 26.Chong J.X., Oktay A.A., Dai Z., Swoboda K.J., Prior T.W., Ober C. A common spinal muscular atrophy deletion mutation is present on a single founder haplotype in the US Hutterites. Eur. J. Hum. Genet. 2011;19:1045–1051. doi: 10.1038/ejhg.2011.85. doi:10.1038/ejhg.2011.85. [DOI] [PMC free article] [PubMed] [Google Scholar]
- 27.Bellenguez C., Ober C., Bourgain C. Linkage analysis with dense SNP maps in isolated populations. Hum. Hered. 2009;68:87–97. doi: 10.1159/000212501. doi:10.1159/000212501. [DOI] [PMC free article] [PubMed] [Google Scholar]
- 28.Jones R.G., Plas D.R., Kubek S., Buzzai M., Mu J., Xu Y., Birnbaum M.J., Thompson C.B. AMP-activated protein kinase induces a p53-dependent metabolic checkpoint. Mol. Cell. 2005;18:283–293. doi: 10.1016/j.molcel.2005.03.027. doi:16/j.molcel.2005.03.027. [DOI] [PubMed] [Google Scholar]
- 29.Tamás P., Hawley S.A., Clarke R.G., Mustard K.J., Green K., Hardie D.G., Cantrell D.A. Regulation of the energy sensor AMP-activated protein kinase by antigen receptor and Ca2+ in T lymphocytes. J. Exp. Med. 2006;203:1665–1670. doi: 10.1084/jem.20052469. doi:10.1084/jem.20052469. [DOI] [PMC free article] [PubMed] [Google Scholar]
- 30.Steiner J., Marquardt N., Pauls I., Schiltz K., Rahmoune H., Bahn S., Bogerts B., Schmidt R.E., Jacobs R. Human CD8(+) T cells and NK cells express and secrete S100B upon stimulation. Brain Behav. Immun. 2011;25:1233–1241. doi: 10.1016/j.bbi.2011.03.015. doi:10.1016/j.bbi.2011.03.015. [DOI] [PubMed] [Google Scholar]
- 31.Moffatt M.F., Gut I.G., Demenais F., Strachan D.P., Bouzigon E., Heath S., von Mutius E., Farrall M., Lathrop M., Cookson W.O.C.M. A large-scale, consortium-based genomewide association study of asthma. N. Engl. J. Med. 2010;363:1211–1221. doi: 10.1056/NEJMoa0906312. doi:10.1056/NEJMoa0906312. [DOI] [PMC free article] [PubMed] [Google Scholar]
- 32.Torgerson D.G., Ampleford E.J., Chiu G.Y., Gauderman W.J., Gignoux C.R., Graves P.E., Himes B.E., Levin A.M., Mathias R.A., Hancock D.B., et al. Meta-analysis of genome-wide association studies of asthma in ethnically diverse North American populations. Nat. Genet. 2011;43:887–892. doi: 10.1038/ng.888. doi:10.1038/ng.888. [DOI] [PMC free article] [PubMed] [Google Scholar]
- 33.Ober C., Hoffjan S. Asthma genetics 2006: the long and winding road to gene discovery. Genes Immun. 2006;7:95–100. doi: 10.1038/sj.gene.6364284. doi:10.1038/sj.gene.6364284. [DOI] [PubMed] [Google Scholar]
- 34.Rogers A.J., Raby B.A., Lasky-Su J.A., Murphy A., Lazarus R., Klanderman B.J., Sylvia J.S., Ziniti J.P., Lange C., Celedon J.C., et al. Assessing the reproducibility of asthma candidate gene associations, using genome-wide data. Am. J. Respir. Crit. Care Med. 2009;179:1084–1090. doi: 10.1164/rccm.200812-1860OC. doi:10.1164/rccm.200812-1860OC. [DOI] [PMC free article] [PubMed] [Google Scholar]
- 35.Nicolae D.L., Ober C. (Too) great expectations: the challenges in replicating asthma disease genes. Am. J. Respir. Crit. Care Med. 2009;179:1078–1079. doi: 10.1164/rccm.200903-0456ED. doi:10.1164/rccm.200903-0456ED. [DOI] [PMC free article] [PubMed] [Google Scholar]
- 36.Vercelli D. Discovering susceptibility genes for asthma and allergy. Nat. Rev. Immunol. 2008;8:169–182. doi: 10.1038/nri2257. doi:10.1038/nri2257. [DOI] [PubMed] [Google Scholar]
- 37.Nalls M.A., Couper D.J., Tanaka T., van Rooij F.J.A., Chen M.-H., Smith A.V., Toniolo D., Zakai N.A., Yang Q., Greinacher A., et al. Multiple loci are associated with white blood cell phenotypes. PLoS Genet. 2011;7:e1002113. doi: 10.1371/journal.pgen.1002113. doi:10.1371/journal.pgen.1002113. [DOI] [PMC free article] [PubMed] [Google Scholar]
- 38.Okada Y., Hirota T., Kamatani Y., Takahashi A., Ohmiya H., Kumasaka N., Higasa K., Yamaguchi-Kabata Y., Hosono N., Nalls M.A., et al. Identification of nine novel loci associated with white blood cell subtypes in a Japanese population. PLoS Genet. 2011;7:e1002067. doi: 10.1371/journal.pgen.1002067. doi:10.1371/journal.pgen.1002067. [DOI] [PMC free article] [PubMed] [Google Scholar]
- 39.Reiner A.P., Lettre G., Nalls M.A., Ganesh S.K., Mathias R., Austin M.A., Dean E., Arepalli S., Britton A., Chen Z., et al. Genome-wide association study of white blood cell count in 16,388 African Americans: the Continental Origins and Genetic Epidemiology Network (COGENT) PLoS Genet. 2011;7:e1002108. doi: 10.1371/journal.pgen.1002108. doi:10.1371/journal.pgen.1002108. [DOI] [PMC free article] [PubMed] [Google Scholar]
- 40.Cheung V.G., Spielman R.S., Ewens K.G., Weber T.M., Morley M., Burdick J.T. Mapping determinants of human gene expression by regional and genome-wide association. Nature. 2005;437:1365–1369. doi: 10.1038/nature04244. doi:10.1038/nature04244. [DOI] [PMC free article] [PubMed] [Google Scholar]
- 41.Stranger B.E., Nica A.C., Forrest M.S., Dimas A., Bird C.P., Beazley C., Ingle C.E., Dunning M., Flicek P., Koller D., et al. Population genomics of human gene expression. Nat. Genet. 2007;39:1217–1224. doi: 10.1038/ng2142. doi:10.1038/ng2142. [DOI] [PMC free article] [PubMed] [Google Scholar]
- 42.Veyrieras J.-B., Kudaravalli S., Kim S.Y., Dermitzakis E.T., Gilad Y., Stephens M., Pritchard J.K. High-resolution mapping of expression-QTLs yields insight into human gene regulation. PLoS Genet. 2008;4:e1000214. doi: 10.1371/journal.pgen.1000214. doi:10.1371/journal.pgen.1000214. [DOI] [PMC free article] [PubMed] [Google Scholar]
- 43.Dimas A.S., Deutsch S., Stranger B.E., Montgomery S.B., Borel C., Attar-Cohen H., Ingle C., Beazley C., Gutierrez Arcelus M., Sekowska M., et al. Common regulatory variation impacts gene expression in a cell type-dependent manner. Science. 2009;325:1246–1250. doi: 10.1126/science.1174148. doi:10.1126/science.1174148. [DOI] [PMC free article] [PubMed] [Google Scholar]
- 44.Bullaughey K., Chavarria C.I., Coop G., Gilad Y. Expression quantitative trait loci detected in cell lines are often present in primary tissues. Hum. Mol. Genet. 2009;18:4296–4303. doi: 10.1093/hmg/ddp382. doi:10.1093/hmg/ddp382. [DOI] [PMC free article] [PubMed] [Google Scholar]
- 45.Choy E., Yelensky R., Bonakdar S., Plenge R.M., Saxena R., De Jager P.L., Shaw S.Y., Wolfish C.S., Slavik J.M., Cotsapas C., et al. Genetic analysis of human traits in vitro: drug response and gene expression in lymphoblastoid cell lines. PLoS Genet. 2008;4:e1000287. doi: 10.1371/journal.pgen.1000287. doi:10.1371/journal.pgen.1000287. [DOI] [PMC free article] [PubMed] [Google Scholar]
- 46.Stark A.L., Zhang W., Mi S., Duan S., O'Donnell P.H., Huang R.S., Dolan M.E. Heritable and non-genetic factors as variables of pharmacologic phenotypes in lymphoblastoid cell lines. Pharmacogenomics J. 2010;10:505–512. doi: 10.1038/tpj.2010.3. doi:10.1038/tpj.2010.3. [DOI] [PMC free article] [PubMed] [Google Scholar]
- 47.Çalışkan M., Cusanovich D.A., Ober C., Gilad Y. The effects of EBV transformation on gene expression levels and methylation profiles. Hum. Mol. Genet. 2011;20:1643–1652. doi: 10.1093/hmg/ddr041. doi:10.1093/hmg/ddr041. [DOI] [PMC free article] [PubMed] [Google Scholar]
- 48.Redon R., Ishikawa S., Fitch K.R., Feuk L., Perry G.H., Andrews T.D., Fiegler H., Shapero M.H., Carson A.R., Chen W., et al. Global variation in copy number in the human genome. Nature. 2006;444:444–454. doi: 10.1038/nature05329. doi:10.1038/nature05329. [DOI] [PMC free article] [PubMed] [Google Scholar]
- 49.Stranger B.E., Forrest M.S., Dunning M., Ingle C.E., Beazley C., Thorne N., Redon R., Bird C.P., de Grassi A., Lee C., et al. Relative impact of nucleotide and copy number variation on gene expression phenotypes. Science. 2007;315:848–853. doi: 10.1126/science.1136678. doi:10.1126/science.1136678. [DOI] [PMC free article] [PubMed] [Google Scholar]
- 50.Yu W., Clyne M., Khoury M.J., Gwinn M. Phenopedia and Genopedia: disease-centered and gene-centered views of the evolving knowledge of human genetic associations. Bioinformatics. 2010;26:145–146. doi: 10.1093/bioinformatics/btp618. doi:10.1093/bioinformatics/btp618. [DOI] [PMC free article] [PubMed] [Google Scholar]
- 51.Liu P., Li P., Burke S. Critical roles of Bcl11b in T-cell development and maintenance of T-cell identity. Immunol. Rev. 2010;238:138–149. doi: 10.1111/j.1600-065X.2010.00953.x. doi:10.1111/j.1600-065X.2010.00953.x. [DOI] [PubMed] [Google Scholar]
- 52.Gutierrez A., Kentsis A., Sanda T., Holmfeldt L., Chen S.-C., Zhang J., Protopopov A., Chin L., Dahlberg S.E., Neuberg D.S., et al. The BCL11B tumor suppressor is mutated across the major molecular subtypes of T-cell acute lymphoblastic leukemia. Blood. 2011;118:4169–4173. doi: 10.1182/blood-2010-11-318873. doi:10.1182/blood-2010-11-318873. [DOI] [PMC free article] [PubMed] [Google Scholar]
- 53.Vanvalkenburgh J., Albu D.I., Bapanpally C., Casanova S., Califano D., Jones D.M., Ignatowicz L., Kawamoto S., Fagarasan S., Jenkins N.A., et al. Critical role of Bcl11b in suppressor function of T regulatory cells and prevention of inflammatory bowel disease. J. Exp. Med. 2011;208:2069–2081. doi: 10.1084/jem.20102683. doi:10.1084/jem.20102683. [DOI] [PMC free article] [PubMed] [Google Scholar]
- 54.Ku M., Koche R.P., Rheinbay E., Mendenhall E.M., Endoh M., Mikkelsen T.S., Presser A., Nusbaum C., Xie X., Chi A.S., et al. Genomewide analysis of PRC1 and PRC2 occupancy identifies two classes of bivalent domains. PLoS Genet. 2008;4:e1000242. doi: 10.1371/journal.pgen.1000242. doi:10.1371/journal.pgen.1000242. [DOI] [PMC free article] [PubMed] [Google Scholar]
- 55.Mochizuki-Kashio M., Mishima Y., Miyagi S., Negishi M., Saraya A., Konuma T., Shinga J., Koseki H., Iwama A. Dependency on the polycomb gene Ezh2 distinguishes fetal from adult hematopoietic stem cells. Blood. 2011;118:6553–6561. doi: 10.1182/blood-2011-03-340554. doi:10.1182/blood-2011-03-340554. [DOI] [PubMed] [Google Scholar]
- 56.Squazzo S.L., O'Geen H., Komashko V.M., Krig S.R., Jin V.X., Jang S.-W., Margueron R., Reinberg D., Green R., Farnham P.J. Suz12 binds to silenced regions of the genome in a cell-type-specific manner. Genome Res. 2006;16:890–900. doi: 10.1101/gr.5306606. doi:10.1101/gr.5306606. [DOI] [PMC free article] [PubMed] [Google Scholar]
- 57.Jameson S.C. Maintaining the norm: T-cell homeostasis. Nat. Rev. Immunol. 2002;2:547–556. doi: 10.1038/nri853. doi:10.1038/nri853. [DOI] [PubMed] [Google Scholar]
- 58.Michalek R.D., Gerriets V.A., Jacobs S.R., Macintyre A.N., MacIver N.J., Mason E.F., Sullivan S.A., Nichols A.G., Rathmell J.C. Cutting edge: distinct glycolytic and lipid oxidative metabolic programs are essential for effector and regulatory CD4+ T cell subsets. J. Immunol. 2011;186:3299–3303. doi: 10.4049/jimmunol.1003613. doi:10.4049/jimmunol.1003613. [DOI] [PMC free article] [PubMed] [Google Scholar]
- 59.Michalek R.D., Rathmell J.C. The metabolic life and times of a T-cell. Immunol. Rev. 2010;236:190–202. doi: 10.1111/j.1600-065X.2010.00911.x. doi:10.1111/j.1600-065X.2010.00911.x. [DOI] [PMC free article] [PubMed] [Google Scholar]
- 60.Jutel M., Akdis C.A. T-cell subset regulation in atopy. Curr. Allergy Asthma Rep. 2011;11:139–145. doi: 10.1007/s11882-011-0178-7. doi:10.1007/s11882-011-0178-7. [DOI] [PMC free article] [PubMed] [Google Scholar]
- 61.Robinson D.S. The role of the T cell in asthma. J. Allergy Clin. Immunol. 2010;126:1081–1091. doi: 10.1016/j.jaci.2010.06.025. doi:16/j.jaci.2010.06.025. [DOI] [PubMed] [Google Scholar]
- 62.Umetsu D.T., Dekruyff R.H. Immune dysregulation in asthma. Curr. Opin. Immunol. 2006;18:727–732. doi: 10.1016/j.coi.2006.09.007. doi:10.1016/j.coi.2006.09.007. [DOI] [PubMed] [Google Scholar]
- 63.Ober C., Tsalenko A., Parry R., Cox N.J. A second-generation genomewide screen for asthma-susceptibility alleles in a founder population. Am. J. Hum. Genet. 2000;67:1154–1162. doi: 10.1016/s0002-9297(07)62946-2. doi:10.1016/S0002-9297(07)62946-2. [DOI] [PMC free article] [PubMed] [Google Scholar]
- 64.Weiss L.A., Pan L., Abney M., Ober C. The sex-specific genetic architecture of quantitative traits in humans. Nat. Genet. 2006;38:218–222. doi: 10.1038/ng1726. doi:10.1038/ng1726. [DOI] [PubMed] [Google Scholar]
- 65.Ober C., Tan Z., Sun Y., Possick J.D., Pan L., Nicolae R., Radford S., Parry R.R., Heinzmann A., Deichmann K.A., et al. Effect of variation in CHI3L1 on serum YKL-40 level, risk of asthma, and lung function. N. Engl. J. Med. 2008;358:1682–1691. doi: 10.1056/NEJMoa0708801. doi:10.1056/NEJMoa0708801. [DOI] [PMC free article] [PubMed] [Google Scholar]
- 66.Ober C., Nord A.S., Thompson E.E., Pan L., Tan Z., Cusanovich D., Sun Y., Nicolae R., Edelstein C., Schneider D.H., et al. Genome-wide association study of plasma lipoprotein(a) levels identifies multiple genes on chromosome 6q. J. Lipid Res. 2009;50:798–806. doi: 10.1194/jlr.M800515-JLR200. doi:10.1194/jlr.M800515-JLR200. [DOI] [PMC free article] [PubMed] [Google Scholar]
- 67.Karolchik D. The UCSC Table Browser data retrieval tool. Nucleic Acids Res. 2004;32:493D–496D. doi: 10.1093/nar/gkh103. doi:10.1093/nar/gkh103. [DOI] [PMC free article] [PubMed] [Google Scholar]
- 68.Goecks J., Nekrutenko A., Taylor J. Galaxy: a comprehensive approach for supporting accessible, reproducible, and transparent computational research in the life sciences. Genome Biol. 2010;11:R86. doi: 10.1186/gb-2010-11-8-r86. doi:10.1186/gb-2010-11-8-r86. [DOI] [PMC free article] [PubMed] [Google Scholar]
- 69.Blankenberg D., Von Kuster G., Coraor N., Ananda G., Lazarus R., Mangan M., Nekrutenko A., Taylor J. Galaxy: a web-based genome analysis tool for experimentalists. Curr. Protoc. Mol. Biol. 2010;Chapter 19 doi: 10.1002/0471142727.mb1910s89. 19.10.1–19.10.21. doi:10.1002/0471142727.mb1910s89. [DOI] [PMC free article] [PubMed] [Google Scholar]
- 70.Korn J.M., Kuruvilla F.G., McCarroll S.A., Wysoker A., Nemesh J., Cawley S., Hubbell E., Veitch J., Collins P.J., Darvishi K., et al. Integrated genotype calling and association analysis of SNPs, common copy number polymorphisms and rare CNVs. Nat. Genet. 2008;40:1253–1260. doi: 10.1038/ng.237. doi:10.1038/ng.237. [DOI] [PMC free article] [PubMed] [Google Scholar]
- 71.Gentleman R.C., Carey V.J., Bates D.M., Bolstad B., Dettling M., Dudoit S., Ellis B., Gautier L., Ge Y., Gentry J., et al. Bioconductor: open software development for computational biology and bioinformatics. Genome Biol. 2004;5:R80. doi: 10.1186/gb-2004-5-10-r80. doi:10.1186/gb-2004-5-10-r80. [DOI] [PMC free article] [PubMed] [Google Scholar]
- 72.Du P., Kibbe W.A., Lin S.M. umi: a pipeline for processing Illumina microarray. Bioinformatics. 2008;24:1547–1548. doi: 10.1093/bioinformatics/btn224. doi:10.1093/bioinformatics/btn224. [DOI] [PubMed] [Google Scholar]
- 73.Abney M., Ober C., McPeek M.S. Quantitative-trait homozygosity and association mapping and empirical genomewide significance in large, complex pedigrees: Fasting serum-insulin level in the Hutterites. Am. J. Hum. Genet. 2002;70:920–934. doi: 10.1086/339705. doi:10.1086/339705. [DOI] [PMC free article] [PubMed] [Google Scholar]
- 74.Abney M., McPeek M.S., Ober C. Estimation of variance components of quantitative traits in inbred populations. Am. J. Hum. Genet. 2000;66:629–650. doi: 10.1086/302759. doi:10.1086/302759. [DOI] [PMC free article] [PubMed] [Google Scholar]
- 75.Pruim R.J., Welch R.P., Sanna S., Teslovich T.M., Chines P.S., Gliedt T.P., Boehnke M., Abecasis G.R., Willer C.J. LocusZoom: regional visualization of genome-wide association scan results. Bioinformatics. 2010;26:2336–2337. doi: 10.1093/bioinformatics/btq419. doi:10.1093/bioinformatics/btq419. [DOI] [PMC free article] [PubMed] [Google Scholar]
- 76.Storey J.D., Tibshirani R. Statistical significance for genomewide studies. PNAS. 2003;100:9440–9445. doi: 10.1073/pnas.1530509100. doi:10.1073/pnas.1530509100. [DOI] [PMC free article] [PubMed] [Google Scholar]
- 77.Backes C., Keller A., Kuentzer J., Kneissl B., Comtesse N., Elnakady Y.A., Muller R., Meese E., Lenhof H.-P. GeneTrail—advanced gene set enrichment analysis. Nucleic Acids Res. 2007;35:W186–W192. doi: 10.1093/nar/gkm323. doi:10.1093/nar/gkm323. [DOI] [PMC free article] [PubMed] [Google Scholar]
- 78.Ashburner M., Ball C.A., Blake J.A., Botstein D., Butler H., Cherry J.M., Davis A.P., Dolinski K., Dwight S.S., Eppig J.T., et al. Gene ontology: tool for the unification of biology. The Gene Ontology Consortium. Nat. Genet. 2000;25:25–29. doi: 10.1038/75556. doi:10.1038/75556. [DOI] [PMC free article] [PubMed] [Google Scholar]
- 79.Kanehisa M., Goto S., Furumichi M., Tanabe M., Hirakawa M. KEGG for representation and analysis of molecular networks involving diseases and drugs. Nucleic Acids Res. 2010;38:D355–D360. doi: 10.1093/nar/gkp896. doi:10.1093/nar/gkp896. [DOI] [PMC free article] [PubMed] [Google Scholar]
- 80.Kanehisa M., Goto S. KEGG: kyoto encyclopedia of genes and genomes. Nucleic Acids Res. 2000;28:27–30. doi: 10.1093/nar/28.1.27. doi:10.1093/nar/28.1.27. [DOI] [PMC free article] [PubMed] [Google Scholar]
- 81.Benjamini Y., Hochberg Y. Controlling the false discovery rate: A practical and powerful approach to multiple testing. J. R. Statist. Soc. B. 1995;57:289–300. http://www.jstor.org/stable/2346101 . [Google Scholar]
- 82.Kang H.M., Ye C., Eskin E. Accurate discovery of expression quantitative trait loci under confounding from spurious and genuine regulatory hotspots. Genetics. 2008;180:1909–1925. doi: 10.1534/genetics.108.094201. doi:10.1534/genetics.108.094201. [DOI] [PMC free article] [PubMed] [Google Scholar]
- 83.Johnson A.D., Handsaker R.E., Pulit S.L., Nizzari M.M., O'Donnell C.J., de Bakker P.I.W. SNAP: a web-based tool for identification and annotation of proxy SNPs using HapMap. Bioinformatics. 2008;24:2938–2939. doi: 10.1093/bioinformatics/btn564. doi:10.1093/bioinformatics/btn564. [DOI] [PMC free article] [PubMed] [Google Scholar]
Associated Data
This section collects any data citations, data availability statements, or supplementary materials included in this article.