

The glycerol-3-phosphate acyltransferase Sct1p/Gat2p is shown to regulate fatty acyl chain desaturation by competing with the fatty acid desaturase Ole1p for C16:0-CoA. The activity of Sct1p depends on the level of expression and the phosphorylation state. The acyltransferase Cst26p regulates the phosphorylation of Sct1p.
Abstract
The degree of fatty acid unsaturation, that is, the ratio of unsaturated versus saturated fatty acyl chains, determines membrane fluidity. Regulation of expression of the fatty acid desaturase Ole1p was hitherto the only known mechanism governing the degree of fatty acid unsaturation in Saccharomyces cerevisiae. We report a novel mechanism for the regulation of fatty acid desaturation that is based on competition between Ole1p and the glycerol-3-phosphate acyltransferase Sct1p/Gat2p for the common substrate C16:0-CoA. Deletion of SCT1 decreases the content of saturated fatty acids, whereas overexpression of SCT1 dramatically decreases the desaturation of fatty acids and affects phospholipid composition. Whereas overexpression of Ole1p increases desaturation, co-overexpression of Ole1p and Sct1p results in a fatty acid composition intermediate between those obtained upon overexpression of the enzymes separately. On the basis of these results, we propose that Sct1p sequesters C16:0-CoA into lipids, thereby shielding it from desaturation by Ole1p. Taking advantage of the growth defect conferred by overexpressing SCT1, we identified the acyltransferase Cst26p/Psi1p as a regulator of Sct1p activity by affecting the phosphorylation state and overexpression level of Sct1p. The level of Sct1p phosphorylation is increased when cells are supplemented with saturated fatty acids, demonstrating the physiological relevance of our findings.
INTRODUCTION
The physical properties of a biological membrane are highly dependent on the lipid composition, which shows tremendous variation between different membranes and dependence on conditions (Dowhan, 1997). This variation is responsible for the plasticity of biomembranes, which plays a role in cellular adaptation to the environment and allows for cellular processes such as energy storage, signaling, transport, and membrane fusion and fission (Dowhan, 1997; Aguilar and de Mendoza, 2006; Hagen et al., 2010).
Membrane fluidity is an important physical property, which is to a large extent determined by the ratio of saturated versus unsaturated fatty acids (Los and Murata, 2004). Membrane fluidity is essential for maintaining the membrane barrier and for optimal functioning of membrane proteins (Singer and Nicolson, 1972; Martin et al., 2007). The presence of cis-double bonds in membrane lipid acyl chains causes disturbances in the acyl chain packing, which result in a much lower gel–to–liquid crystalline phase transition temperature of the membrane. A poikilothermic organism like the yeast Saccharomyces cerevisiae readily adapts the degree of desaturation of its acyl chains when shifted to another growth temperature to sustain membrane fluidity (Martin et al., 2007). The degree of desaturation of membrane lipids also depends on the function of the membrane they constitute. For example, the inner mitochondrial membrane harboring the enzyme complexes of the respiratory chain contains a higher amount of unsaturated phospholipid acyl chains than the plasma membrane that shields the cell from the extracellular milieu (Schneiter et al., 1999). Accordingly, the increase in overall fatty acid desaturation observed following a shift of yeast cells from fermentable to nonfermentable carbon source reflects the full development of the mitochondrial network (Tuller et al., 1999).
The yeast fatty acid profile is considerably less complex than its mammalian or plant counterparts, which contain a wide variation of fatty acids differing in length and degree of unsaturation. It consists mainly of C16 and C18 fatty acids bearing either one or no double bond. Fatty acid synthesis in S. cerevisiae is initiated by the acetyl-CoA carboxylase Aac1p and continued by the cytosolic multienzyme fatty acid synthase complex consisting of Fas1p and Fas2p, yielding acyl-CoA's with an acyl chain length of 16 or 18 carbon atoms (Tehlivets et al., 2007). The endoplasmic reticulum (ER)–based fatty acid elongases Elo1p, Elo2p, and Elo3p can elongate the acyl-CoA's up to C26. Although essential, the very long acyl chains are very low in abundance (Rossler et al., 2003).
Monounsaturated fatty acids account for ∼70–80% of total fatty acids and are synthesized from saturated fatty acyl-CoA substrates by the ER-resident Δ9-fatty acid desaturase Ole1p. Yeast can modulate the degree of acyl chain desaturation by varying the level of Ole1p expression. The expression of Ole1p is regulated at the level of transcription by temperature, carbon source, the presence of fatty acids in the growth medium, and oxygen levels (Martin et al., 2007). Transcriptional activation and mRNA stability of Ole1p requires ubiquitin-mediated cleavage of the homodimeric ER membrane proteins Spt23p and Mga2p by the 26S proteasome (Hoppe et al., 2000).
In a screen for gene products involved in acyl chain remodeling of the major membrane lipid phosphatidylcholine (PC; Boumann et al., 2003), we identified the glycerol-3-phosphate (G3P) acyltransferase Sct1p/Gat2p. The SCT1 gene was first characterized as a multicopy suppressor of a choline transport mutant also defective in phosphatidylethanolamine (PE) methylation (Matsushita and Nikawa, 1995), hence the name suppressor of choline transport 1. The 86-kDa enzyme Sct1p transfers acyl chains to the sn-1 position of G3P or dihydroxyacetonephosphate in the first committed step of glycerophospholipid synthesis, that is, the production of lysophosphatidic acid (lyso-PA; Zheng and Zou, 2001). The homologous protein Gpt2p/Gat1p catalyzes the same reactions, and deletion of SCT1 and GPT2 is synthetically lethal. Both enzymes are integral membrane phosphoproteins localized to the ER (Bratschi et al., 2009).
In the present study, the analysis of SCT1 deletion and overexpression strains demonstrates that Sct1p is a novel regulator of fatty acid desaturation by competing with the desaturase Ole1p for C16:0-CoA and sequestering C16:0 in lipids. The activity of Sct1p is regulated posttranslationally by phosphorylation. Moreover, the first component regulating Sct1p phosphorylation is reported, and the functional relevance of the phosphorylation of Sct1p is illustrated in wild-type yeast. To our knowledge, this is the first time that an acyltransferase is implicated in cellular fatty acid homeostasis.
RESULTS
Deletion of SCT1 changes the molecular species profile of PC by impairing acyl chain remodeling
In a screen for gene products required for acyl chain remodeling of PC, we examined the effect of deleting genes encoding (potential) acyltransferases on the molecular species profile of PC in a pct1 strain. Cells lacking Pct1p—the enzyme catalyzing the rate-limiting step of the CDP-choline pathway—rely on the methylation of PE for the synthesis of PC and require acyl chain exchange to obtain the steady-state molecular species profile of PC (Boumann et al., 2003). Among the candidate genes were the two G3P acyltransferases SCT1 (GAT2) and GPT2 (GAT1). Figure 1A shows the PC species profiles of pct1, sct1pct1, and gpt2pct1 cells obtained by electrospray ionization tandem mass spectrometry (ESI-MS/MS) parent-ion scanning for m/z 184. Diunsaturated 32:2 and 34:2 PC, containing two C16:1 acyl chains and a C16:1 and a C18:1 acyl chain, respectively, were detected as the most abundant PC species. The sct1pct1 cells (Figure 1A) showed a 45% decrease in 32:1 PC (C16:1 and C16:0) compared with the pct1 parent, which was compensated by slight increases in 34:2 and 36:2 PC. The PC species profile of the gpt2pct1 strain was similar to that of the pct1 strain except for a modest increase in 34:2 PC at the expense of 32:2 PC. Deletion of SCT1 hardly affected the molecular species profile of PE, the lipid precursor of PC in pct1 cells (Supplemental Figure S1), suggesting that SCT1 affects the PC species profile, the level of 32:1 PC in particular, postsynthetically.
FIGURE 1:

Deletion of SCT1 in a pct1 strain modifies the PC species profile by impairing acyl chain exchange. (A) The PC species profiles of pct1, sct1pct1, and gpt2pct1 cells grown to mid-log phase in SSL were analyzed by ESI-MS/MS in parent ion scans for m/z 184 in the positive ion mode. The relative abundance is shown for species that contribute at least 1% of total PC. Error bars represent the SD (pct1, n = 12; sct1pct1 and gpt2pct1, n = 3). (B) pct1 and sct1pct1 cells cultured in SL medium were pulse labeled with deuterium-labeled methionine for 10 min, followed by a 180-min chase with an excess of methionine. The species profile of PC synthesized during the pulse was determined at the indicated time points by ESI-MS/MS in parent ion scans for m/z 193 and is compared with the steady-state PC species profile (m/z 184). The relative abundance is shown for the four major PC species as mol% of total PC. Error bars represent the SD (n = 3).
To monitor postsynthetic modifications of PC, the cells were cultured on synthetic lactate medium (SL) and pulsed for 10 min with deuterium-labeled methionine, yielding PC with a (methyl-D3)3-labeled head group. The evolution of the molecular species profile of the newly synthesized PC during the chase with unlabeled methionine was recorded by ESI-MS/MS parent ion scans for m/z 193 and showed an almost twofold increase in 32:1 PC and a 20% decrease in 34:2 PC in the pct1 strain (Figure 1B, left), in agreement with Boumann et al. (2003). In contrast, in the sct1pct1 strain the molecular species profile of newly synthesized PC hardly changed during the chase (Figure 1B, right), indicating that the remodeling of PC by acyl chain exchange was strongly reduced.
The expression level of catalytically active Sct1p determines the cellular C16:0 content
To elucidate the role of Sct1p in PC remodeling, we first analyzed the fatty acid composition of the deletion strains sct1pct1 and gpt2pct1 (Figure 2A). Deletion of SCT1 decreased the cellular content of C16:0 by ∼50%, which was compensated by an increase in C18:1. Deletion of GPT2 did not cause major changes in fatty acid composition. Overexpression of Sct1p from an episomal GAL1 promoter in sct1pct1 resulted in a fourfold increase in C16:0 content and at least twofold increases in C14:0 and C18:0 at the expense of the levels of C16:1 and C18:1 (Figure 2B), the overall content of saturated acyl chains increasing from ∼12 to >40%. The level of overexpression was estimated to be at least 30-fold using Sct1p with a C-terminal HIS6HA3 tag (Figure 2C). The tag did not significantly influence fatty acid composition (Figure 2B). The slower-migrating band observed upon overexpression of SCT1 (Figure 2C, apparent weight ∼120 kDa) was previously assigned to the phosphorylated enzyme (Bratschi et al., 2009). Overexpression of a catalytically inactive form of Sct1p containing a mutation of a glycine residue in the active site (G253L; Lewin et al., 1999; Han et al., 2008) did not affect the fatty acid profile (Figure 2, B and C). From these results, we conclude that the enzyme activity of Sct1p determines fatty acid desaturation. The reduced PC remodeling in sct1pct1 is most likely a consequence of the reduced availability of C16:0.
FIGURE 2:

The expression level of catalytically active Sct1p determines the cellular content of C16:0 and affects cell growth. (A) Deletion of the SCT1 gene decreases the cellular C16:0 content. Cells from pct1, sct1pct1, and gpt2pct1 strains cultured in SL to mid-log phase were analyzed for fatty acid content by gas chromatography. (B) Overexpression of SCT1 results in a fourfold increase of C16:0 content dependent on the catalytic activity of Sct1p. Cells from sct1pct1 pYES2 (empty vector control), SCT1pct1 pYES2 (chromosomal expression), sct1pct1 pYES2-SCT1 (overexpression) and sct1pct1 pYES2-SCT1-HH (overexpression of tagged version), and sct1pct1 pYES2-SCT1[G253L]-HH (overexpression of a catalytically dead mutant) strains were cultured to mid-log phase in SGR. In A and B the relative abundance (mol%) of the six major fatty acids is shown, with the error bars representing the SD for sct1pct1 (n = 3), sct1pct1 pYES2 (n = 4), and pct1 pYES2 (n = 5) and the variation for the other strains (n = 2). (C) Western blots comparing the levels of HA-tagged Sct1p chromosomally expressed and episomally expressed from the GAL1 promotor in the pct1 background (left) and of overexpressed catalytically active and inactive Sct1p-HA in sct1pct1 cells (right). Dilution factors of the protein extracts are indicated (left); Sec61p served as loading control. (D) Serial dilutions of the indicated strains precultured in synthetic glucose medium were spotted on SGR agar plates and incubated at 30°C for 3 d. (E) Growth of sct1pct1 pYES2 and sct1pct1 pYES2-SCT1 in liquid SGR medium supplemented with 0.05% glucose. Data averaged from four independent experiments.
Overexpression of Sct1p was found to severely reduce the growth of the sct1pct1 strain on agar plates (Figure 2D). In liquid synthetic galactose-raffinose (SGR) medium containing a minimal amount of glucose, growth of the overexpression strain was reduced to a lesser extent (Figure 2E). Previously, comparable growth rates in liquid culture were reported upon overexpression of Sct1p in a gpt2sct1 double-deletion background (Bratschi et al., 2009).
Overexpression of Sct1p increases lipid synthesis and affects glycerolipid composition
The consequences of overexpressing Sct1p and the induced rise in C16:0 for cellular lipid content and lipid synthesis of sct1pct1 cells were investigated by comparing the overexpression strain to the empty vector control. Overexpression of Sct1p resulted in a 1.6 ± 0.2–fold (±SD, n = 4) increase in phospholipid content based on a comparison of the amount of phosphorus recovered in cellular lipid extracts per OD600 unit. To investigate whether the rise in phospholipid content resulted from an increase in de novo lipid synthesis, we determined the incorporation of [14C]acetate into lipids. A 1.3 ± 0.2–fold (±SD, n = 4) increase was observed in the incorporation of [14C]acetate in the total lipid fraction per OD600 unit during 1 h of radiolabeling. The distribution of the [14C] label between the phospholipid and the neutral lipid fractions was not dramatically changed, with 62 ± 7% of the [14C] label associated with phospholipids in the empty vector control versus 52 ± 11% in the overexpression strain (±variation, n = 2). ESI-MS/MS analysis revealed that overexpression of Sct1p increased the level of its product lyso-PA twofold, the increase being accounted for by C16:0 lyso-PA (Figure 3A). The level of phosphatidic acid (PA) increased hardly if at all, suggesting that the acylation of lyso-PA is rate limiting in PA synthesis. The molecular species profile of PA showed the appearance of disaturated PA and an increase in 32:1 and 34:1 at the expense of the diunsaturated and C18:1-containing PA species (Figure 3A), consistent with the change in cellular acyl chain composition. Consistent with the overall increase in cellular lipid synthesis and content, [14C]acetate labeling showed that the synthesis of PA was increased (Figure 3B). In addition, the incorporation of [14C]acetate in phosphatidylinositol (PI) and triacylglycerol (TAG) increased at the expense of PE and steryl ester in the phospholipid and neutral lipid classes, respectively, when Sct1p was overexpressed (Figure 3B). The changes in phospholipid and neutral lipid synthesis were mirrored in the steady-state phospholipid and neutral lipid composition (Supplemental Figure S2, A and B).
FIGURE 3:

The effect of overexpressing Sct1p on the levels and molecular species profiles of lyso-PA and PA and the synthesis of phospholipids and neutral lipids. (A) sct1pct1 cells transformed with pYES2 or pYES2-SCT1 were grown to mid-log phase in SGR and subjected to butanol extraction, and the lyso-PA and PA species profiles were analyzed by LC-MS/MS (right). The abundance of lyso-PA and PA in pmol/mg yeast dry weight (left) represents the sum of the abundance of all corresponding species. The error bars show the variation (n = 2). (B) Mid-log sct1pct1 cells containing pYES2 or pYES2-SCT1 and grown in SGR were incubated with [14C]acetate for 1 h and subjected to lipid extraction. Lipids were analyzed by TLC and quantified by phosphor imaging as detailed in Materials and Methods. The incorporation of [14C]acetate in glycerophospholipids (left) and neutral lipids (right) is shown as percentage of the total incorporation in the respective pools, with the error bars representing the variation (n = 2). CL, cardiolipin; DAG, diacylglycerol.
A comparison of the incorporation of [14C]acetate in the lipids of pct1 and sct1pct1 cells cultured in SL medium did not reveal differences in total lipid synthesis, in the distribution of label between neutral lipids and phospholipids, and in the relative incorporation into different phospholipid classes. The relative incorporation of [14C]acetate into the neutral lipid classes was similar to that reported previously for an sct1 deletion strain and its parental wild type (Zaremberg and McMaster, 2002), with an increase in the synthesis of TAG in pct1 versus sct1pct1 that was comparable to the increase induced by overexpression of Sct1p in sct1pct1 (Supplemental Figure S2C and Figure 3).
Similar to PA (Figure 3A), the molecular species profiles of the four major phospholipid classes revealed increased saturation upon Sct1p overexpression (Supplemental Figure S3), with rises in monounsaturated species predominating in PC and PE, and rises in disaturated species in phosphatidylserine (PS) and PI, all at the expense of the diunsaturated species. The increase in acyl chain saturation was strongest in PC, followed in decreasing order by PS, PI, and PE (Supplemental Figure S3C).
Co-overexpression of Sct1p and Ole1p reveals competition for the common substrate C16:0-CoA
The enzyme activity of Sct1p could enhance fatty acid saturation by sequestering C16:0 chains into lipids, thus depriving the desaturase Ole1p of its C16:0-CoA substrate. To address this possibility, we co-overexpressed Sct1p and Ole1p. Whereas overexpression of Sct1p caused a decrease in fatty acid desaturation as described earlier, overexpression of Ole1p increased fatty acid desaturation and slightly enhanced fatty acid length (Figure 4A). Co-overexpression gave rise to a fatty acid profile intermediate between those of the single-overexpression strains (Figure 4A). The expression level of Ole1p-Myc was similar in strains where pESC-OLE1 was cotransformed with pYES2 or pYES2-SCT1-HH (Figure 4B), and the expression level of Sct1p in sct1pct1 pYES2-SCT1-HH was not affected by cotransformation of pESC-OLE1 (unpublished data). Similar fatty acid profiles were obtained when an Ole1p-Myc–overexpressing strain was cotransformed with the vector encoding the His6HA3-tagged version of Sct1p (Supplemental Figure S4). Taken together, these results indicate that the two enzymes compete for the shared substrate C16:0-CoA.
FIGURE 4:

Co-overexpression of Ole1p and Sct1p reveals competition for the shared substrate C16:0-CoA. (A) sct1pct1 cells transformed with the indicated plasmids were cultured to mid-log phase in SGR and analyzed for their fatty acid contents by gas chromatography. The relative abundance (mol%) of the six major fatty acids and of total saturated fatty acids is shown, with the error bars representing the variation (n = 2). (B) Western blot analysis of the Ole1p expression levels of sct1pct1 pYES2 + pESC-OLE1 and sct1pct1 pYES2-SCT1-HH + pESC-OLE1. (c) Serial dilutions of sct1pct1 cells transformed with the plasmids indicated and precultured in synthetic glucose medium were spotted on SGR plates and incubated at 30°C for 3 d.
Co-overexpression of Sct1p and Ole1p partially relieved the growth defect of cells overexpressing Sct1p (Figure 4C). Overexpression of Ole1p slightly impaired growth.
The growth phenotype and increased C16:0 content induced by overexpression of Sct1p are suppressed by deletion of the ACB1 and CST26 genes; Cst26p affects phosphorylation and expression of Sct1p
To get further insight in the mechanism by which Sct1p regulates fatty acid saturation and its biological significance, we screened for suppressors of the growth phenotype caused by overexpression of Sct1p. The screen comprised 10 double-knockout strains in which a gene involved in lipid metabolism was deleted in the pct1 background and yielded two suppressors.
Deletion of ACB1, coding for the yeast acyl-CoA–binding protein that has been implicated in the termination of fatty acid synthesis and in fatty acid elongation (Schjerling et al., 1996; Gaigg et al., 2001), partially restored the growth defect (Figure 5A, left) and partially reduced the accompanying rise in C16:0 content (Figure 5B) conferred by overexpression of Sct1p. Immunoblot analysis verified that the level of overexpression of Sct1p was not affected by deletion of ACB1 (Figure 5C). Closer inspection of the fatty acid profiles (Figure 5B) reveals the shortening and increased unsaturation of the acyl chains characteristic of acb1 strains (Choi et al., 1996). Deletion of ACB1 was previously shown to be accompanied by a >5-fold activation of OLE1 transcription (Choi et al., 1996; Schjerling et al., 1996). Therefore the partial suppression of the Sct1p overexpression phenotype in acb1pct1 cells, that is, under conditions where untagged Ole1p is expressed from its endogenous promoter, supports our conclusion that competition between Sct1p and Ole1p for C16:0-CoA determines cellular fatty acid saturation.
FIGURE 5:

The growth phenotype and increased C16:0 content induced by overexpression of Sct1p are suppressed by deletion of the ACB1 and CST26 genes; Cst26p affects phosphorylation and expression of Sct1p. (A) Serial dilutions of the indicated strains precultured in synthetic glucose medium were spotted on SGR plates and incubated at 30°C for 5 d. (B) Cells from the indicated strains cultured to mid-log phase in SGR were analyzed for fatty acid contents by gas chromatography. The relative abundance (mol%) of the six major fatty acids is shown, with the error bars representing the SD for pct1 (n = 5) and the variation for acb1pct1 and cst26pct1 (n = 2). (C) Western blot analysis of Sct1p-HA expressed from pYES2-SCT1-HH in the strains indicated.
It is surprising that deletion of CST26/PSI1 fully suppressed the growth phenotype (Figure 5A, right) and the increase in fatty acid saturation (Figure 5B) induced by Sct1p overexpression. CST26 codes for a 46-kDa protein with homology to acyltransferases (Neuwald, 1997) that is localized to lipid particles (Natter et al., 2005) and is required for the incorporation of stearic acid (C18:0) into PI (Le Guedard et al., 2009). Of interest, the cst26pct1 cells exhibited a decrease in C18 content relative to the pct1 strain (Figure 5B). Western blot analysis of the level of overexpression of tagged Sct1p showed at least twofold decrease in the total Sct1p–hemagglutinin (HA) signal in cst26pct1 as compared with pct1 and sct1pct1 (Figure 5C, right). Moreover, the migration pattern of overexpressed Sct1p-HA in cst26pct1 cells differed from that in pct1 and sct1pct1 cells, with the upper band (apparent molecular weight 120 kDa) containing 85% of the total Sct1p-HA signal in cst26pct1 versus 55% in pct1 and sct1pct1, as determined by densitometry. Because the upper band was shown to correspond to the phosphorylated enzyme (Bratschi et al., 2009), these findings strongly suggest that phosphorylation inactivates Sct1p and that Cst26p regulates (de)phosphorylation of Sct1p.
We conclude that deletion of CST26 fully suppresses the growth phenotype and increase in C16:0 content conferred by overexpression of Sct1p by a mechanism that most likely involves inactivation of Sct1p by increased phosphorylation and decreased expression.
Phosphorylation of Sct1p is enhanced by the presence of C16:0 in the culture medium
The foregoing results indicate that the level of expression and the phosphorylation state of Sct1p are potentially critical parameters in regulating fatty acid desaturation. To examine whether yeast uses these regulatory mechanisms to control the activity of chromosomally expressed Sct1p, we monitored the expression of chromosomally HIS6HA3-tagged Sct1p under conditions known to influence fatty acid composition. Varying the growth temperature from 30 to 37°C or the carbon source (glucose vs. lactate; Martin et al., 2007) did not affect the expression level or phosphorylation state of Sct1p (Supplemental Figure S5). A more straightforward way to alter the fatty acid composition is by supplementing fatty acids to the culture medium. A slow-migrating band appeared upon addition of C16:0 to wild-type (WT) cells in yeast extract/peptone/dextrose (YPD), and the intensity of the slow-migrating band increased twofold upon addition of C16:0 to pct1 cells in synthetic glucose medium (Figure 6). In contrast, addition of C18:1 did not affect the migration pattern of Sct1p-HA. Densitometric analysis of the blots revealed that 10 and 30% of Sct1p-HA were phosphorylated in the WT and pct1 cells grown in the presence of C16:0, respectively, versus 0 and 15% with no added fatty acid or C18:1 present.
FIGURE 6:
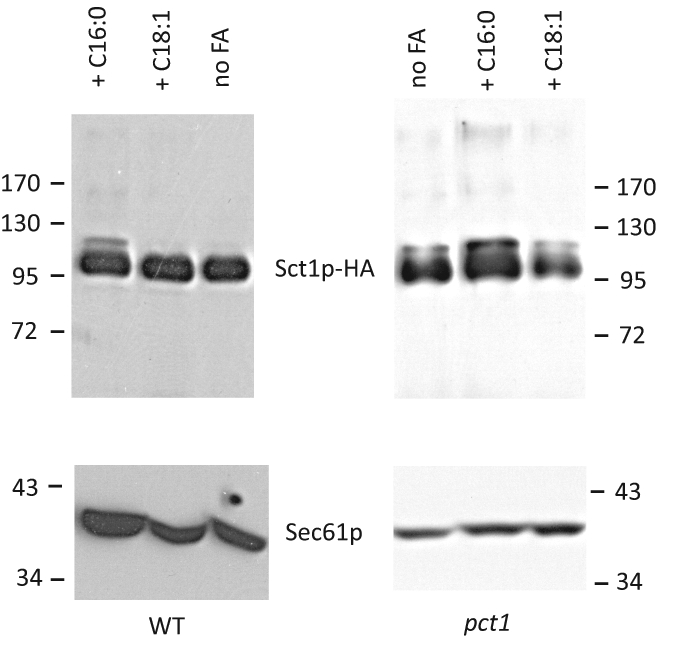
The level of phosphorylation of Sct1p is enhanced by the presence of C16:0 in the culture medium. Wild-type (BY4741 SCT1HH) cells were grown to mid-log phase in YPD containing 1% (wt/vol) Brij35 with or without 0.5 mM C16:0 or 0.5 mM C18:1. pct1 SCT1HH cells were grown to mid-log phase in synthetic glucose medium with 0.2% Brij35 with or without 0.1 mM C16:0 or 0.1 mM C18:1. FA, fatty acid.
DISCUSSION
On the basis of the results presented, we propose a new mechanism for the control of fatty acid desaturation at the level of acyl chain incorporation into PA that is juxtaposed to the regulation of Ole1p activity (Martin et al., 2007). We propose that Sct1p shields C16:0-CoA and other saturated acyl-CoA's from the introduction of a double bond by Ole1p by preferentially sequestering them into lipids (Figure 7). We furthermore propose that the competition for substrate with the desaturase Ole1p is determined by the activity of Sct1p, which in turn depends on the expression level and the phosphorylation state of the enzyme. In the following we discuss the new competition model and the regulation of Sct1p activity by phosphorylation, including the role of Cst26p, the growth phenotype of Sct1p overexpression strains, the effects of SCT1 deletion and overexpression on lipid metabolism, and the implications of our findings for yeast and higher eukaryotes.
FIGURE 7:

Proposed mechanism for regulation of fatty acid desaturation by competition for C16:0-CoA between Sct1p and Ole1p. C16:0-CoA synthesized by the fatty acid synthase is sequestered into lipids by Sct1p and possibly other acyltransferases, decreasing desaturation (orange). Alternatively, Ole1p introduces a double bond, yielding C16:1-CoA and increasing desaturation (green). The elongases produce C18:0-CoA, which can be incorporated into lipids by Sct1p or other acyltransferases or converted into C18:1-CoA by Ole1p. Free fatty acids originating from lipid degradation by lipases recycle into the acyl-CoA pool after activation by acyl-CoA synthetases. To reduce complexity, elongation of acyl-CoA beyond C18 and metabolic fates of acyl-CoA's other than incorporation into lipids are omitted in the diagram.
A new paradigm for regulation of fatty acid desaturation involving competition between a desaturase and an acyltransferase
Although the competition for substrate between Sct1p and Ole1p primarily revolves around C16:0-CoA, the preferred substrate of Sct1p in vivo (Zheng and Zou, 2001), our results indicate that also C18:0-CoA and C14:0-CoA are subject to competition between Sct1p and Ole1p (Figures 2B and 4A). Overexpression of Ole1p caused an increase in average acyl chain length, as was observed previously (Kajiwara et al., 2000), suggesting that Ole1p promotes elongation to C18:0-CoA by efficient desaturation to C18:1-CoA. Consistently, a shortening of fatty acids was observed upon ablation of unsaturated fatty acid synthesis (Pineau et al., 2008). Overexpression of Sct1p was found to decrease the average cellular fatty acid length, suggesting that Sct1p also competes for substrate with the fatty acid elongases that use C16:0-CoA as substrate, although it must be noted that the role of the fatty acid elongases in the synthesis of C18:0-CoA is not fully established (Rossler et al., 2003). According to the proposed mechanism, the substrate preferences and the activities of Sct1p, Ole1p, and the fatty acid elongases determine the cellular fatty acid composition (Figure 7). The influence of additional enzymes that consume large amounts of acyl-CoA, including the other enzymes involved in PA synthesis, Gpt2p, Ale1p, and Slc1p, remains to be investigated. The fatty acid composition of the gpt2 deletion strain (Figure 2A) and its reported lack of substrate preference (Zheng and Zou, 2001) suggest that Gpt2p is not a major player in regulating the degree of fatty acid desaturation.
Phosphorylation of Sct1p inhibits its activity in vivo and is regulated by Cst26p
The G3P acyltransferases Sct1p and Gpt2p were recently demonstrated to be phosphoproteins, and phosphorylation was proposed to regulate their activity (Bratschi et al., 2009). The enhanced phosphorylation of Sct1p and the accompanying complete reversal of the increased acyl chain saturation observed in the cst26 strain overexpressing SCT1 indicate that Sct1p is inactivated by phosphorylation. Preliminary experiments addressing the mechanism by which phosphorylation affects Sct1p activity showed that treatment with phosphatase of cell homogenates from an Sct1p-overexpressing strain does not affect the enzyme activity in vitro, suggesting that phosphorylation exerts an indirect effect on Sct1p activity in vivo, for example, by affecting access to substrate. The decrease in expression level of overexpressed Sct1p in the cst26 background may be a consequence of degradation of the phosphorylated enzyme. The functional significance of Sct1p phosphorylation in determining yeast fatty acid composition is evidenced by the increase in phosphorylation of chromosomally expressed Sct1p following exogenous addition of C16:0. Yeast has been shown to readily incorporate exogenous C16:0 in glycerolipids (Wagner and Paltauf, 1994). The modulation of Sct1p phosphorylation could provide a feedback mechanism by which yeast controls the incorporation of saturated acyl chains into its lipids.
A number of key enzymes in yeast lipid biosynthesis, including CTP synthase, PS synthase, and choline kinase, are regulated by phosphorylation involving protein kinases A and C (Carman and Kersting, 2004). Recently the Mg2+-dependent PA phosphatase Pah1p was found to be inactivated by phosphorylation of an amphipathic helix that controls membrane translocation (O'Hara et al., 2006; Karanasios et al., 2010). The major lipase Tgl4p that mobilizes free fatty acids from TAG for the synthesis of PA is activated by the cyclin-dependent kinase Cdk1p/Cdc28p, linking lipid synthesis to the cell cycle (Kurat et al., 2009). A genome-wide screen identified 16 kinases that use Sct1p as a substrate in vitro, including the cyclin-dependent kinase Pho85p and the p21-activated kinase Ste20p (Ptacek et al., 2005). Ste20p was linked to lipid metabolism, as it downregulates sterol uptake (Lin et al., 2009) and binds to and is activated by PA (Harkins et al., 2008). Therefore it is tempting to speculate that Ste20p phosphorylates and deactivates Sct1p as PA levels rise, which would implicate Ste20p in the regulation of fatty acid desaturation in addition to its role in sterol homeostasis. Future research should identify the kinase(s) and phosphatase(s) acting on Sct1p and elucidate how its regulation by phosphorylation interfaces with other regulatory cascades.
It is remarkable that Cst26p was found to be required for maintaining the dephosphorylated state of Sct1p under conditions of Sct1p overexpression. Cst26p/Psi1p was only recently identified as an acyl-CoA–dependent acyltransferase involved in the acyl chain remodeling of PI, incorporating C18:0 at the sn-1 position (Le Guedard et al., 2009). The decreased cellular C18 content in cst26pct1 (Figure 5B) is consistent with the loss of C18:0-CoA consumption by Cst26p reducing the activity of the elongases by a decrease in the substrate-to-product ratio. The inactivation of overexpressed Sct1p upon deletion of CST26 could reflect a feedback mechanism to decrease the cellular content of saturated fatty acids when their incorporation into PI is impaired. Cst26p may inhibit the kinase or activate the phosphatase acting on Sct1p via its impact on the molecular species profile of PI or downstream phosphoinositides. Alternatively, Cst26p may be a dual-function protein with independent roles in PI metabolism and in the regulation of Sct1p activity.
Growth defect and adaptation of membrane lipid composition
The extent of the decrease in fatty acid desaturation correlates with the severity of the reduction of growth in the co-overexpression experiment (Figure 4), indicating that the increased acyl chain saturation plays a pivotal role in the growth defect conferred by Sct1p overexpression. The dramatic increase in fatty acyl chain saturation probably reduces membrane fluidity, impairing membrane processes. The growth phenotype and the increase in fatty acid saturation observed in liquid culture (Figure 2) resemble the effects of switching off fatty acid desaturation by inactivating heme synthesis (Pineau et al., 2008), a condition inducing ER stress (Pineau et al., 2009).
Overexpression of Sct1p results in increased synthesis of PA and a consequent overall increase in cellular lipid content. In contrast to deletion of SCT1, overexpression does not affect the relative rates of synthesis of TAG versus sterolesters in the neutral lipid fraction (Zaremberg and McMaster, 2002). Among the glycerophospholipids, the synthesis of PI increases at the expense of PE. The PI synthase Pis1p may have a preference for C16:0-containing CDP-DAG and hence convert more CDP-DAG into PI upon Sct1p overexpression. Alternatively, the increase in PA synthesis due to Sct1p overexpression may derepress the UASINO genes, enhancing the production of inositol, which in turn promotes the synthesis of PI at the expense of PS, the biosynthetic precursor of PE (Kelley et al., 1988; Loewen et al., 2004). Irrespective of the mechanism involved, lowering the PE content contributes to maintaining membrane fluidity when yeast faces a rise in saturated acyl chains, as the smaller dimensions of the PE head group allow tighter packing of acyl chains than the head groups of other phospholipids (Silvius et al., 1986). Cells overexpressing Sct1p not only reduce their PE content, but also seem to protect PE from the excess of C16:0, as the change in saturation is smaller in PE than in the other major phospholipids. The rise in PI/PE ratio in response to increased saturation is fully consistent with the finding that overexpression of PI synthase suppresses the growth defect conferred by a mutation in the RSP5 gene impairing fatty acid desaturation (Kaliszewski et al., 2006).
It is worth noting that the increase of C16:0 in PE reduces its nonbilayer propensity (Koynova and Caffrey, 1994; Boumann et al., 2006). As a consequence, overexpression of Sct1p renders PE more suitable as a bilayer-forming lipid, which may account for the discovery of the SCT1 gene as a multicopy suppressor of a mutant defective in PC synthesis (Matsushita and Nikawa, 1995). The increase in fatty acid saturation probably allowed PE to substitute for PC and rescue cell growth. This is to our knowledge the first time that these results receive an adequate explanation.
PC is the preferred phospholipid for accommodating C16:0 upon overexpression of Sct1p in the pct1-deletion background. In the absence of an active CDP-choline route, PC acquires C16:0 acyl chains from its precursor PE and by acyl chain remodeling (Figure 1B). Compared to the methylation of PE, the CDP-choline route more readily incorporates C16:0 into PC (Boumann et al., 2003). The latter property may account for the connection between turnover of PC through the CDP-choline route and Sct1p activity reported previously. Deletion of SCT1 was shown to result in a 10-fold decrease in the turnover of PC through the CDP-choline route, whereas deletion of GPT2 caused a fivefold increase in turnover of PC through the CDP-choline route (Zaremberg and McMaster, 2002). Our observation that the extent of phosphorylation of chromosomally expressed Sct1p is higher in pct1 than in wild-type cells (Figure 6) may reflect this connection. Taken together, these findings substantiate the incorporation of C16:0 into PC as an adaptation to changes in fatty acid composition and assign PC a function as reservoir of C16:0. Of interest, mutants disturbed in the synthesis of TAG become sensitive to exogenous C16:0 when the PE methylation pathway is inactivated (Garbarino et al., 2009).
Regulation of fatty acid desaturation in mammalian cells may involve a glycerol-3-phosphate acyltransferase
Mammalian cells harbor 4 glycerol-3-phosphate acyltransferase (GPAT) isozymes, mitochondrial GPAT1 and GPAT2 and microsomal GPAT3 and GPAT4, which contain the same active-site motifs as their yeast functional homologues (Lewin et al., 1999; Wendel et al., 2009). GPAT1 seems to have a specificity for C16:0-CoA similar to that of Sct1p (Hammond et al., 2002), whereas the other GPATs do not show pronounced substrate preferences. Of interest, GPAT1-deficient mice display a reduced stearoyl-CoA desaturase 1 (SCD1) expression (Hammond et al., 2005), and overexpression of GPAT1 in mice specifically induces expression of SCD1 by an unknown mechanism not secondary to increased de novo lipogenesis (Linden et al., 2006). These observations are consistent with regulation of SCD1 in response to changes in fatty acid saturation conferred by GPAT1 and hint at a mechanism of competition for substrate between GPAT1 and SCD1 similar to that between Sct1p and Ole1p in yeast. Disturbances in the expression level and function of GPAT1 and SCD1 and the resulting variation in fatty acid desaturation have been implicated in apoptosis, insulin resistance, and obesity, stressing the importance of a proper balance between saturated and unsaturated fatty acids (Ostrander et al., 2001; Ntambi et al., 2002; Coll et al., 2008; Hagen et al., 2010). The present study provides evidence that the activity of a G3P acyltransferase is a novel parameter in maintaining this balance.
MATERIALS AND METHODS
Strains and culture conditions
The yeast strains listed in Table 1 were maintained on YPD agar plates (1% yeast extract, 2% bactopeptone, and 2% glucose). Strains harboring the pYES2 and/or pESC-HIS plasmids were obtained using the high-efficiency transformation protocol (Gietz and Schiestl, 2007) and maintained on plates containing synthetic glucose medium lacking uracil and/or histidine, respectively. Synthetic medium contained the following per liter: 6.7 g of yeast nitrogen base without amino acids (Difco, Franklin Lakes, NJ), 20 mg of adenine, 20 mg of arginine, 20 mg of histidine, 60 mg of leucine, 230 mg of lysine, 20 mg of methionine, 300 mg of threonine, 20 mg of tryptophan, 40 mg of uracil, and either 20 g of glucose (synthetic glucose medium) or 22 ml of 90% (vol/vol) lactic acid and 1 g of glucose, adjusted to pH 5.5 using KOH (SL). Strains were cultured aerobically at 30°C in semisynthetic lactate medium (SSL; Daum et al., 1982) or in SL. Strains containing the pYES2 and/or pESC-HIS plasmids were cultured in synthetic glucose medium without uracil and/or histidine, respectively, for 24 h, and then shifted to SGR medium containing 1% raffinose and 2% galactose at OD600 0.02 to induce the GAL1 promoter and cultured for another 24 h. Growth was monitored by measuring the OD at 600 nm on a single-beam spectrophotometer (Novaspec II; Pharmacia, GE Healthcare, Piscataway, NJ). Cells were harvested at mid-logarithmic growth phase (OD600 between 0.3 and 0.7).
TABLE 1:
Yeast strains and plasmids used in this study.
| Strain/plasmid | Genotype | Source |
|---|---|---|
| BY4741 | MATa his3Δ1 leu2Δ0 met15Δ0 ura3Δ0 | EUROSCARF |
| sct1 | Isogenic to BY4741 except sct1::kanMX4 | EUROSCARF |
| gpt2 | Isogenic to BY4741 except gpt2::kanMX4 | EUROSCARF |
| acb1 | Isogenic to BY4741 except acb1::kanMX4 | EUROSCARF |
| cst26 | Isogenic to BY4741 except cst26::kanMX4 | EUROSCARF |
| pct1 | Isogenic to BY4741 except pct1::LEU2 | This study |
| sct1pct1 | Isogenic to BY4741 except pct1::LEU2 sct1::kanMX4 | This study |
| gpt2pct1 | Isogenic to BY4741 except gpt2::kanMX4 pct1::LEU2 | This study |
| acb1pct1 | Isogenic to BY4741 except acb1::kanMX4 pct1::LEU2 | This study |
| cst26pct1 | Isogenic to BY4741 except cst26::kanMX4 pct1::LEU2 | This study |
| BY4741 SCT1-HH | Isogenic to BY4741 except SCT1-6His-3HA-loxP-KanMX-loxP | This study |
| pct1 SCT1-HH | Isogenic to BY4741 SCT1-HH except pct1::LEU2 | This study |
| pYES2 | High copy vector containing the GAL1 promoter and the URA3 gene | Invitrogen |
| pYES2-SCT1 | pYES2 containing the SCT1 gene | Zheng and Zou (2001) |
| pYES2-SCT1-HH | pYES2 containing the SCT1 gene with a C-terminal His6-HA3 tag | This study |
| pYES2-SCT1[G253L]HH | pYES2 containing the SCT1 gene with a C-terminal His6-HA3 tag and a Gly to Leu mutation at amino acid 253 | This study |
| pESC-HIS | High copy vector containing GAL1 and GAL10 promoters and the HIS3 gene | Stratagene |
| pESC-OLE1 | pESC-HIS containing the OLE1 gene with a C-terminal Myc tag behind the GAL1 promoter | This study |
EUROSCARF, European Saccharomyces cerevisiae Archive for Functional Analysis,
Institute of Molecular Biosciences, Johann Wolfgang Goethe-University Frankfurt, Frankfurt, Germany.
Growth phenotypes were analyzed by culturing cells to mid-log phase in synthetic glucose medium, washing them twice with water, and spotting 15 μl of cell suspension serially diluted to OD600 values of 10−1, 10−2, 10−3, 10−4, and 10−5 onto agar plates containing SGR. Plates were incubated at 30°C for 2–5 d as indicated.
To compare Sct1p expression patterns in the presence and absence of exogenous fatty acids, cells were cultured for 16 h in YPD or synthetic glucose medium and then transferred to YPD containing 1% (wt/vol) Brij35 with or without 0.5 mM C16:0 or 0.5 mM C18:1, or to synthetic glucose medium containing 0.2% Brij35 with or without 0.1 mM C16:0 or 0.1 mM C18:1 at OD600 0.002. Cells were grown for another 24 h, harvested at mid-logarithmic growth phase, and subjected to Western blotting as described later.
Molecular biology
The PCT1 gene was deleted in the strains BY4741, sct1, gpt2, acb1, and cst26 (Table 1) to yield the corresponding knockout strains by LEU2 insertion in PCR-mediated gene disruption using primers PCT1-LEU2-1 and -2 (Supplemental Table S1) as previously described (Boumann et al., 2003).
Chromosomal SCT1 was tagged with a His6HA3 epitope by amplification of the 6His-3HA-loxP-KanMX-loxP cassette from the pU6H3HA plasmid (De Antoni and Gallwitz, 2000) with primers SCT1-HH-1 and -2 (Supplemental Table S1) and subsequent insertion in the BY4741 and pct1 strains (Table 1).
The pYES2 (Invitrogen, Carlsbad, CA) and pESC-HIS (Stratagene, Santa Clara, CA) vectors were used to construct galactose-inducible overexpression vectors in which the expression of His6HA3-tagged Sct1p and Myc-tagged Ole1p was under control of the GAL1 promoter (Table 1). The pYES2-SCT1-HH overexpression vector was constructed by amplification of SCT1-6His-3HA from pct1 SCT1-HH chromosomal DNA using primers pYES-SCT1-1 and -2 (Supplemental Table S1) and insertion of the amplified fragment into the BamHI and XhoI restriction sites of pYES2 (Table 1). The pESC-OLE1 vector was constructed by amplification of OLE1 from BY4741 chromosomal DNA with primers pESC-OLE1-1 and -2 and insertion of the amplified fragment into the ApaI restriction site of pESC-HIS plasmid (Stratagene)
An inactive version of His6HA3-tagged Sct1p was obtained by introducing a mutation of Gly to Leu in the active site (Supplemental Table S1; Lewin et al., 1999; Han et al., 2008). Site-directed mutagenesis was performed using a QuikChange Site-Directed Mutagenesis Kit (Stratagene) with the pYES2-SCT1-HISHA plasmid and primers SCT1-G253L-1 and -2 to construct the pYES2-SCT1[G253L]-HISHA vector (Han et al., 2008).
Correct integration of PCR-amplified fragments in the genome was verified by PCR. Correct amplification of the genes inserted in the vectors was verified by DNA sequencing.
Pulse-chase labeling with deuterium-labeled methionine
Cells grown to mid-log phase in SL medium were collected by filtration, washed with amino acid–free SL, and resuspended at OD600 0.2–0.4 in 300 ml of SL medium supplemented with 120 mg/l (0.78 mM) (methyl-d3)-l-methionine (Cambridge Isotope Laboratories, Andover, MA) instead of 20 mg/l l-methionine. After 10 min, cells were collected by filtration, washed with amino acid–free SL, and transferred within 3 min to 250 ml SL medium supplemented with 300 mg/l l-methionine, and incubation at 30°C was continued. At various time points, 50-ml aliquots of cell culture were collected, inactivated by adding KCN, NaF, and NaN3 at 15 mM each, and stored on ice until further processing. All media used for washing and resuspension were at 30°C.
Lipid analysis by mass spectrometry
Cell homogenates were obtained by vortexing yeast cells corresponding to ∼25 OD600 units in the presence of glass beads (Boumann et al., 2003) and subjected to lipid extraction (Bligh and Dyer, 1959). Total lipid extracts corresponding to 300 nmol of phospholipid-phosphorus (Rouser et al., 1970) were dissolved in 200 μl of chloroform:methanol 1:1 (vol/vol) containing 10 mM ammonium acetate and analyzed by ESI-MS/MS on an API3000 triple quadrupole instrument (Applied Biosystems, Foster City, CA). Samples were injected into the instrument with a Hamilton Gastight 1710 syringe and a Harvard Apparatus Pump 11 at a constant flow rate of 3 μl/min. PC and (methyl-D3)3-PC were detected in parent ion scans for m/z 184 and 193, respectively, in the positive ion mode, PE in neutral loss scans for 141 atomic mass units in the positive ion mode, PI in parent ion scans for m/z 241 in the negative ion mode, and PS in neutral loss scans for 87 atomic mass units in the negative ion mode. Other settings were as previously described (Brügger et al., 1997). Signal intensities were quantified using Analyst software (Applied Biosystems/MDS Sciex, Toronto, Canada), taking into account the three most abundant [M + H]+ isotopic signals. An equimolar mixture of biologically relevant PC species (Avanti Polar Lipids, Alabaster, AL) indicated that the signal intensities are representative of the relative abundance of PC species under the conditions used. Yeast samples destined for analysis of lyso-PA and PA were lyophilized and subjected to butanol extraction and liquid chromatography-tandem mass spectrometry (LC-MS/MS) as described (Scherer et al., 2009, 2010).
Fatty acid analysis
Yeast total lipid extracts prepared as earlier and corresponding to 1 μmol of phospholipid phosphorus were transesterified by heating at 70°C for 2 h in 2.5% (vol/vol) H2SO4 in methanol. The fatty acid methylesters were extracted in hexane and separated on a Trace GC ultra gas chromatograph (Thermo Electron, Interscience, Louvain-la-Neuve, Belgium) using a Restek Stabilwax column and a temperature gradient from 170 to 210°C. Fatty acid methylesters were identified and signal intensities were calibrated using a fatty acid methylester standard (Nu-Chek-Prep, Elysian, MN).
[14C]Acetate labeling and analysis of lipid composition by thin-layer chromatography
Cells grown to mid-log phase at 30°C in 5 ml of SGR medium without uracil were labeled with 75 μCi 1-[14C]acetate (56 mCi/mmol, GE Healthcare) for 1 h at 30°C, harvested by centrifugation, and resuspended in 1 ml 5% trichloroacetic acid. Subsequently cells were pelleted, washed twice with water, homogenized, and subjected to lipid extraction as described. Lipid extracts were subjected to liquid scintillation counting, determination of total phospholipid-phosphorus content (Rouser et al., 1970), and analysis of neutral lipid and phospholipid composition by thin-layer chromatography (TLC; de Kroon et al., 1997; Schneiter and Daum, 2006). The radioactive spots on the TLC plates were visualized and quantified using a Personal Molecular Imager FX PhosphorImager (Bio-Rad, Hercules, CA). Steady-state phospholipid and neutral lipid composition was analyzed by TLC (de Kroon et al., 1997; Schneiter and Daum, 2006) using lipid extracts corresponding to 300 nmol of phospholipid-phosphorus. Spots were visualized with I2 vapor, and phospholipid-containing spots were scraped off. The amount of inorganic phosphorus in TLC spots was measured according to Rouser et al. (1970) after destruction in 70% perchloric acid for 3 h at 180°C.
Western blotting
Logarithmically growing cells were harvested, washed, resuspended in 0.1 M NaOH, and incubated at room temperature for 5 min, pelleted, resuspended in SDS–PAGE sample buffer containing 4% β-mercaptoethanol, and incubated for 4 min at 95°C (Kushnirov, 2000). Samples corresponding to 10 μg of protein (as determined by the Pierce BCA protein assay kit [Thermo Fisher Scientific, Rockford, IL], using Pierce YPER as detergent and bovine serum albumin as a standard) were analyzed by 10% SDS–PAGE followed by Western blotting with antibodies against HA (mouse anti-HA 12CA5; Roche Diagnostics, Indianapolis, IN), Myc (mouse anti–c-Myc immunoglobulin 9E10, sc-40; Santa Cruz Biotechnology, Santa Cruz, CA), and Sec61p (a kind gift from R. Schekman, University of California, Berkeley, CA), using horseradish peroxidase–conjugated secondary antibodies, followed by detection with SuperSignal West Pico Chemiluminescent Substrate (Pierce). Densitometry was performed using ImageJ software (National Institutes of Health, Bethesda, MD).
Supplementary Material
Acknowledgments
We thank Antoinette Killian for critically reading the manuscript; Giulia Ravaioli, Matthijs Kol, Ruud Cox, and Tine Michels for help with the experiments; Paul Peijzel for assistance with gas chromatography; Chris van de Lest and Jeroen Janssen for assistance with mass spectrometry; and Ben de Kruijff and the other members of the groups Biochemistry of Membranes and Membrane Enzymology for valuable discussions. We also thank J. Zou (National Research Council Canada, Ottawa, Canada) for sending us the pYES2-SCT1 plasmid. This work was supported by the Netherlands Division of Chemical Sciences with financial aid from the Netherlands Organization for Scientific Research.
Abbreviations used:
- G3P
glycerol-3-phosphate
- GPAT
glycerol-3-phosphate acyltransferase
- ESI-MS/MS
electrospray ionization tandem mass spectrometry
- LC-MS/MS
liquid chromatography-tandem mass spectrometry
- lyso-PA
lysophosphatidic acid
- PA
phosphatidic acid
- PC
phosphatidylcholine
- PE
phosphatidylethanolamine
- PI
phosphatidylinositol
- PS
phosphatidylserine
- SGR
synthetic galactose-raffinose medium
- SL
synthetic lactate medium
- SSL
semisynthetic lactate medium
- TAG
triacylglycerol
- TLC
thin-layer chromatography
Footnotes
This article was published online ahead of print in MBoC in Press (http://www.molbiolcell.org/cgi/doi/10.1091/mbc.E11-07-0624) on February 9, 2012.
REFERENCES
- Aguilar PS, de Mendoza D. Control of fatty acid desaturation: a mechanism conserved from bacteria to humans. Mol Microbiol. 2006;62:1507–1514. doi: 10.1111/j.1365-2958.2006.05484.x. [DOI] [PubMed] [Google Scholar]
- Bligh EG, Dyer WJ. A rapid method of total lipid extraction and purification. Can. J Biochem Physiol. 1959;37:911–917. doi: 10.1139/o59-099. [DOI] [PubMed] [Google Scholar]
- Boumann HA, Damen MJ, Versluis C, Heck AJ, de Kruijff B, de Kroon AI. The two biosynthetic routes leading to phosphatidylcholine in yeast produce different sets of molecular species. Evidence for lipid remodeling. Biochemistry. 2003;42:3054–3059. doi: 10.1021/bi026801r. [DOI] [PubMed] [Google Scholar]
- Boumann HA, Gubbens J, Koorengevel MC, Oh CS, Martin CE, Heck AJ, Patton-Vogt J, Henry SA, de Kruijff B, de Kroon AI. Depletion of phosphatidylcholine in yeast induces shortening and increased saturation of the lipid acyl chains: evidence for regulation of intrinsic membrane curvature in a eukaryote. Mol Biol Cell. 2006;17:1006–1017. doi: 10.1091/mbc.E05-04-0344. [DOI] [PMC free article] [PubMed] [Google Scholar]
- Bratschi MW, Burrowes DP, Kulaga A, Cheung JF, Alvarez AL, Kearley J, Zaremberg V. Glycerol-3-phosphate acyltransferases gat1p and gat2p are microsomal phosphoproteins with differential contributions to polarized cell growth. Eukaryot Cell. 2009;8:1184–1196. doi: 10.1128/EC.00085-09. [DOI] [PMC free article] [PubMed] [Google Scholar]
- Brügger B, Erben G, Sandhoff R, Wieland FT, Lehmann WD. Quantitative analysis of biological membrane lipids at the low picomole level by nano-electrospray ionization tandem mass spectrometry. Proc Natl Acad Sci USA. 1997;94:2339–2344. doi: 10.1073/pnas.94.6.2339. [DOI] [PMC free article] [PubMed] [Google Scholar]
- Carman GM, Kersting MC. Phospholipid synthesis in yeast: regulation by phosphorylation. Biochem Cell Biol. 2004;82:62–70. doi: 10.1139/o03-064. [DOI] [PubMed] [Google Scholar]
- Choi JY, Stukey J, Hwang SY, Martin CE. Regulatory elements that control transcription activation and unsaturated fatty acid-mediated repression of the Saccharomyces cerevisiae OLE1 gene. J Biol Chem. 1996;271:3581–3589. doi: 10.1074/jbc.271.7.3581. [DOI] [PubMed] [Google Scholar]
- Coll T, Eyre E, Rodriguez-Calvo R, Palomer X, Sanchez RM, Merlos M, Laguna JC, Vazquez-Carrera M. Oleate reverses palmitate-induced insulin resistance and inflammation in skeletal muscle cells. J Biol Chem. 2008;283:11107–11116. doi: 10.1074/jbc.M708700200. [DOI] [PubMed] [Google Scholar]
- Daum G, Bohni PC, Schatz G. Import of proteins into mitochondria. Cytochrome b2 and cytochrome c peroxidase are located in the intermembrane space of yeast mitochondria. J Biol Chem. 1982;257:13028–13033. [PubMed] [Google Scholar]
- De Antoni A, Gallwitz D. A novel multi-purpose cassette for repeated integrative epitope tagging of genes in Saccharomyces cerevisiae. Gene. 2000;246:179–185. doi: 10.1016/s0378-1119(00)00083-4. [DOI] [PubMed] [Google Scholar]
- de Kroon AI, Dolis D, Mayer A, Lill R, de Kruijff B. Phospholipid composition of highly purified mitochondrial outer membranes of rat liver and Neurospora crassa. Is cardiolipin present in the mitochondrial outer membrane? Biochim Biophys Acta. 1997;1325:108–116. doi: 10.1016/s0005-2736(96)00240-4. [DOI] [PubMed] [Google Scholar]
- Dowhan W. Molecular basis for membrane phospholipid diversity: why are there so many lipids? Annu Rev Biochem. 1997;66:199–232. doi: 10.1146/annurev.biochem.66.1.199. [DOI] [PubMed] [Google Scholar]
- Gaigg B, et al. Depletion of acyl-coenzyme A-binding protein affects sphingolipid synthesis and causes vesicle accumulation and membrane defects in Saccharomyces cerevisiae. Mol Biol Cell. 2001;12:1147–1160. doi: 10.1091/mbc.12.4.1147. [DOI] [PMC free article] [PubMed] [Google Scholar]
- Garbarino J, Padamsee M, Wilcox L, Oelkers PM, D'Ambrosio D, Ruggles KV, Ramsey N, Jabado O, Turkish A, Sturley SL. Sterol and diacylglycerol acyltransferase deficiency triggers fatty acid-mediated cell death. J Biol Chem. 2009;284:30994–31005. doi: 10.1074/jbc.M109.050443. [DOI] [PMC free article] [PubMed] [Google Scholar]
- Gietz RD, Schiestl RH. High-efficiency yeast transformation using the LiAc/SS carrier DNA/PEG method. Nat Protoc. 2007;2:31–34. doi: 10.1038/nprot.2007.13. [DOI] [PubMed] [Google Scholar]
- Hagen RM, Rodriguez-Cuenca S, Vidal-Puig A. An allostatic control of membrane lipid composition by SREBP1. FEBS Lett. 2010;584:2689–2698. doi: 10.1016/j.febslet.2010.04.004. [DOI] [PubMed] [Google Scholar]
- Hammond LE, Gallagher PA, Wang S, Hiller S, Kluckman KD, Posey-Marcos EL, Maeda N, Coleman RA. Mitochondrial glycerol-3-phosphate acyltransferase-deficient mice have reduced weight and liver triacylglycerol content and altered glycerolipid fatty acid composition. Mol Cell Biol. 2002;22:8204–8214. doi: 10.1128/MCB.22.23.8204-8214.2002. [DOI] [PMC free article] [PubMed] [Google Scholar]
- Hammond LE, Neschen S, Romanelli AJ, Cline GW, Ilkayeva OR, Shulman GI, Muoio DM, Coleman RA. Mitochondrial glycerol-3-phosphate acyltransferase-1 is essential in liver for the metabolism of excess acyl-CoAs. J Biol Chem. 2005;280:25629–25636. doi: 10.1074/jbc.M503181200. [DOI] [PubMed] [Google Scholar]
- Han GS, O'Hara L, Carman GM, Siniossoglou S. An unconventional diacylglycerol kinase that regulates phospholipid synthesis and nuclear membrane growth. J Biol Chem. 2008;283:20433–20442. doi: 10.1074/jbc.M802903200. [DOI] [PMC free article] [PubMed] [Google Scholar]
- Harkins AL, London SD, Dolan JW. An upstream regulator and downstream target of phospholipase D1 activity during pheromone response in Saccharomyces cerevisiae. FEMS Yeast Res. 2008;8:237–244. doi: 10.1111/j.1567-1364.2007.00336.x. [DOI] [PubMed] [Google Scholar]
- Hoppe T, Matuschewski K, Rape M, Schlenker S, Ulrich HD, Jentsch S. Activation of a membrane-bound transcription factor by regulated ubiquitin/proteasome-dependent processing. Cell. 2000;102:577–586. doi: 10.1016/s0092-8674(00)00080-5. [DOI] [PubMed] [Google Scholar]
- Kajiwara S, Aritomi T, Suga K, Ohtaguchi K, Kobayashi O. Overexpression of the OLE1 gene enhances ethanol fermentation by Saccharomyces cerevisiae. Appl Microbiol Biotechnol. 2000;53:568–574. doi: 10.1007/s002530051658. [DOI] [PubMed] [Google Scholar]
- Kaliszewski P, Ferreira T, Gajewska B, Szkopinska A, Berges T, Zoladek T. Enhanced levels of Pis1p (phosphatidylinositol synthase) improve the growth of Saccharomyces cerevisiae cells deficient in Rsp5 ubiquitin ligase. Biochem J. 2006;395:173–181. doi: 10.1042/BJ20051726. [DOI] [PMC free article] [PubMed] [Google Scholar]
- Karanasios E, Han GS, Xu Z, Carman GM, Siniossoglou S. A phosphorylation-regulated amphipathic helix controls the membrane translocation and function of the yeast phosphatidate phosphatase. Proc Natl Acad Sci USA. 2010;107:17539–17544. doi: 10.1073/pnas.1007974107. [DOI] [PMC free article] [PubMed] [Google Scholar]
- Kelley MJ, Bailis AM, Henry SA, Carman GM. Regulation of phospholipid biosynthesis in Saccharomyces cerevisiae by inositol. Inositol is an inhibitor of phosphatidylserine synthase activity. J Biol Chem. 1988;263:18078–18085. [PubMed] [Google Scholar]
- Koynova R, Caffrey M. Phases and phase transitions of the hydrated phosphatidylethanolamines. Chem Phys Lipids. 1994;69:1–34. doi: 10.1016/0009-3084(94)90024-8. [DOI] [PubMed] [Google Scholar]
- Kurat CF, Wolinski H, Petschnigg J, Kaluarachchi S, Andrews B, Natter K, Kohlwein SD. Cdk1/Cdc28-dependent activation of the major triacylglycerol lipase Tgl4 in yeast links lipolysis to cell-cycle progression. Mol Cell. 2009;33:53–63. doi: 10.1016/j.molcel.2008.12.019. [DOI] [PubMed] [Google Scholar]
- Kushnirov VV. Rapid and reliable protein extraction from yeast. Yeast. 2000;16:857–860. doi: 10.1002/1097-0061(20000630)16:9<857::AID-YEA561>3.0.CO;2-B. [DOI] [PubMed] [Google Scholar]
- Le Guedard M, et al. PSI1 is responsible for the stearic acid enrichment that is characteristic of phosphatidylinositol in yeast. FEBS J. 2009;276:6412–6424. doi: 10.1111/j.1742-4658.2009.07355.x. [DOI] [PubMed] [Google Scholar]
- Lewin TM, Wang P, Coleman RA. Analysis of amino acid motifs diagnostic for the sn-glycerol-3-phosphate acyltransferase reaction. Biochemistry. 1999;38:5764–5771. doi: 10.1021/bi982805d. [DOI] [PubMed] [Google Scholar]
- Lin M, Unden H, Jacquier N, Schneiter R, Just U, Hofken T. The Cdc42 effectors Ste20, Cla4, and Skm1 down-regulate the expression of genes involved in sterol uptake by a mitogen-activated protein kinase-independent pathway. Mol Biol Cell. 2009;20:4826–4837. doi: 10.1091/mbc.E09-01-0034. [DOI] [PMC free article] [PubMed] [Google Scholar]
- Linden D, et al. Liver-directed overexpression of mitochondrial glycerol-3-phosphate acyltransferase results in hepatic steatosis, increased triacylglycerol secretion and reduced fatty acid oxidation. FASEB J. 2006;20:434–443. doi: 10.1096/fj.05-4568com. [DOI] [PubMed] [Google Scholar]
- Loewen CJ, Gaspar ML, Jesch SA, Delon C, Ktistakis NT, Henry SA, Levine TP. Phospholipid metabolism regulated by a transcription factor sensing phosphatidic acid. Science. 2004;304:1644–1647. doi: 10.1126/science.1096083. [DOI] [PubMed] [Google Scholar]
- Los DA, Murata N. Membrane fluidity and its roles in the perception of environmental signals. Biochim Biophys Acta. 2004;1666:142–157. doi: 10.1016/j.bbamem.2004.08.002. [DOI] [PubMed] [Google Scholar]
- Martin CE, Oh CS, Jiang Y. Regulation of long chain unsaturated fatty acid synthesis in yeast. Biochim Biophys Acta. 2007;1771:271–285. doi: 10.1016/j.bbalip.2006.06.010. [DOI] [PubMed] [Google Scholar]
- Matsushita M, Nikawa J. Isolation and characterization of a SCT1 gene which can suppress a choline-transport mutant of Saccharomyces cerevisiae. J Biochem. 1995;117:447–451. doi: 10.1093/jb/117.2.447. [DOI] [PubMed] [Google Scholar]
- Natter K, Leitner P, Faschinger A, Wolinski H, McCraith S, Fields S, Kohlwein SD. The spatial organization of lipid synthesis in the yeast Saccharomyces cerevisiae derived from large scale green fluorescent protein tagging and high resolution microscopy. Mol Cell Proteomics. 2005;4:662–672. doi: 10.1074/mcp.M400123-MCP200. [DOI] [PubMed] [Google Scholar]
- Neuwald AF. Barth syndrome may be due to an acyltransferase deficiency. Curr Biol. 1997;7:R465–R466. doi: 10.1016/s0960-9822(06)00237-5. [DOI] [PubMed] [Google Scholar]
- Ntambi JM, Miyazaki M, Stoehr JP, Lan H, Kendziorski CM, Yandell BS, Song Y, Cohen P, Friedman JM, Attie AD. Loss of stearoyl-CoA desaturase-1 function protects mice against adiposity. Proc Natl Acad Sci USA. 2002;99:11482–11486. doi: 10.1073/pnas.132384699. [DOI] [PMC free article] [PubMed] [Google Scholar]
- O'Hara L, Han GS, Peak-Chew S, Grimsey N, Carman GM, Siniossoglou S. Control of phospholipid synthesis by phosphorylation of the yeast lipin Pah1p/Smp2p Mg2+-dependent phosphatidate phosphatase. J Biol Chem. 2006;281:34537–34548. doi: 10.1074/jbc.M606654200. [DOI] [PMC free article] [PubMed] [Google Scholar]
- Ostrander DB, Sparagna GC, Amoscato AA, McMillin JB, Dowhan W. Decreased cardiolipin synthesis corresponds with cytochrome c release in palmitate-induced cardiomyocyte apoptosis. J Biol Chem. 2001;276:38061–38067. doi: 10.1074/jbc.M107067200. [DOI] [PubMed] [Google Scholar]
- Pineau L, Bonifait L, Berjeaud JM, Alimardani-Theuil P, Berges T, Ferreira T. A lipid-mediated quality control process in the Golgi apparatus in yeast. Mol Biol Cell. 2008;19:807–821. doi: 10.1091/mbc.E07-06-0600. [DOI] [PMC free article] [PubMed] [Google Scholar]
- Pineau L, Colas J, Dupont S, Beney L, Fleurat-Lessard P, Berjeaud JM, Berges T, Ferreira T. Lipid-induced ER stress: synergistic effects of sterols and saturated fatty acids. Traffic. 2009;10:673–690. doi: 10.1111/j.1600-0854.2009.00903.x. [DOI] [PubMed] [Google Scholar]
- Ptacek J, et al. Global analysis of protein phosphorylation in yeast. Nature. 2005;438:679–684. doi: 10.1038/nature04187. [DOI] [PubMed] [Google Scholar]
- Rossler H, Rieck C, Delong T, Hoja U, Schweizer E. Functional differentiation and selective inactivation of multiple Saccharomyces cerevisiae genes involved in very-long-chain fatty acid synthesis. Mol Genet Genomics. 2003;269:290–298. doi: 10.1007/s00438-003-0836-0. [DOI] [PubMed] [Google Scholar]
- Rouser G, Fkeischer S, Yamamoto A. Two dimensional then layer chromatographic separation of polar lipids and determination of phospholipids by phosphorus analysis of spots. Lipids. 1970;5:494–496. doi: 10.1007/BF02531316. [DOI] [PubMed] [Google Scholar]
- Scherer M, Schmitz G, Liebisch G. High-throughput analysis of sphingosine 1-phosphate, sphinganine 1-phosphate, and lysophosphatidic acid in plasma samples by liquid chromatography-tandem mass spectrometry. Clin Chem. 2009;55:1218–1222. doi: 10.1373/clinchem.2008.113779. [DOI] [PubMed] [Google Scholar]
- Scherer M, Schmitz G, Liebisch G. Simultaneous quantification of cardiolipin, bis(monoacylglycero)phosphate and their precursors by hydrophilic interaction LC-MS/MS including correction of isotopic overlap. Anal Chem. 2010;82:8794–8799. doi: 10.1021/ac1021826. [DOI] [PubMed] [Google Scholar]
- Schjerling CK, Hummel R, Hansen JK, Borsting C, Mikkelsen JM, Kristiansen K, Knudsen J. Disruption of the gene encoding the acyl-CoA-binding protein (ACB1) perturbs acyl-CoA metabolism in Saccharomyces cerevisiae. J Biol Chem. 1996;271:22514–22521. doi: 10.1074/jbc.271.37.22514. [DOI] [PubMed] [Google Scholar]
- Schneiter R, et al. Electrospray ionization tandem mass spectrometry (ESI-MS/MS) analysis of the lipid molecular species composition of yeast subcellular membranes reveals acyl chain-based sorting/remodeling of distinct molecular species en route to the plasma membrane. J Cell Biol. 1999;146:741–754. doi: 10.1083/jcb.146.4.741. [DOI] [PMC free article] [PubMed] [Google Scholar]
- Schneiter R, Daum G. Analysis of yeast lipids. Methods Mol Biol. 2006;313:75–84. doi: 10.1385/1-59259-958-3:075. [DOI] [PubMed] [Google Scholar]
- Silvius JR, Brown PM, O'Leary TJ. Role of head group structure in the phase behavior of amino phospholipids. 1. Hydrated and dehydrated lamellar phases of saturated phosphatidylethanolamine analogues. Biochemistry. 1986;25:4249–4258. doi: 10.1021/bi00363a012. [DOI] [PubMed] [Google Scholar]
- Singer SJ, Nicolson GL. The fluid mosaic model of the structure of cell membranes. Science. 1972;175:720–731. doi: 10.1126/science.175.4023.720. [DOI] [PubMed] [Google Scholar]
- Tehlivets O, Scheuringer K, Kohlwein SD. Fatty acid synthesis and elongation in yeast. Biochim Biophys Acta. 2007;1771:255–270. doi: 10.1016/j.bbalip.2006.07.004. [DOI] [PubMed] [Google Scholar]
- Tuller G, Nemec T, Hrastnik C, Daum G. Lipid composition of subcellular membranes of an FY1679-derived haploid yeast wild-type strain grown on different carbon sources. Yeast. 1999;15:1555–1564. doi: 10.1002/(SICI)1097-0061(199910)15:14<1555::AID-YEA479>3.0.CO;2-Z. [DOI] [PubMed] [Google Scholar]
- Wagner S, Paltauf F. Generation of glycerophospholipid molecular species in the yeast Saccharomyces cerevisiae. Fatty acid pattern of phospholipid classes and selective acyl turnover at sn-1 and sn-2 positions. Yeast. 1994;10:1429–1437. doi: 10.1002/yea.320101106. [DOI] [PubMed] [Google Scholar]
- Wendel AA, Lewin TM, Coleman RA. Glycerol-3-phosphate acyltransferases: rate limiting enzymes of triacylglycerol biosynthesis. Biochim Biophys Acta. 2009;1791:501–506. doi: 10.1016/j.bbalip.2008.10.010. [DOI] [PMC free article] [PubMed] [Google Scholar]
- Zaremberg V, McMaster CR. Differential partitioning of lipids metabolized by separate yeast glycerol-3-phosphate acyltransferases reveals that phospholipase D generation of phosphatidic acid mediates sensitivity to choline-containing lysolipids and drugs. J Biol Chem. 2002;277:39035–39044. doi: 10.1074/jbc.M207753200. [DOI] [PubMed] [Google Scholar]
- Zheng Z, Zou J. The initial step of the glycerolipid pathway: identification of glycerol 3-phosphate/dihydroxyacetone phosphate dual substrate acyltransferases in Saccharomyces cerevisiae. J Biol Chem. 2001;276:41710–41716. doi: 10.1074/jbc.M104749200. [DOI] [PubMed] [Google Scholar]
Associated Data
This section collects any data citations, data availability statements, or supplementary materials included in this article.